

USD/ZAR ANALYSIS
- Vaccine uncertainty lingers over South African public
- Global sentiment favors ZAR
- Upcoming SA unemployment data
RAND FUNDAMENTAL BACKDROP
The Rand opened up with some hesitancy this week due to vaccine expiration concerns as well as the efficacy of the AstraZeneca/Oxford vaccine – which showed poor results against the 501Y.V2 COVID-19 variant. South Africa now looks to other suppliers – Johnson and Johnson in particular who’s vaccines show greater success against the mutated strain. This being said, the much awaited U.S. stimulus package has encouraged the Rand as Democrats move to pass the package without Republican support. Should this come to fruition, the external financial environment would result in an extremely supportive climate for the local currency.
Upcoming data this week from a South African perspective brings the Unemployment Rate (Q4) data into focus on Thursday. This should give a good gauge of the economic status of the country. The rate has been consistently over 20% for many years now, with the previous figure at 30.8% (see chart below). It is unlikely to fall toward the 20% region due to the COVID-19 pandemic, but any unexpected positive deviation could result in notable downward USD/ZAR price fluctuations.
Source: DailyFX economic calendar

Recommended by Warren Venketas
Trading Forex News: The Strategy
South African Unemployment

Chart prepared by Warren Venketas, Refinitiv
South African R2030 bond yields have ticked slightly higher today trading at 8.53% (as of this writing). South African sovereign bonds remain attractive for foreign investors which is likely to continue, and should theoretically lend itself to a stronger Rand going forward.
Benchmark 2030 government bond yields (R2030) vs USD/ZAR
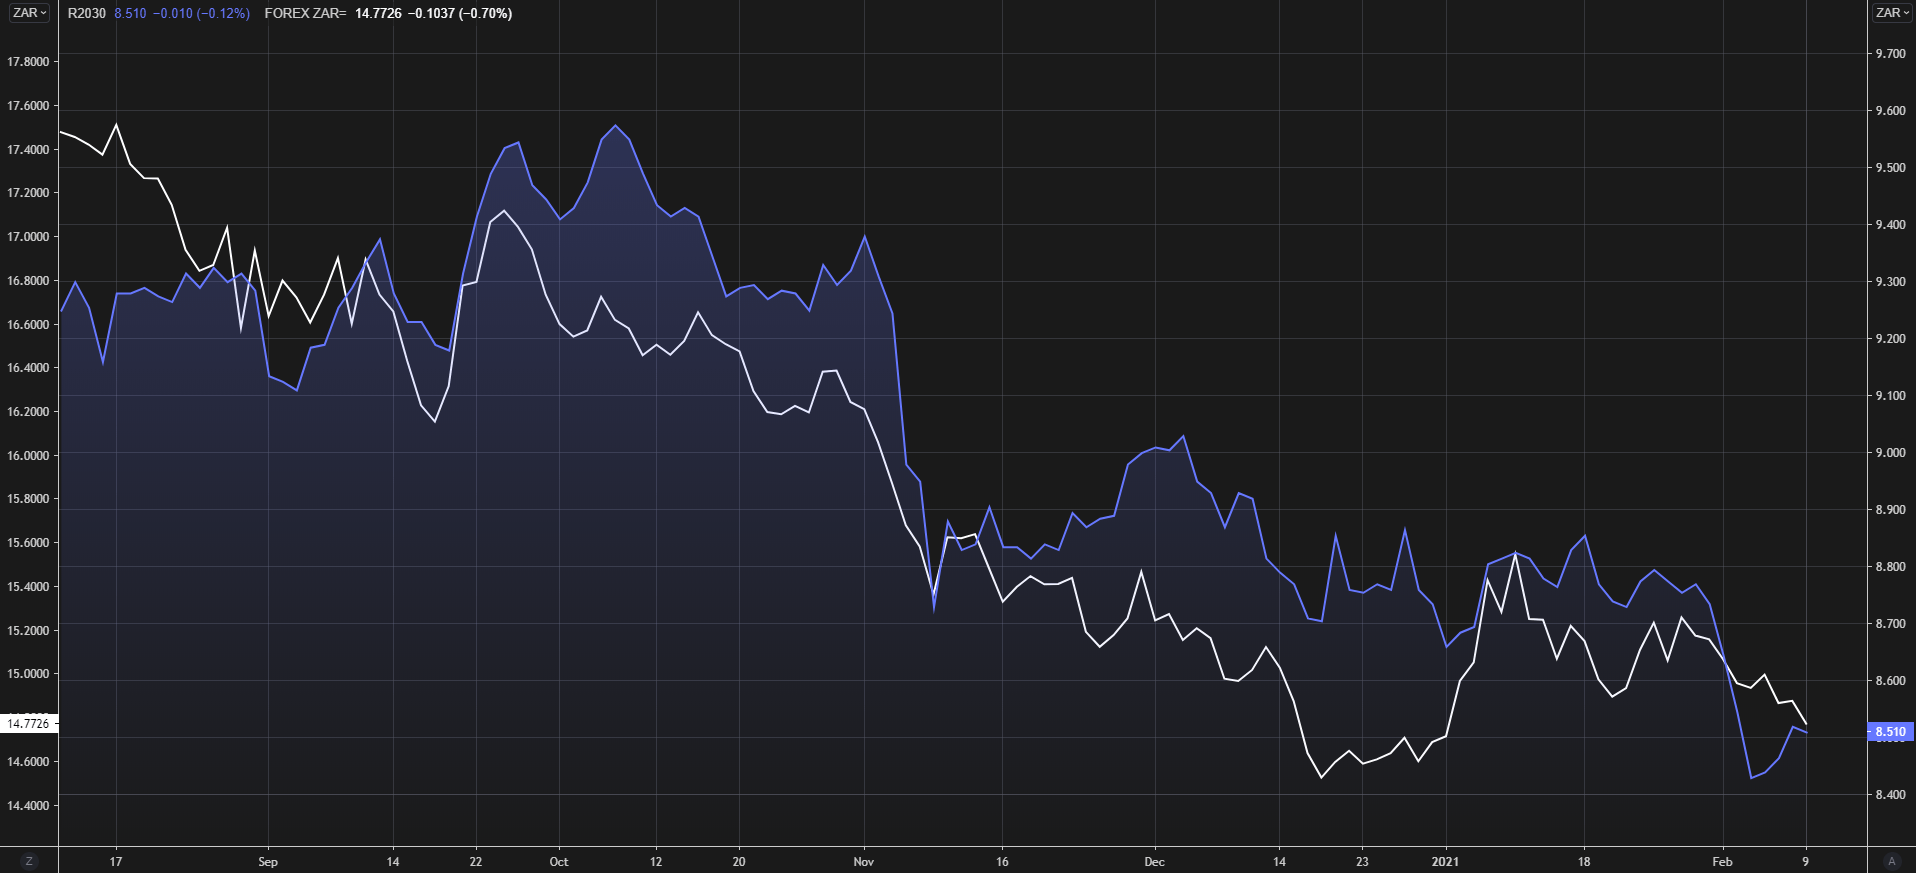
Chart prepared by Warren Venketas, Refinitiv
TECHNICAL ANALYSIS
Starts in:
Live now:
Feb 16
( 18:02 GMT )

Keep up to date with price action setups!
Trading Price Action
USD/ZAR DAILY CHART
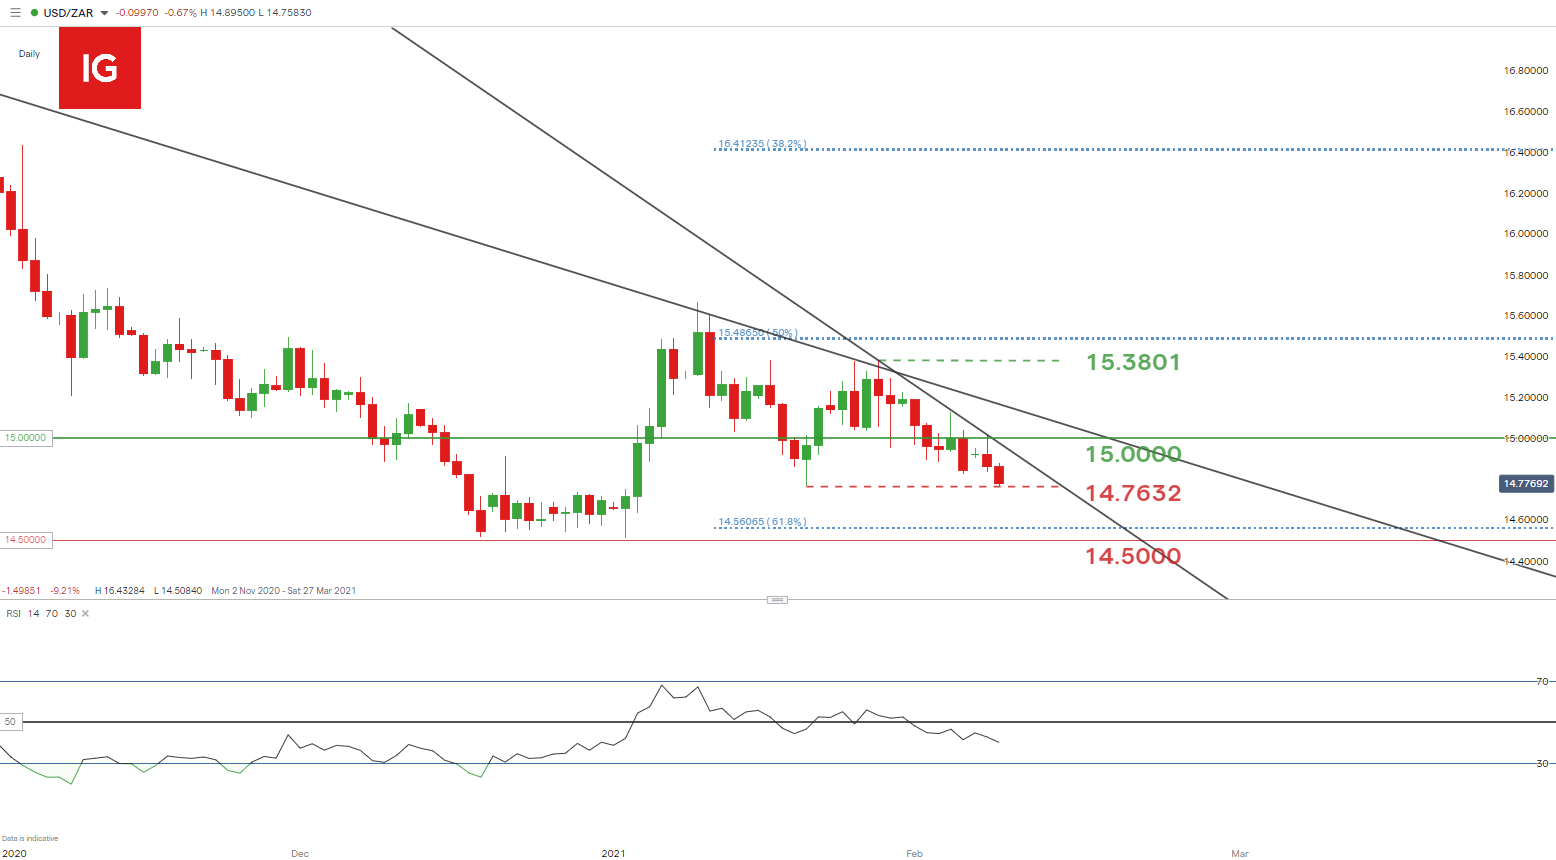
Chart prepared by Warren Venketas, IG
The strong push lower this week shows the USD/ZAR pair hovering around the prior swing low at 14.7632. Several attempts by bulls to push prices back above the 15.0000 psychological level were rejected as price action conforms to the recent downtrend. Further downside will highlight the 61.8% Fibonacci level at 14.5606 (blue) as initial support while USD/ZAR bulls will look to pierce above the steeper short-term trendline before 15.0000.
The steeper trendline resistance reflects within the Relative Strength Index (RSI) which is firmly below the 50 mid-level suggesting a strong bearish bias.
Due to the significant influence from the aforementioned U.S. stimulus package, price action may well consolidate while the market awaits further clarification regarding the $1.9 trillion relief package.
USD/ZAR: KEY TECHNICAL POINTS TO CONSIDER
- 15.00000 resistance
- 14.7632 support break
- 14.5606 (61.8% Fibonacci level) as support target
- Bearish momentum confirmed by RSI
— Written by Warren Venketas for DailyFX.com
Contact and follow Warren on Twitter: @WVenketas
Be the first to comment