

alvarez/E+ via Getty Images
Like most apartment REITs, Camden Property Trust (NYSE:CPT) shares have been battered thus far in 2022, falling 37% as higher interest rates, slowing rental rate growth, and fears of looming increases of new supply have weighted on the share price. At today’s price investors have the opportunity to own a terrific collection of apartment assets at a bargain price.
Operating trends remain strong setting up a record 2023
Camden reported another strong set of results in the third quarter with same-store NOI increasing 16% over 2021 levels. NOI growth was driven by nearly 12% revenue growth (as rents surged). While the rapid rental rate increases of the past 15 months have slowed, rents are still increasing at a strong clip into the fourth quarter. As shown below, blended same-store rent growth for leases signed in October in up nearly 7% year over year while occupancy remains above 96%.
October Metrics (Camden 3Q22 Supplemental)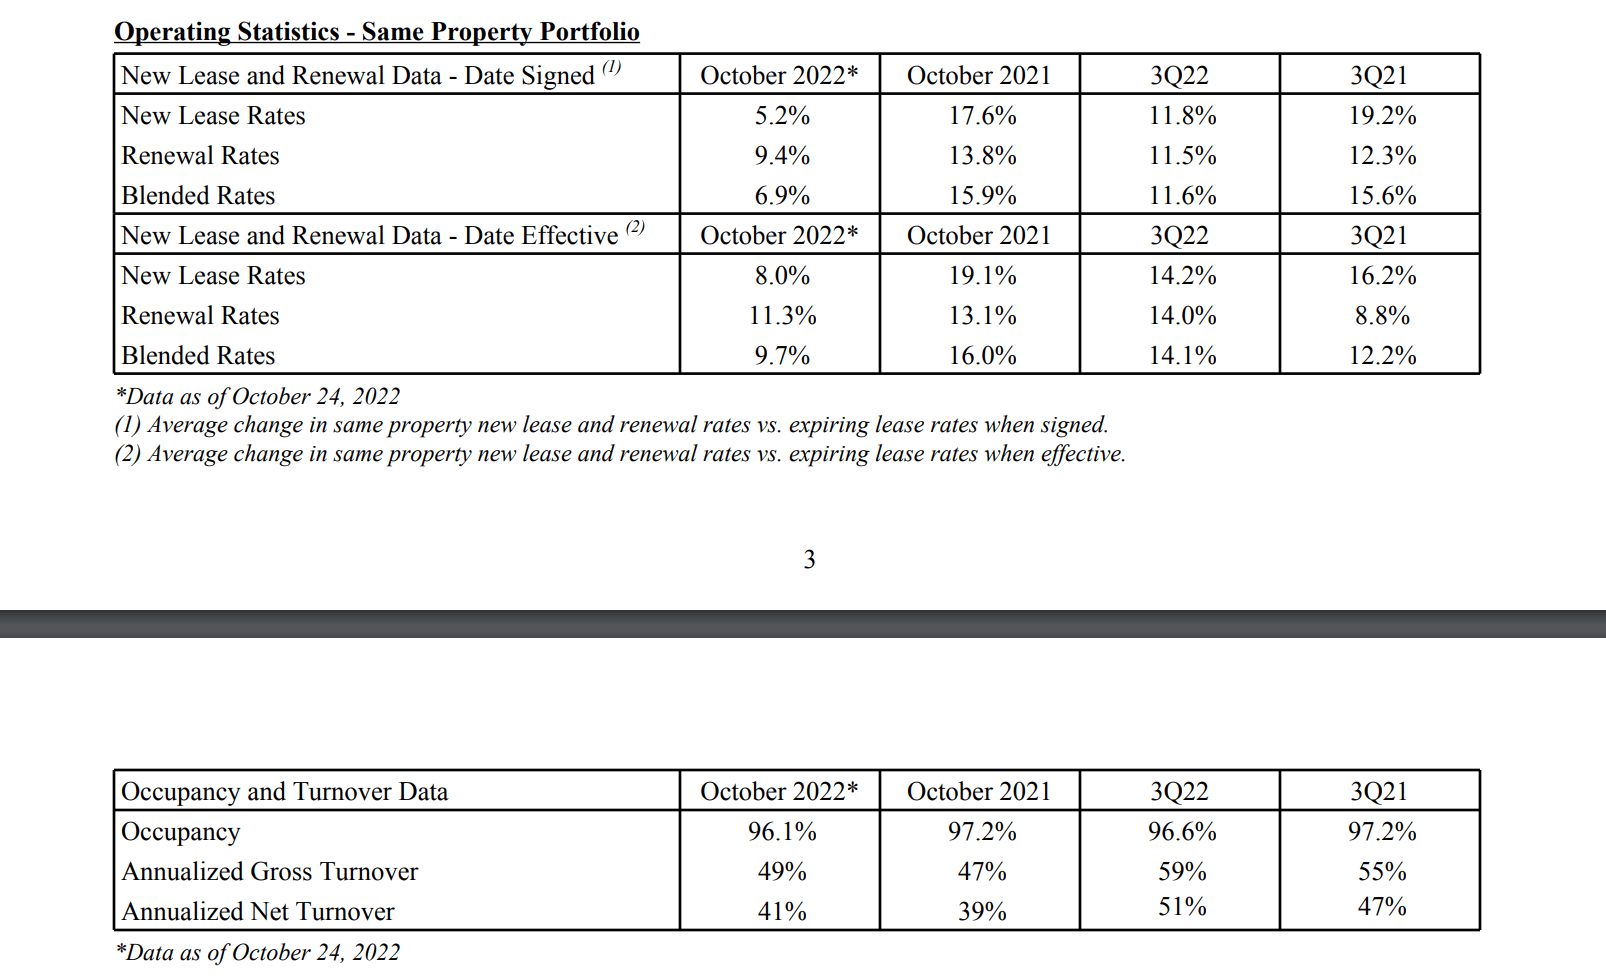
Importantly, the strong rent growth experienced throughout 2022 sets Camden up for another record year in 2022 as already achieved rental growth will have a full year impact in 2023. On the most recent earnings call, management has guided to a 2023 embedded rental growth of 4.5-5%.
2023 Embedded rental growth (3Q22 Transcript (Seeking Alpha) )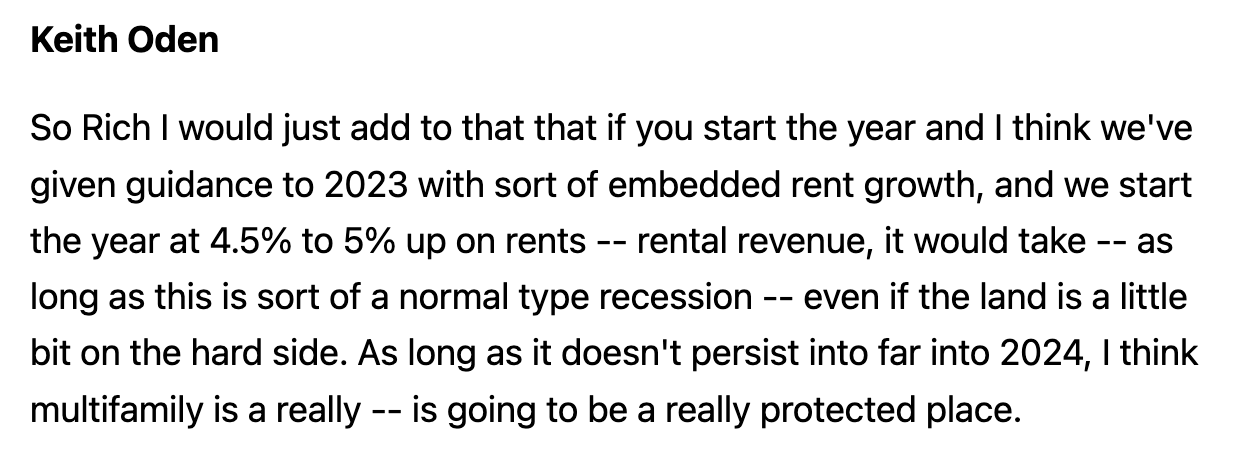
Sunbelt is a long-term winner
Overview (Camden Investor Presentation)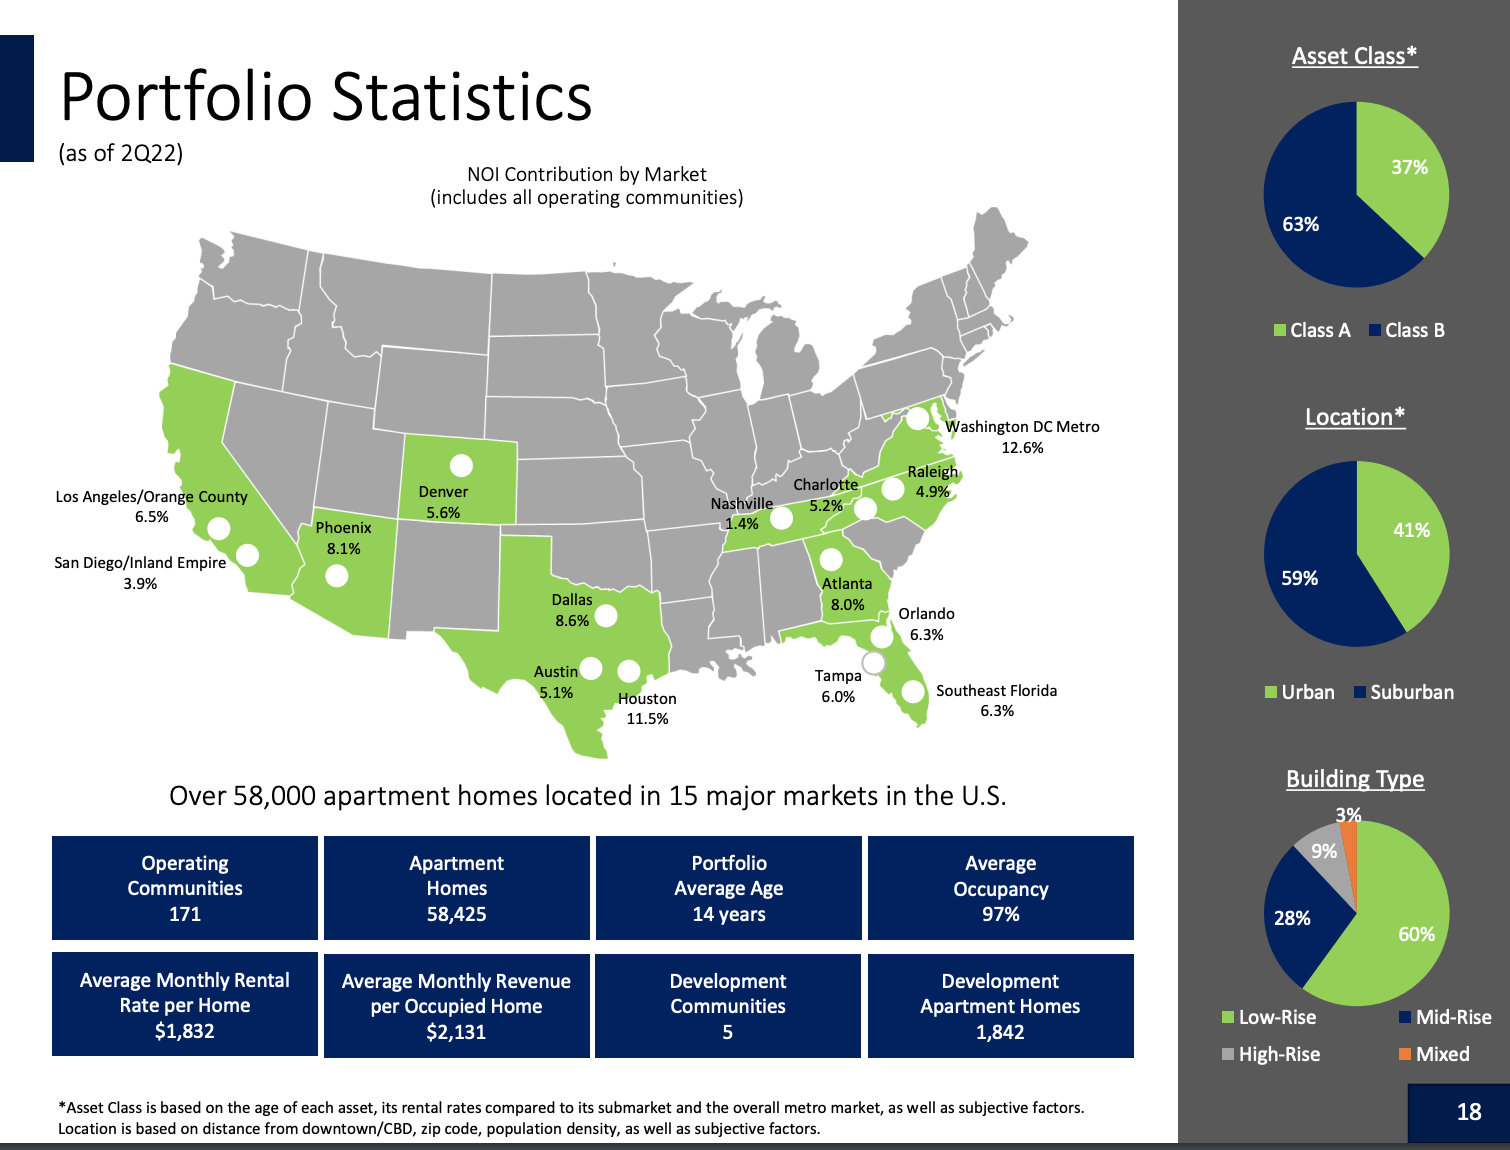
As shown above, save for 10% of NOI coming from Southern California, Camden operates exclusively in the sunbelt. Below is a snapshot of population #s over the past 50 years in a selection of Sunbelt cities. The numbers are simply staggering:
|
Metro Area |
1970 |
1980 |
1990 |
2000 |
2010 |
2020 |
|
Atlanta |
1,182,000 |
1,625,000 |
2,184,000 |
3,522,000 |
4,544,000 |
5,689,000 |
|
Austin |
267,000 |
383,000 |
569,000 |
911,000 |
1,377,000 |
1,985,000 |
|
Charlotte |
281,000 |
353,000 |
461,000 |
768,000 |
1,265,000 |
1,971,000 |
|
Dallas/ Ft Worth |
2,025,000 |
2,468,000 |
3,219,000 |
4,168,000 |
5,149,000 |
6,201,000 |
|
Houston |
1,693,000 |
2,424,000 |
2,922,000 |
3,847,000 |
4,976,000 |
6,245,000 |
|
Miami |
2,141,000 |
3,122,000 |
3,969,000 |
4,933,000 |
5,518,000 |
6,079,000 |
|
Orlando |
310,000 |
583,000 |
893,000 |
1,165,000 |
1,521,000 |
1,923,000 |
|
Phoenix |
874,000 |
1,422,000 |
2,025,000 |
2,923,000 |
3,649,000 |
4,436,000 |
|
Raleigh |
153,000 |
209,000 |
310,000 |
548,000 |
896,000 |
1,386,000 |
|
Wash DC |
2,488,000 |
2,777,000 |
3,376,000 |
3,949,000 |
4,604,000 |
5,264,000 |
Source: Macrotrends
While there will be fits and starts in the short-term, the long-term trend of population migration from colder, high tax states to business friendly, warm states is undeniable. Camden has been and will continue to be a long-term beneficiary of these trends which can be seen in its historical track record below.
A decade of per share FFO and dividend growth (Camden Investor Presentation)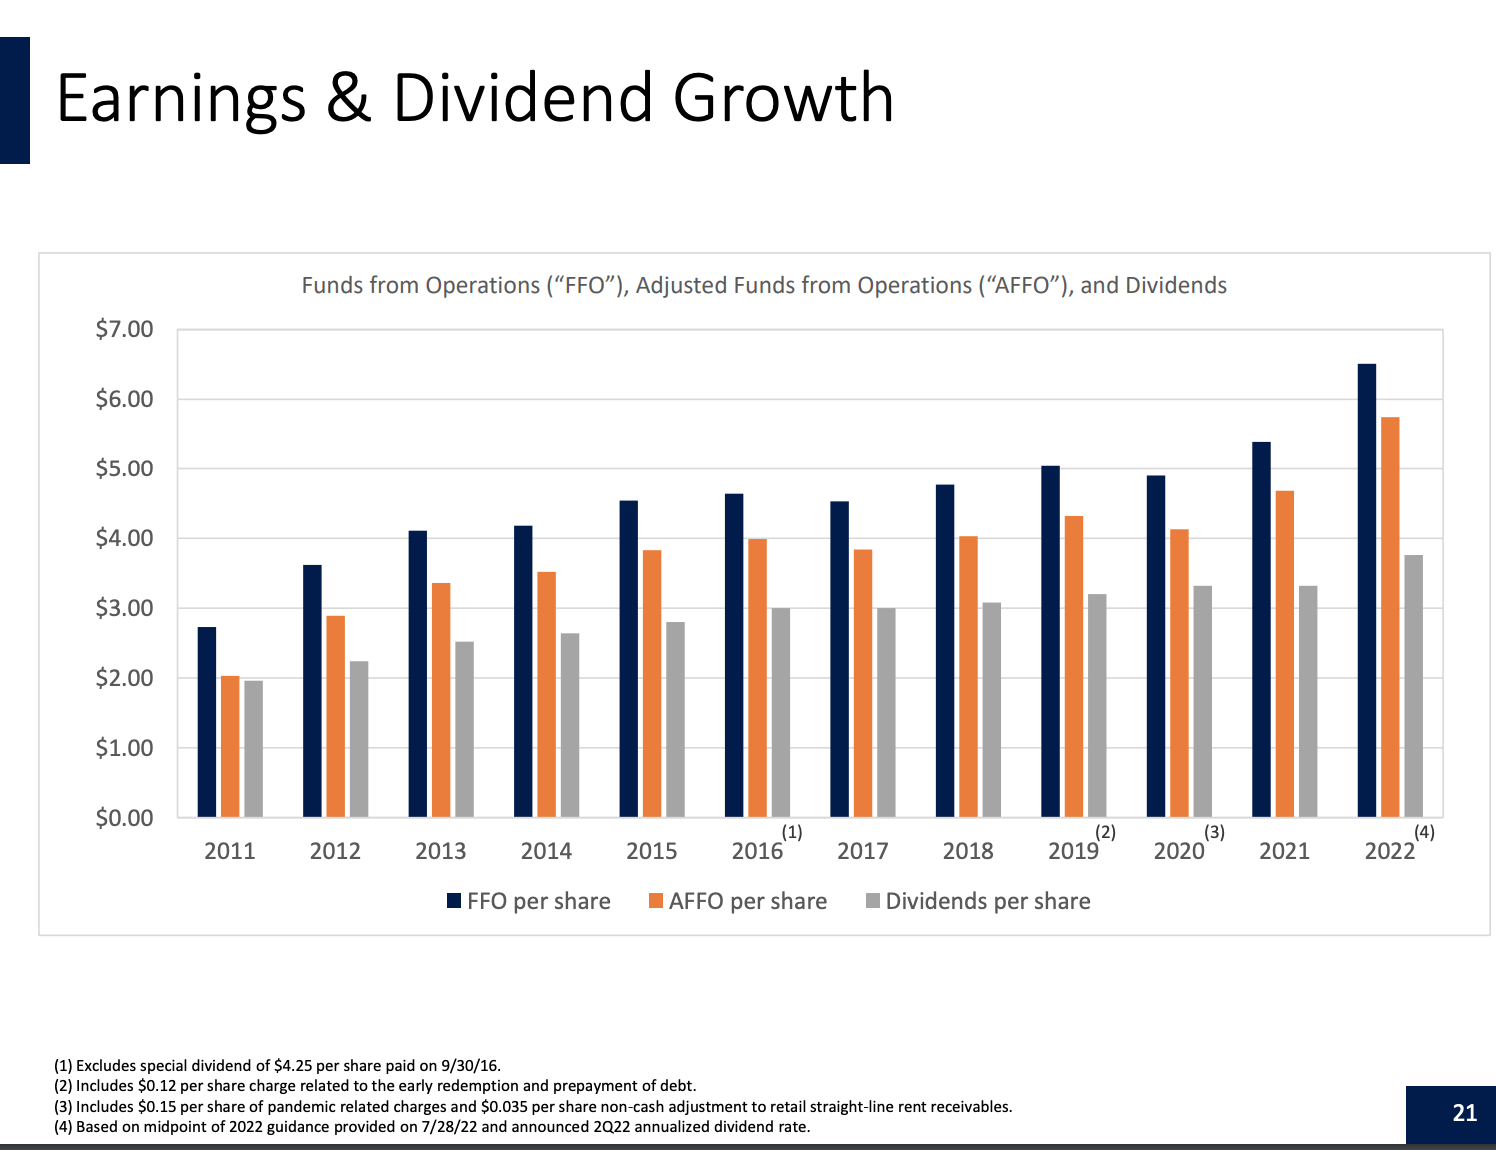
Supply is coming but there are Offsets
As shown below, 2H23 and 2024 will see an increase in newly constructed apartments becoming available in Camden’s markets:
Supply Outlook (Camden Investor Presentation)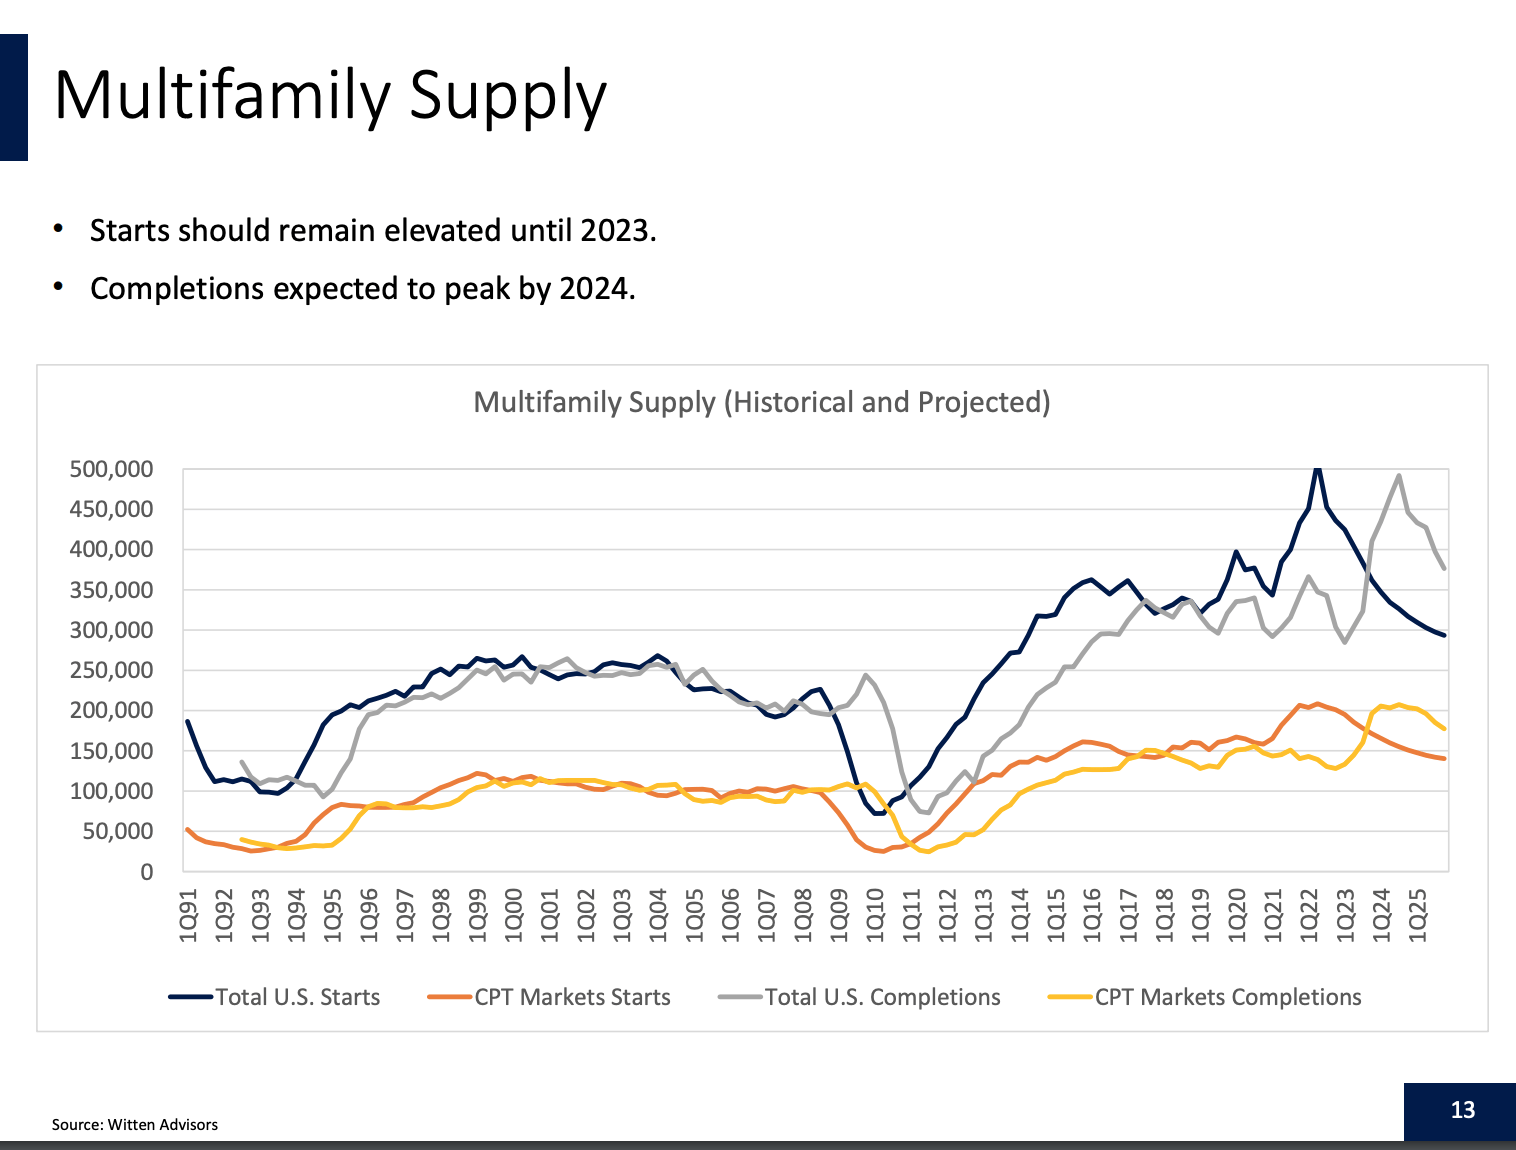
While new supply will impact the market, there are important offsetting factors to consider:
1. As shown below the near-term outlook for population growth in Camden’s markets remains strong. While supply may create a temporary imbalance in a few markets and exert some pressure on rents and occupancy in 2H23 & 2024, in the long-term, this will be offset by demand.
Demand Outlook (Camden Investor Presentation)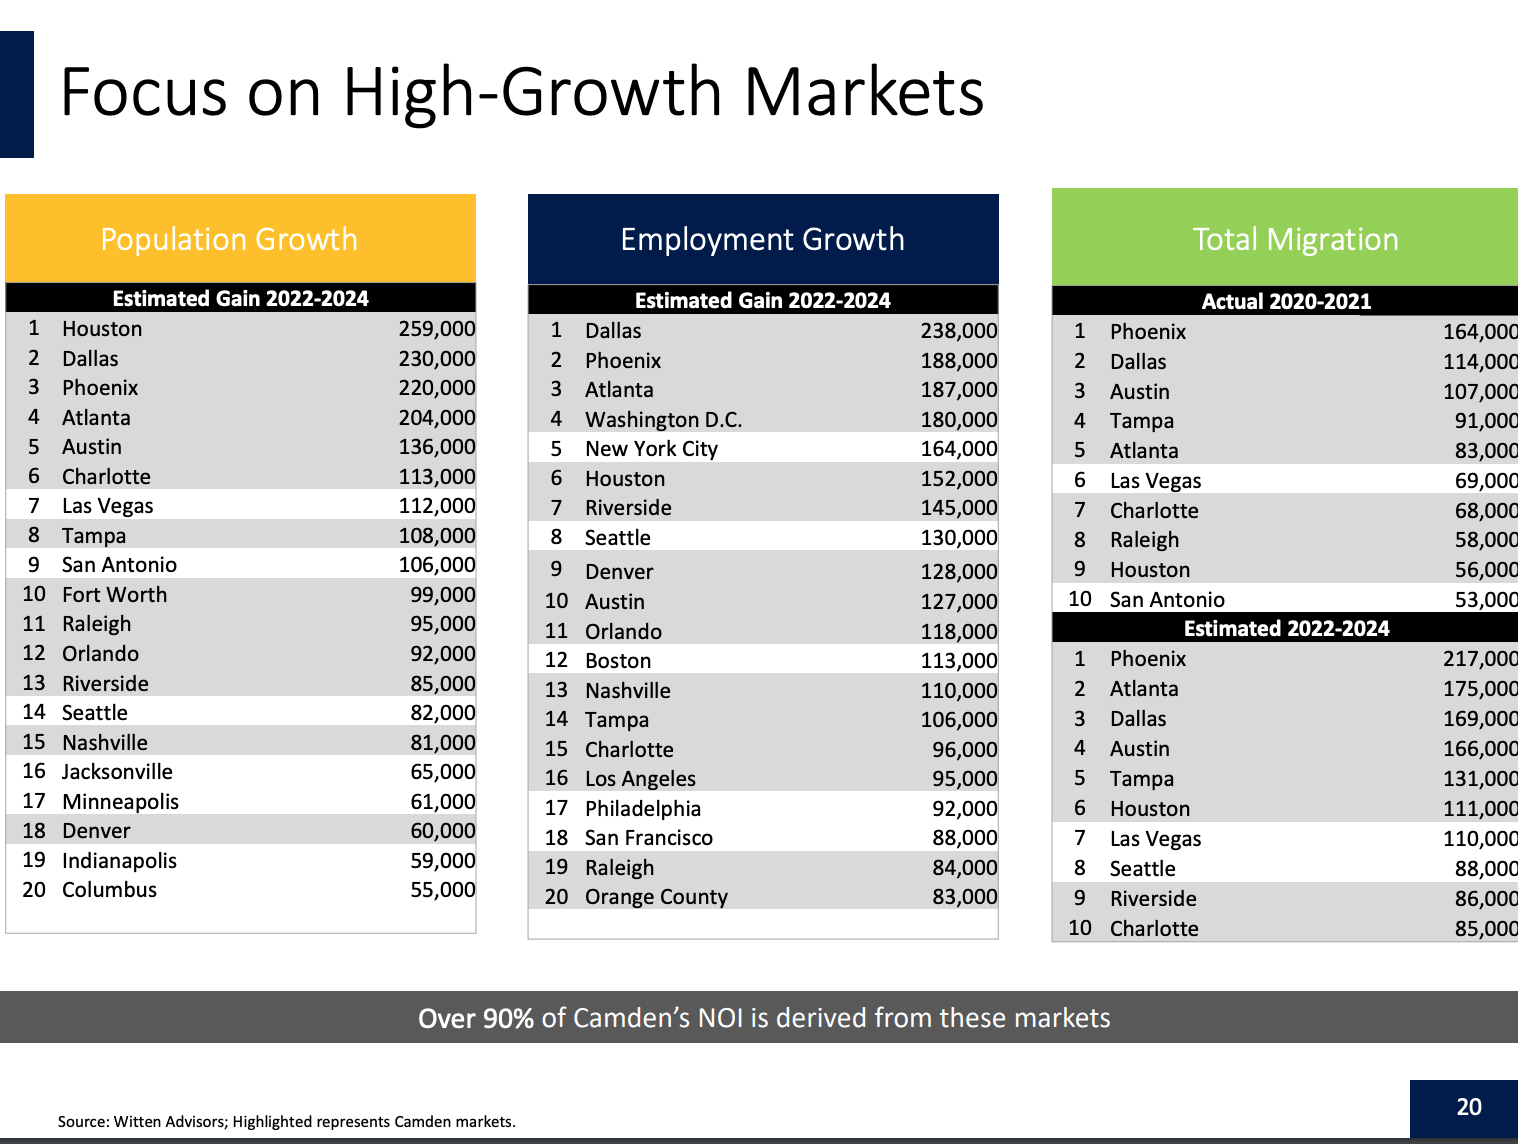
2. Move-outs to buy homes have meaningfully declined as mortgage rates have increased to nearly 7%. Rental affordability is near all-time highs relative to home ownership.
Commentary regarding move-outs to buy (3Q22 SA Transcript )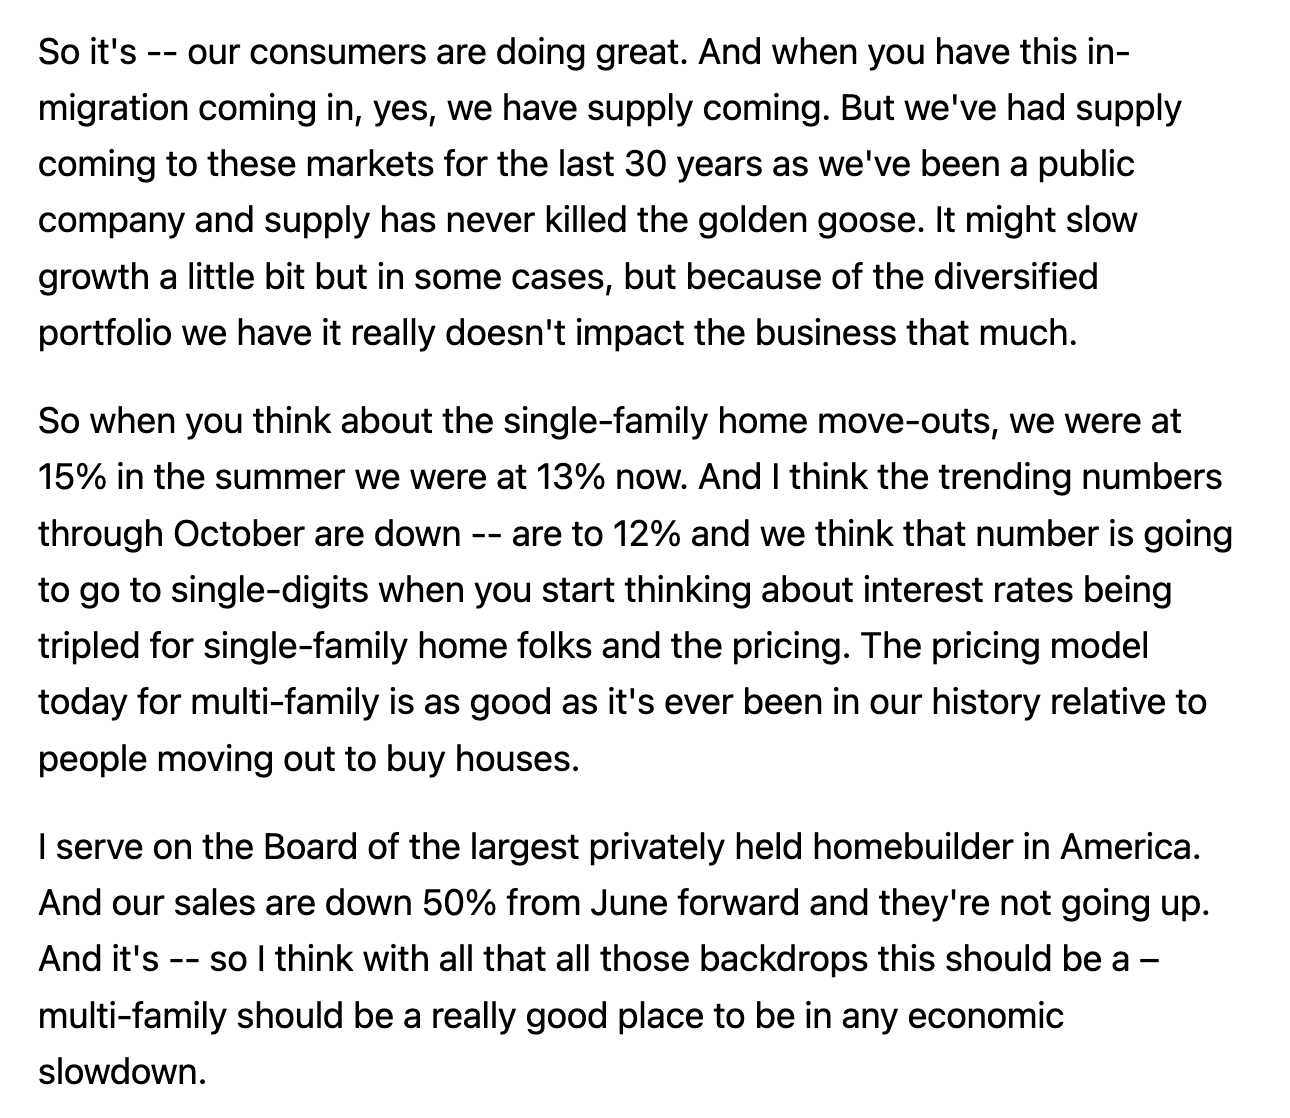
3. 63% of Camden’s properties are Class B. Class B properties tend to be more economically resilient than Class A. Class B properties, which are 15-30 years old and priced at a 15-25% discount to A units (and 30+% to brand new units) of comparable size. Class B &C is not subject to competition from new construction as development is ALWAYS focused on Luxury/Class A (Class B would never pencil out and new Class B is NEVER BUILT).
Valuation & Conclusion
At a recent price of $111/share, Camden trades just 16x 2023e FFO which is at the low-end of its historical range of 14-27x over the past decade. Similarly, Camden trades at an implied cap rate of 6.1% which is at the high end of not only its long-term range (3.7-6.2% over the past decade) but a discount to recent private market values in its key markets which estimated to be at in the mid 4s-low5s range.
It is important to understand that the private market represents 95% of the overall market for apartment assets in the US. The rise in interest rates has led to a pause in private market purchases of apartment assets. While we are unlikely to see apartment assets transact at ultra-low sub 4 cap rates, we saw in 2H21-1Q22, the structural increase in private equity capital being allocated to real estate is shown below:
Private Equity Dry Powder (CBRE)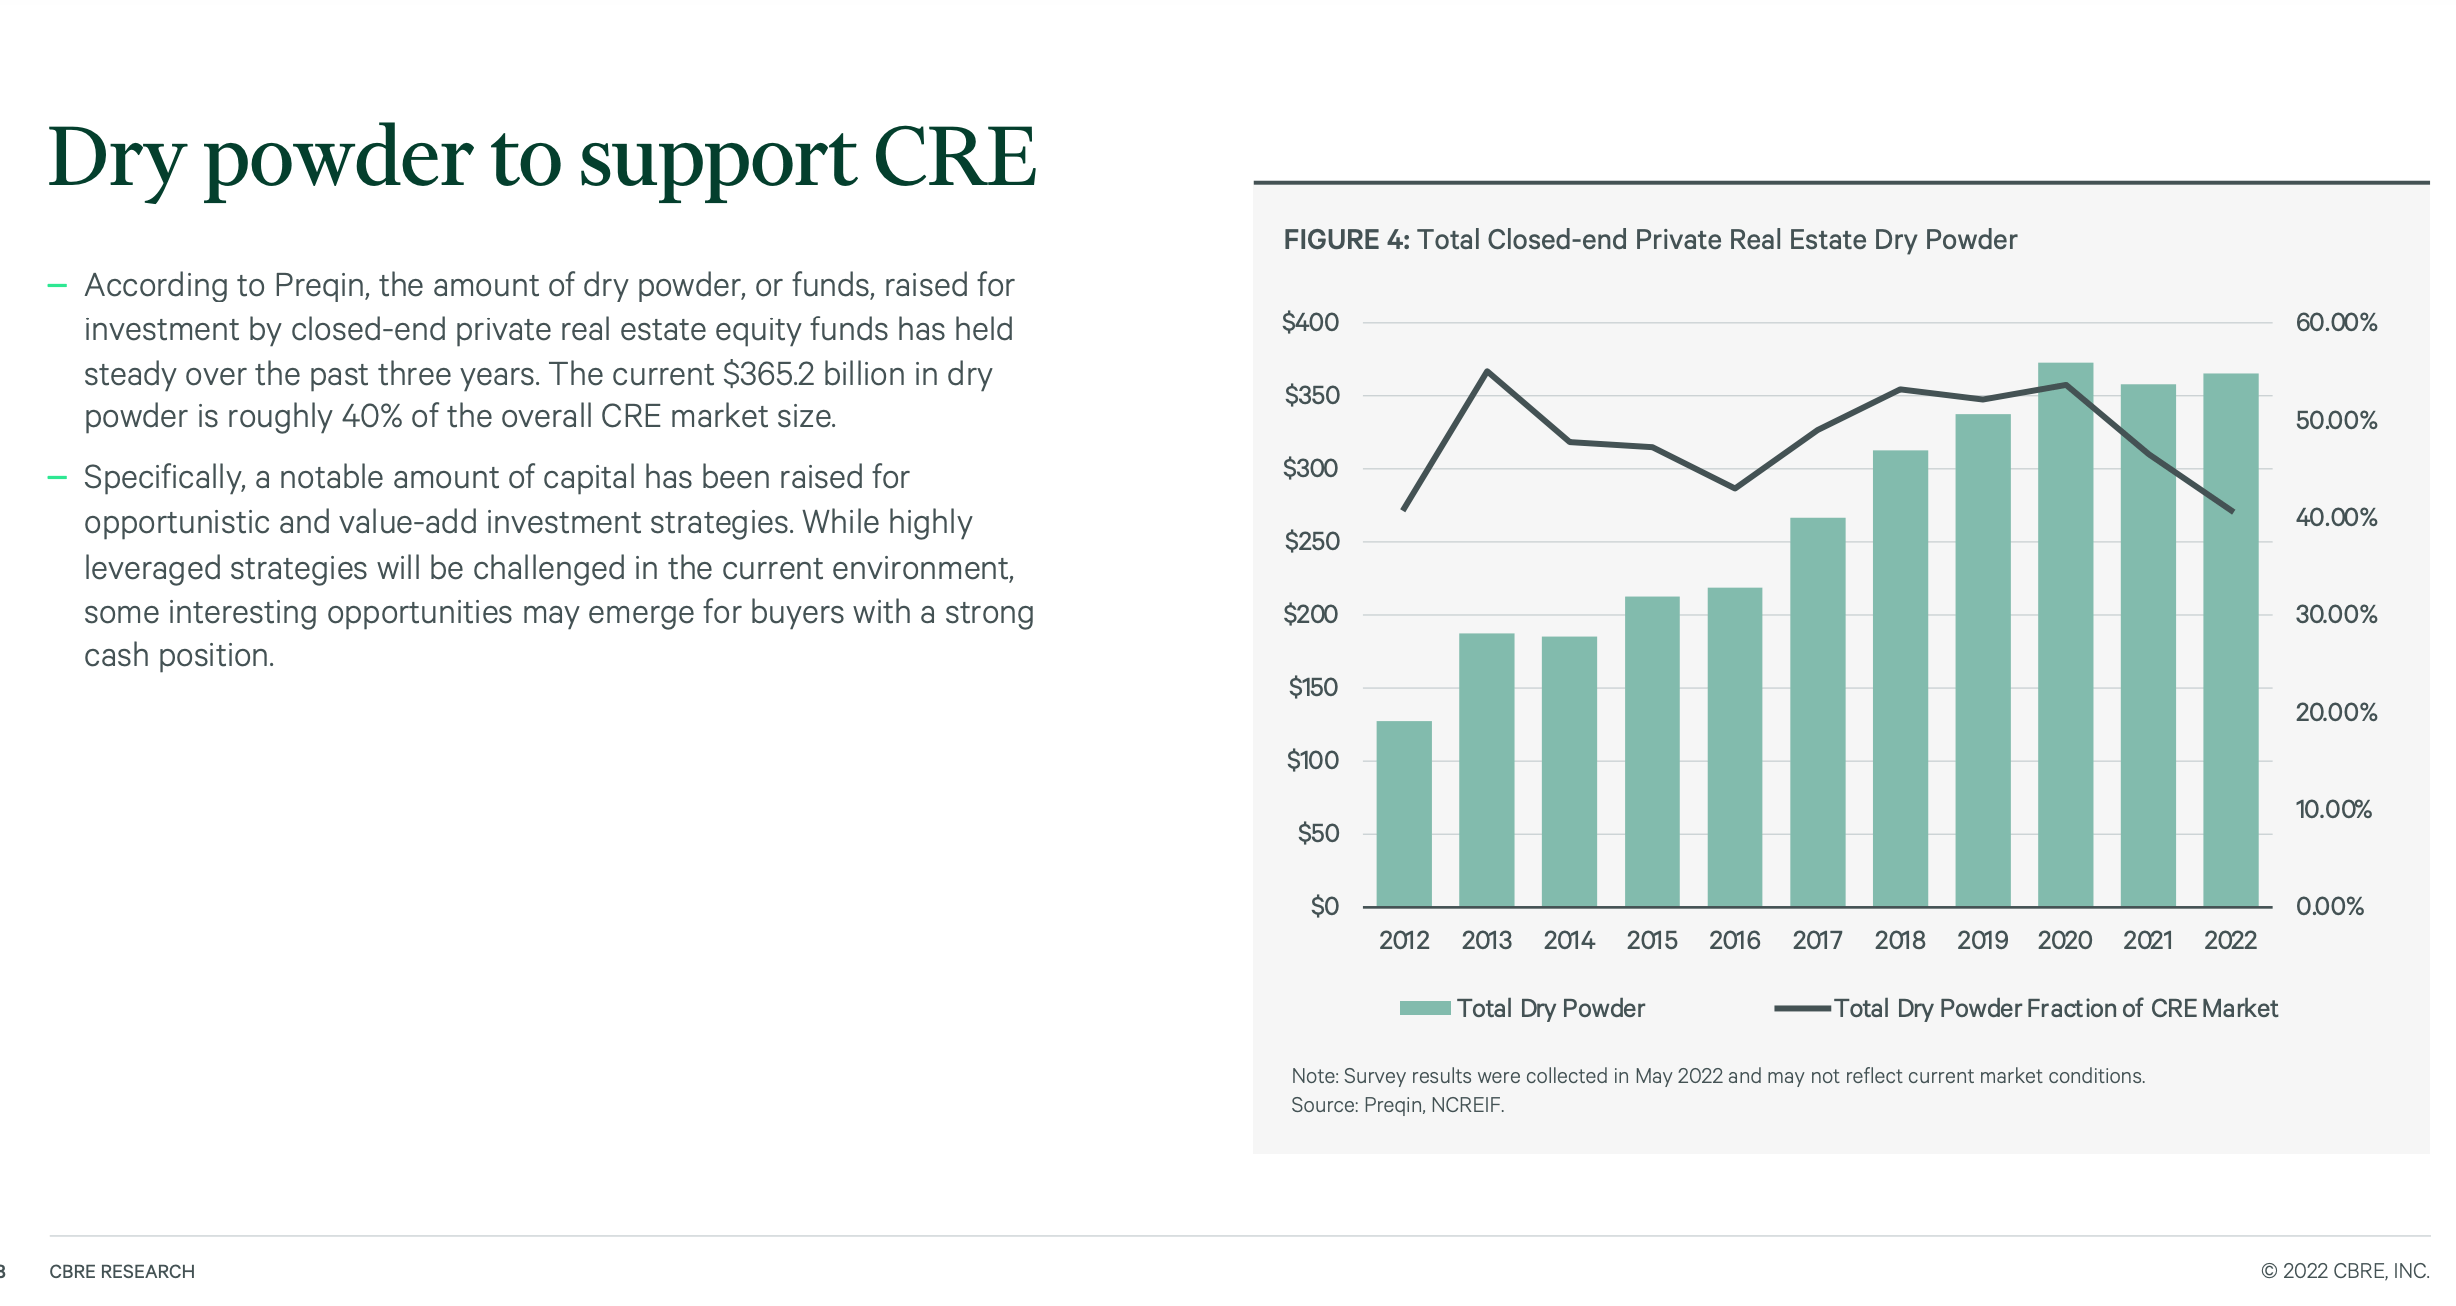
Note the significant increase in private capital allocated for real estate investment over the past 10 years. Eventually, this capital will have to be invested to allow the private equity sponsors to earn fees. Given the turmoil in office and retail, many private equity firms are increasingly focused on apartment assets.
Ultimately, I assume that valuations will revert back toward the higher end of their historical range. The logic underpinning this assumption is the significant amount of private capital chasing apartment assets. Further, inflation has driven up the replacement cost of apartment assets making the REITs increasingly attractive on a per-door basis (which represents an estimated 20-25% discount to replacement cost). Assuming a 4.5% cap rate for Camden gets me to an NAV of $160 per share, which suggests 45% upside. With a nearly 4% dividend yield investors get paid to wait.
Camden owns a collection of high quality, conservatively financed apartment (Net Debt/EBITDA is just 4.3x; LTV is below 25%) assets in attractive markets throughout the US. I believe the broad sell-off in REITs has created an attractive entry point for conservative long-term investors.
Risks
The main risk I see is that continued interest rate increases lead to further near-term declines in REIT prices.
Be the first to comment