

Lemon_tm/iStock via Getty Images
The Invesco S&P SmallCap High Dividend Low Volatility ETF (BATS:XSHD) leverages an equity strategy based on three factors, including small size, high dividend (one of the simpler variations of the value factor as I would call it), and low volatility.
As of the fund’s website, the S&P SmallCap 600 Low Volatility High Dividend Index is the foundation of its strategy. As described by S&P Dow Jones Indices in the factsheet, this biannually-rebalanced yield-weighted index includes 60 small-size U.S. stocks with the lowest realized volatility selected from a group of 90 high-yielders which are in turn picked from the S&P 600; an important remark is that a constituent cannot account for more than a 3% of the index, while the upper limit for a sector’s weight is 25%.
Upon cursory inspection, this might look like a promising strategy providing an equity safe-haven as it shuns names with intolerably high growth premia (they are potentially filtered out using a high-yield screen), as well as those with frenetic price swings. Hence, in theory, the fund might be used as a vehicle to navigate the uncertain capital shortage era with inflation risk still remaining a concern. Nevertheless, the very first impression could be misleading in many cases, with XSHD proving that.
I believe the ETF is a suboptimal choice for U.S. small-cap value exposure, with the primary reason being its sluggish past performance; there are other vulnerabilities worth discussing as well. Let me provide more context on that below in the article.
Reasons for skepticism
First and foremost, for a fund amalgamating the value and low volatility principles, the two factors that tend to perform well amid bear parties on the Street, especially those connected to the growth premia issue, I expected to see a loss not as deep as the iShares Core S&P 500 ETF (IVV) and its small-size-focused counterpart iShares Core S&P Small-Cap ETF (IJR) delivered last year. However, there is a disappointing surprise as XSHD underperformed both, by 1.3% and 3.3%, respectively, with a negative total return of about 19.5%.
Looking at longer periods, for instance, since its inception (limited a bit, with a few weeks in December 2016 and February 2023 excluded), XSHD’s performance was again lackluster as it trailed IJR and IVV every year except for 2023; in 2018, it finished slightly ahead of IJR.
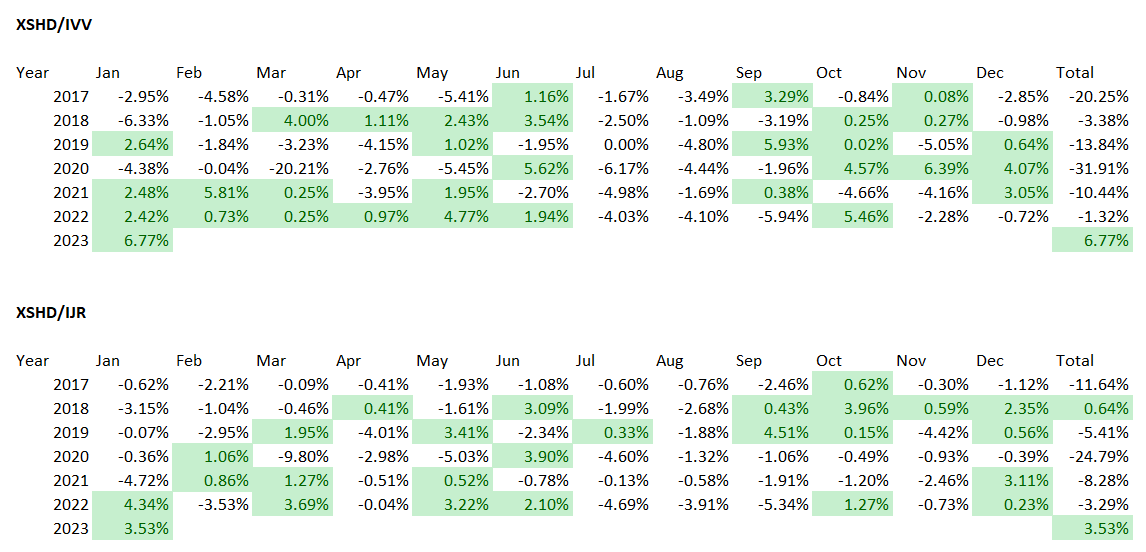
Created by the author using data from Portfolio Visualizer
Next, in the past, I covered a few funds with similar strategies revolving around dividends and low volatility or low volatility only, namely the following,
- Franklin U.S. Low Volatility High Dividend Index ETF (LVHD)
- iShares MSCI USA Min Vol Factor ETF (USMV)
- VictoryShares US Small Cap High Div Volatility Wtd ETF (CSB)
- TrueShares Low Volatility Equity Income ETF (DIVZ)
I suppose it would be pertinent to compare their results to XSHD, with a caveat that I decided to exclude DIVZ as its history is too short (incepted in January 2021). Below, the period in focus is again January 2017 – January 2023.
| Portfolio | XSHD | LVHD | CSB | USMV | IJR | IVV |
| Initial Balance | $10,000 | $10,000 | $10,000 | $10,000 | $10,000 | $10,000 |
| Final Balance | $10,230 | $16,629 | $16,897 | $18,066 | $16,442 | $20,243 |
| CAGR | 0.37% | 8.72% | 9.01% | 10.21% | 8.52% | 12.29% |
| Stdev | 23.80% | 14.69% | 21.00% | 13.79% | 22.03% | 17.12% |
| Best Year | 18.32% | 26.89% | 27.03% | 27.69% | 26.60% | 31.25% |
| Worst Year | -19.48% | -5.62% | -13.10% | -9.42% | -16.19% | -18.16% |
| Max. Drawdown | -41.76% | -24.32% | -33.03% | -19.06% | -36.12% | -23.93% |
| Sharpe Ratio | 0.09 | 0.56 | 0.46 | 0.69 | 0.43 | 0.69 |
| Sortino Ratio | 0.12 | 0.81 | 0.68 | 1.02 | 0.61 | 1.04 |
| Market Correlation | 0.82 | 0.87 | 0.87 | 0.92 | 0.91 | 1 |
Created by the author using data from Portfolio Visualizer
As the table above illustrated, XSHD delivered the weakest total return, the highest standard deviation, and the deepest maximum drawdown.
Besides, my dear long-term readers are more likely to remember my fondness for the quality factor, which I consider the cornerstone of solid long-term equity strategies, especially those built to safely navigate the ups and downs of the economic cycle. And even though bulls are attempting a rematch this year, playing with the inflation-is-no-longer-a-concern narrative, I see little reason to rotate out of highly profitable stocks, as in case hopes for easier credit conditions do not materialize, names with fickle margins and lackluster returns on capital would likely suffer, and badly.
So the issue here is that XSHD’s is almost quality-agnostic. Of course, the S&P 600 index incorporates the “financial viability” rule, expecting candidates to turn even a measly net profit to quality for inclusion. However, as I have already illustrated in the note on the Invesco S&P SmallCap 600 Pure Value ETF (RZV) published recently, between reconstitutions, the index-tracking portfolios might have exposure to loss-making companies, and at times a meaningful one. To quality investors chagrin, XSHD is no exception.
More specifically, as of February 15, more than a quarter of the fund’s holdings had quality issues manifested in a D+ Quant Profitability grade and worse, while less than 21% had a B- grade and higher. This is a gigantic red flag. An important remark is that almost 30% do not have a Quant rating. However, in this group, 16.5% (financial stocks only) are unprofitable.
The silver lining
With the weighted-average market capitalization of only $1.37 billion, as per my calculations, and a high-yield screen, XSHD should theoretically have appealing valuation as smaller names with unideal quality (as seen above) tend to trade at a discount to the sector medians.
And here, there is something to like about this vehicle. For example, almost 53% of the holdings have a B- Quant Valuation grade or better, a strong result. For better context, the table provides a comparison of the median EV/EBITDA ratios for XSHD’s holdings for each sector except for financials; for energy, the ratio is for one stock only, Archrock (AROC), a natural gas compression equipment company.
| Sector | Weight in XSHD | EV/EBITDA (median for XSHD holdings) | Sector Median |
| Communication Services | 5.3% | 9.16x | 10.57x |
| Consumer Discretionary | 7.6% | 4.80x | 10.48x |
| Consumer Staples | 11.4% | 9.43x | 13.58x |
| Energy | 2.2% | 9.79x | 6.73x |
| Health Care | 2% | 15.24x | 15.69x |
| Industrials | 10.4% | 12.70x | 12.58x |
| Information Technology | 3.7% | 8.43x | 14.38x |
| Materials | 7% | 6.77x | 7.47x |
| Real Estate | 19.8% | 14x | 23.74x |
| Utilities | 6.2% | 15.58x | 12.99x |
Created by the author using data from Seeking Alpha and the fund
For financials (24.6%, the top sector), the median Price/Book is 0.8x, about 32% below the sector median.
However, it is worth noting that the fund’s weighted-average earnings yield is strangely compressed, at ~3%. One of the reasons is the large presence of loss-making companies as noted above, with Adeia (ADEA) even having an almost 34% negative EY.
Anyway, the weighted-average dividend yield of 7.9% again points to attractive valuation; the fund itself yields 6.3%.
Final thoughts
In conclusion, a low-volatility high-yield small-cap basket is an excellent concept. А WA DY of 7.9% and WA 24-month beta of 0.87 (based on my calculations) are telling. Unfortunately, returns are far from brilliant.
Despite the alluring mix of factors, XSHD’s performance since inception in 2016 has been utterly harrowing, with 2022 being its worst year, which is nothing short of surprising for a fund leveraging a value & low volatility strategy in a high-inflation, higher-interest rates environment. Another strong negative is its small AUM of just $25 million, with an uncoincidental F Liquidity grade.
Overall, summarizing the positives and negatives discussed above, I would say that investors should act with caution when considering a vehicle like XSHD. In my view, despite a strong value tilt, it does not deserve a Buy rating.
Be the first to comment