

Getty Images/Getty Images News
Price Action Thesis
We present our detailed price action analysis of XPeng Inc. (NYSE:XPEV) stock. Given the massive surge from its March bottom, we believe it’s apt to help readers understand our updated perspective on XPEV stock.
We have also revised our price action framework and valuation analysis on XPEV. Notably, we have moved from a DCF approach to a reverse cash flow model better integrated with our price action analysis. We think that provides better clarity on how to value XPEV in line with what we observed in its price structures.
Our analysis indicates that XPEV is at a near-term resistance and could potentially form a bull trap (significant rejection of buying momentum). Therefore, we believe caution is appropriate at the current levels.
Our reverse cash flow model also indicates that XPeng is unlikely to meet our implied revenue target, as its free cash flow (FCF) profitability remains unproven. Therefore, investors should be prepared for a highly volatile ride on XPEV, demonstrated in its price structures (no discernible trend). Consequently, we urge investors to consider XPEV as a highly speculative stock if they decide to add exposure.
As a result of its potential bull trap action and valuation, we revise our rating on XPEV from Buy to Hold.
XPEV – Dominated By A Series Of Traps
XPEV price chart (TradingView)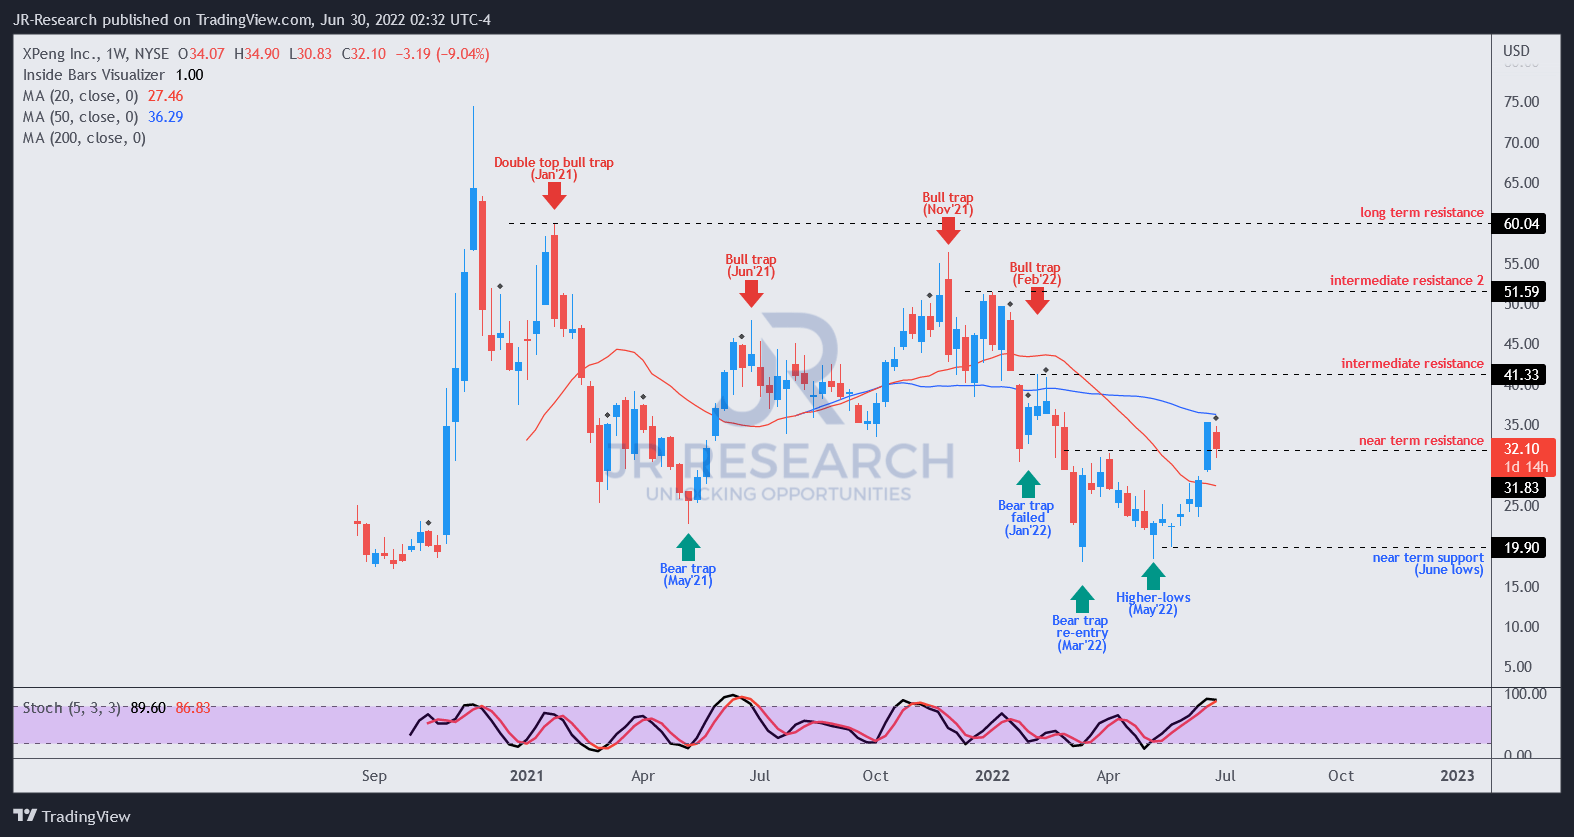
From XPEV’s weekly chart, investors can glean that it has not exhibited a discernible trend since August 2020. Instead, it has been dominated by a series of bull and bear traps (significant rejection of selling momentum).
Therefore, we don’t espouse holding the stock long-term (due to its weak fundamentals) and urge investors to consider it a speculative opportunity based on its price action.
It means investors should consider cutting exposure/layering out at validated bull traps. More aggressive and experienced investors can also consider directionally bearish set-ups on such bull traps, benefiting from potential price declines.
Also, we urge investors to consider adding exposure only when its price structures demonstrate validated bear traps but are protected by robust risk management strategies if the set-ups are invalidated.
For instance, XPEV had a bear trap in January 2022 that was taken out by February’s capitulation move before validating a bear trap re-entry signal. A re-entry signal validating the preceding price structure is a potent set-up, lending credence to its March capitulation signal. It explains why we have written a series of articles on Chinese stocks that highlighted their capitulation in March, despite the “tsunami” of pessimistic fervor that engulfed these stocks then.
Price action is always forward-looking. Therefore, investors can glean tremendous clarity in XPEV’s price structure and dominant trend (which is discernibly missing).
Currently, XPEV is testing its near-term resistance ($32). While it could surge to re-test its intermediate resistance ($41) before setting up another bull trap, we urge caution. The price action leading to its current levels indicates typical price structures preceding bull traps. Furthermore, it has already surged 75% from its May lows and looks well above its near-term support.
Notwithstanding, the higher-lows price action is constructive for a medium-term recovery. However, we urge investors to wait patiently for a deeper retracement, allowing the price action to potentially find a higher-low support before adding exposure.
XPeng’s Weak Fundamentals Complicate Its Valuation Analysis
XPeng revenue change % and adjusted EBIT margins % consensus estimates (S&P Cap IQ)
The consensus estimates indicate that XPeng is projected to grow its revenue rapidly through FY24, even though it’s expected to moderate markedly. In an early February article, we also highlighted that the company expects to raise its capacity to 500K (annualized) by the end of 2023.
XPeng also recently surpassed its 200K delivery milestone as it continues to ramp rapidly. However, the Street’s modeling suggests that XPeng’s adjusted EBIT profitability is still expected to be negative through FY24. As such, we believe the market remains tentative on how to value XPEV accordingly, given its weak fundamentals.
XPeng adjusted EPS YoY change % and FCF margins % consensus estimates (S&P Cap IQ)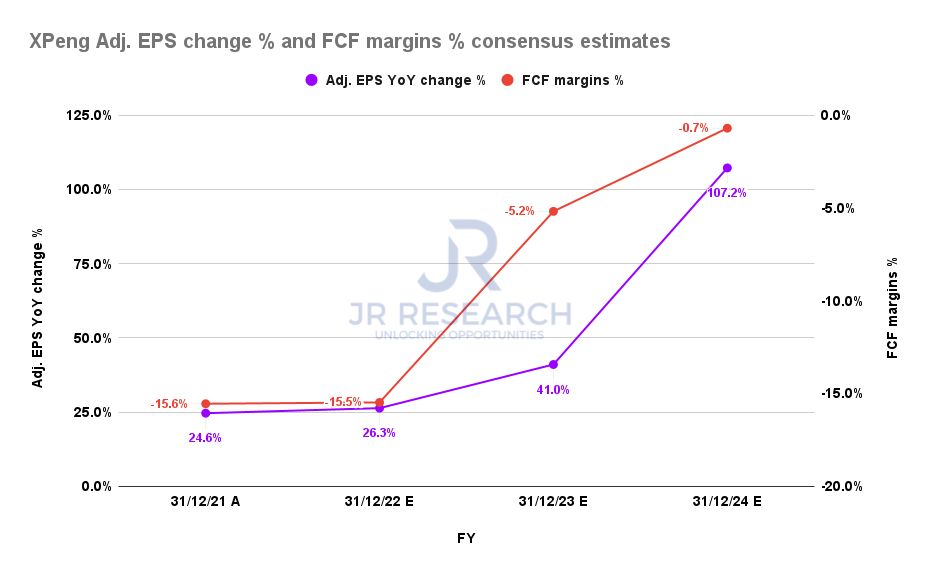
XPeng’s adjusted EPS is expected to grow less rapidly than its revenue growth in FY22. However, XPeng’s operating leverage is likely to accelerate as it scales up rapidly through FY24, helping the company to register a free cash flow (FCF) margin of -0.7% in FY24.
Notably, Tesla (TSLA) reached an FCF margin of 4.4% in FY19 based on a production of 365K vehicles. It also posted an FCF margin of 8.8% in FY20 based on producing 510K vehicles. Therefore, it’s critical for XPeng to scale rapidly, to reach FCF profitability. However, Street’s modeling suggests that XPeng’s FCF margins are expected to be markedly lower than Tesla’s FCF profitability.
| Stock | XPEV |
| Current market cap | $27.51B |
| Hurdle rate (CAGR) | 30% |
| Projection through | CQ4’26 |
| Required FCF yield in CQ4’26 | 2% |
| Assumed TTM FCF margin in CQ4’26 | 4% |
| Implied TTM revenue by CQ4’26 | $44.79B |
XPEV reverse cash flow valuation model. Data source: S&P Cap IQ, author
Our reverse cash flow valuation model indicates that XPeng is unlikely to meet our TTM revenue target by CQ4’26 ($44.79B). Accordingly, we applied a hurdle rate of 30%, which we believe is appropriate for a highly speculative stock.
Notably, our assumed TTM FCF margin of 4% is also highly speculative. But, we factored in a discount to the Street’s consensus to moderate for significant uncertainty. As indicated, Tesla achieved an FCF margin of 4.4% based on a production run rate of 365K vehicles. Therefore, XPeng needs to prove that its higher-margin models can help deliver a faster ramp in its FCF profitability.
The revised consensus estimates indicate that XPeng could post revenue of $14.96B by FY24. Consequently, our model requires the company to deliver a 2Y revenue CAGR of 73% from FY24-26, which we think is improbable.
Is XPEV Stock A Buy, Sell, Or Hold?
We revise our rating on XPEV from Buy to Hold.
We urge some caution as XPEV could potentially form a bull trap (not validated) at its near-term resistance. Otherwise, it could induce another flush-up price action into its intermediate resistance before forming a potential bull trap. The preceding price structures leading to its current levels warrant caution.
Our valuation model indicates that XPeng is unlikely to meet our TTM revenue target by FY24 at the current levels. Therefore, we urge investors to wait for a deeper retracement to test a potentially higher-low support before adding exposure.
Be the first to comment