

In this article, we examine the significant weekly order flow and market structure developments driving XLF price action.
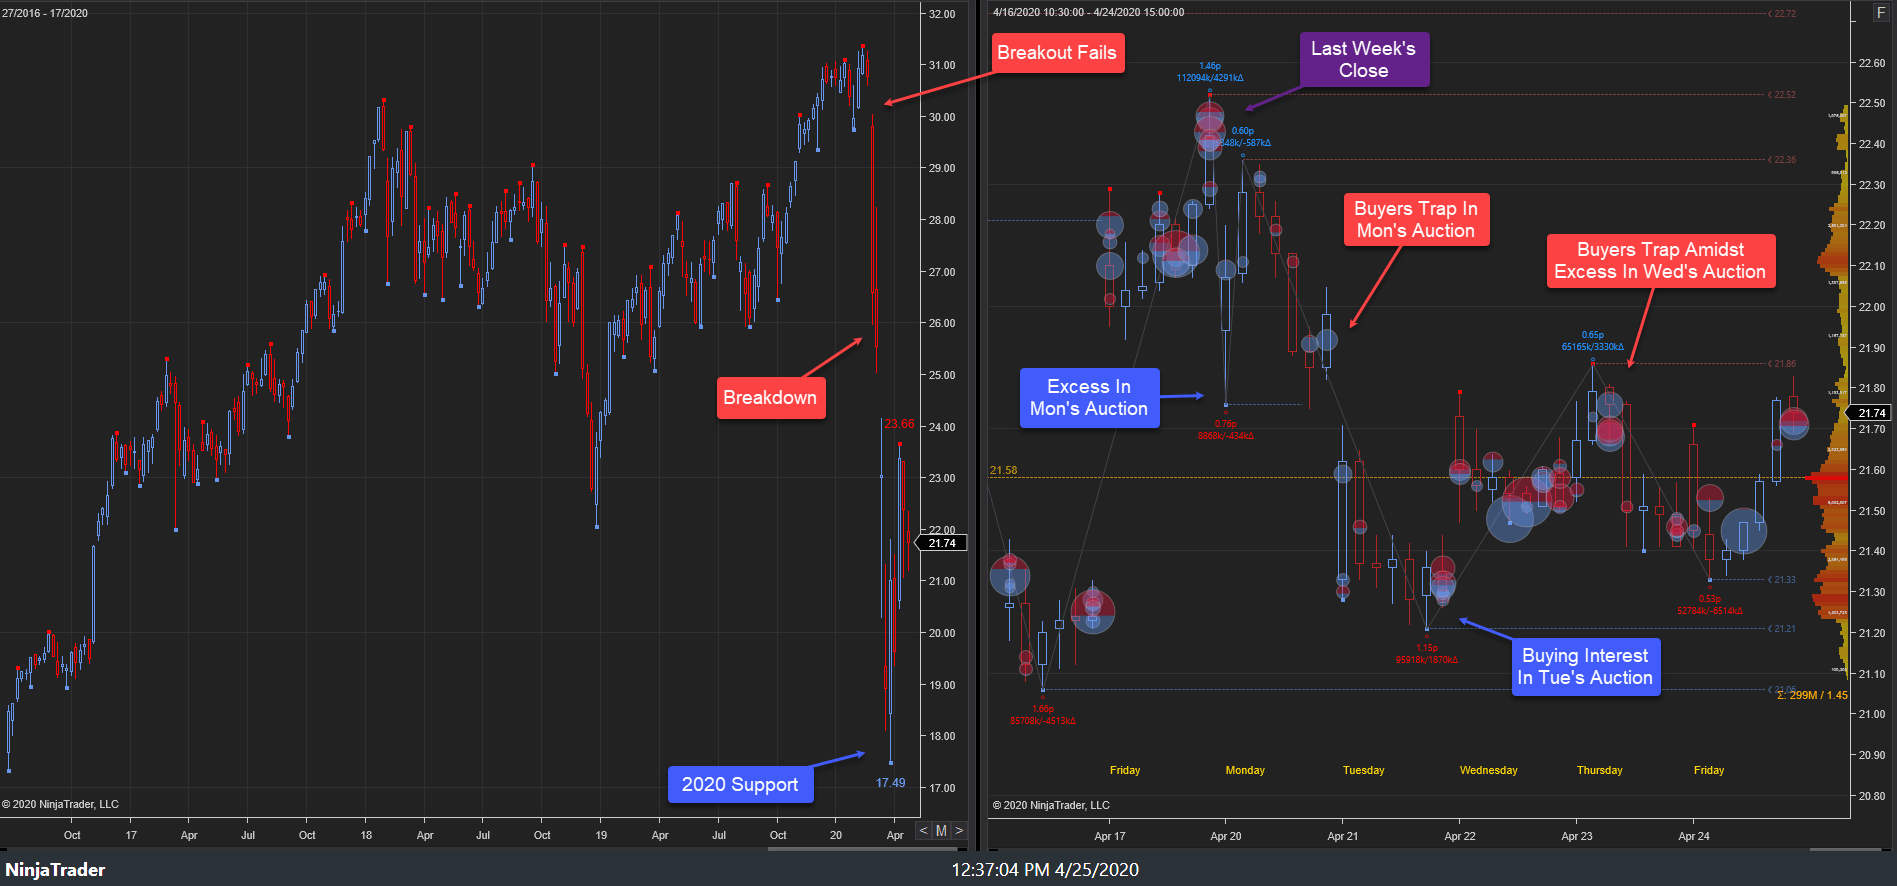
The highest probability path for this week was for price discovery lower, provided 24.17s held as resistance. This primary expectation did play out as last week’s late buyers held the auction as an aggressive rally ensued to 24.13s into Tuesday’s auction. Sell excess formed there, 24.13s-23.70s, near the March breakdown area before a pullback ensued to 21.91s ahead Friday’s close, settling at 22.06s.
27 April–01 May 2020:
This week’s auction saw a gap higher open in Monday’s trade as last week’s late buyers held the auction. Aggressive price discovery higher ensued, achieving a stopping point, 22.60s, where buying interest emerged into Monday’s close. Monday’s late buyers held the auction as a gap higher open formed in Tuesday’s trade as the rally continued, achieving a stopping point, 23.33s. Sell excess formed there before balance developed, 23.33s-22.67s. Buying interest emerged late in Tuesday’s trade as an aggressive buy-side breakout attempt developed, achieving the weekly stopping point high, 24.13s. Structural sell excess developed there, 24.13s-23.70s, into Tuesday’s close.
Narrow balance developed, 23.17s-23.66s, in Wednesday’s auction before buying interest emerged, 23.41s into Wednesday’s close. Wednesday’s late buyers failed to hold the auction as a pullback ensued in Thursday’s trade to 22.71s. Buying interest emerged, 22.71s/22.81s, into Thursday’s close. Thursday’s late buyers failed to hold the auction as a gap lower open formed in Friday’s trade before the pullback continued, achieving a stopping point, 21.91s, into Friday’s close, settling at 22.06s.
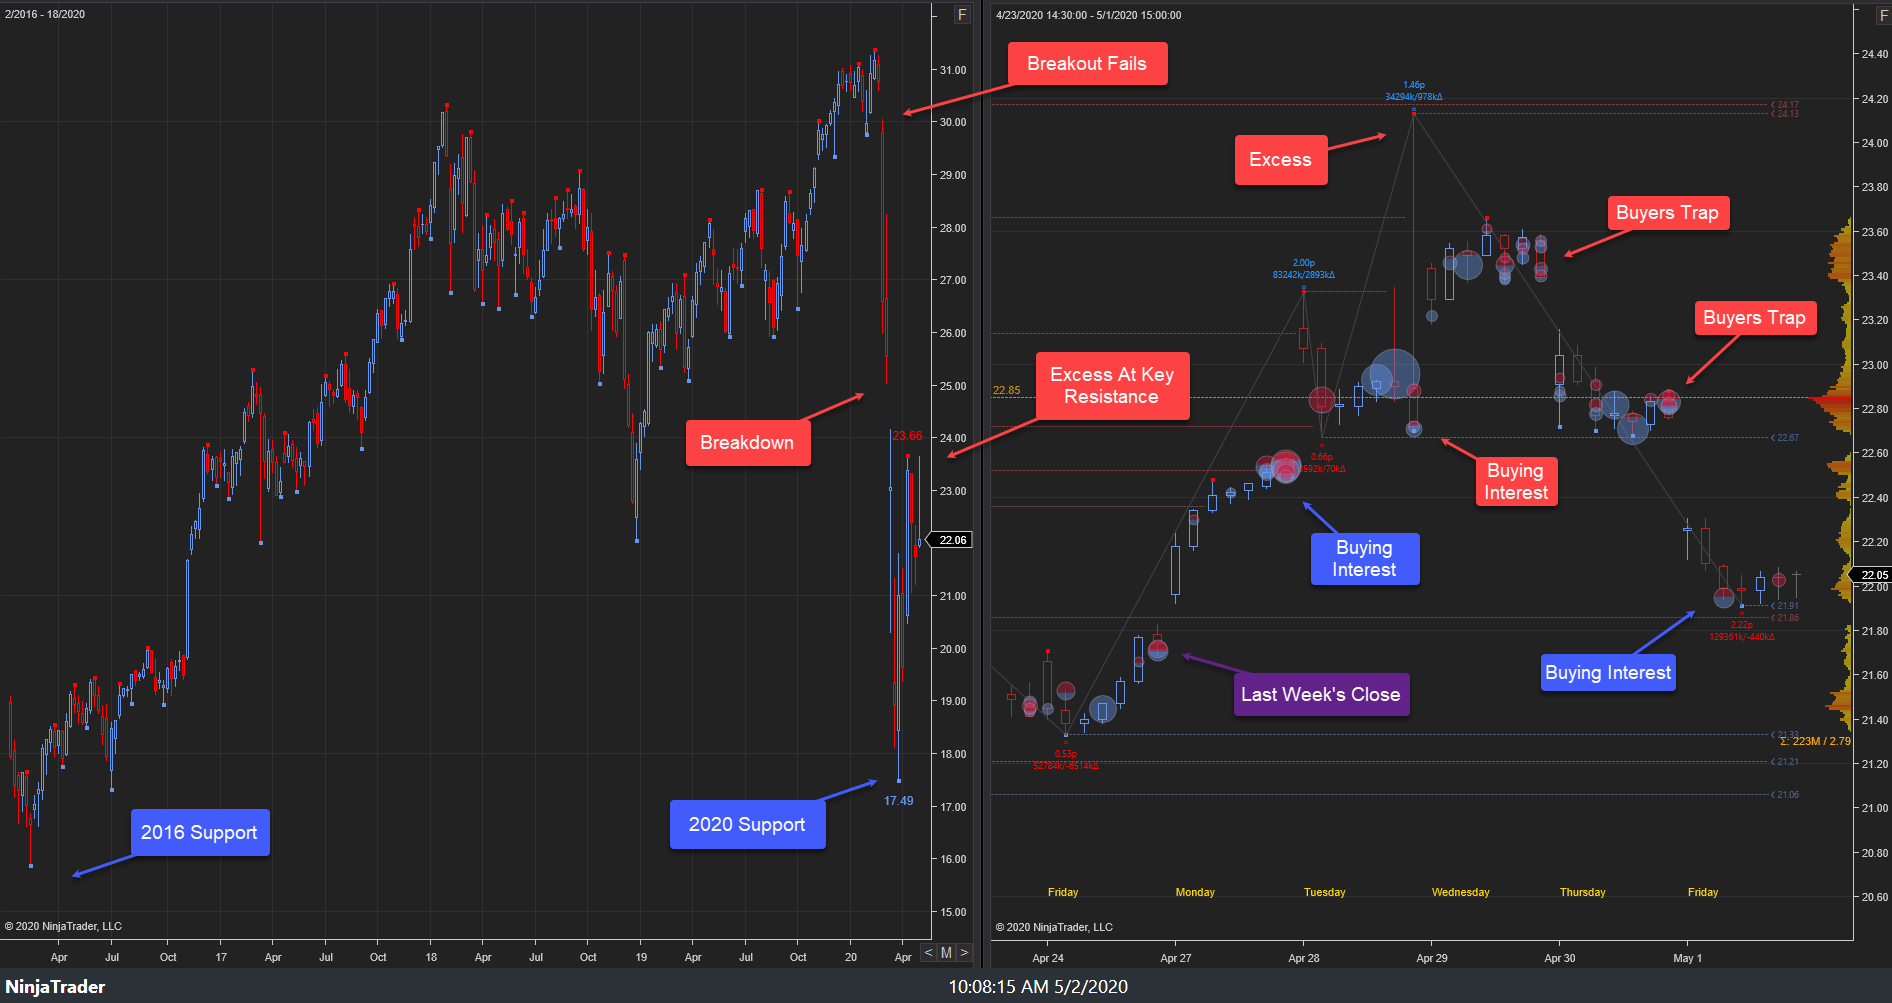
This week’s auction saw primary sell-side expectation fail to unfold as last week’s key support held. An aggressive rally ensued to 24.13s at/near the March breakdown zone of thin liquidity. A structural sell excess developed there, halting the rally before a pullback ensued. The failure at the March breakdown area implies the relief rally from 17.50s may have terminated within the context of an incomplete corrective phase.
Looking ahead, the focus into next week’s auction will center upon market response to key support, 21.90s-21.80s. Buy-side failure at this area will target the key demand clusters below, 21.30s-21.06s/20.14s-19.36s, respectively. Alternatively, sell-side failure at this area will target key supply above, 23.60s-24.13s/25.98s-28.25s, respectively. The highest probability path near-term based on market structure is for price discovery lower, barring failure of 23.60s as resistance. With the failure of 29.75s as support, the larger intermediate term bias (3-6 month) remains sell-side barring failure of 23.66s as resistance.
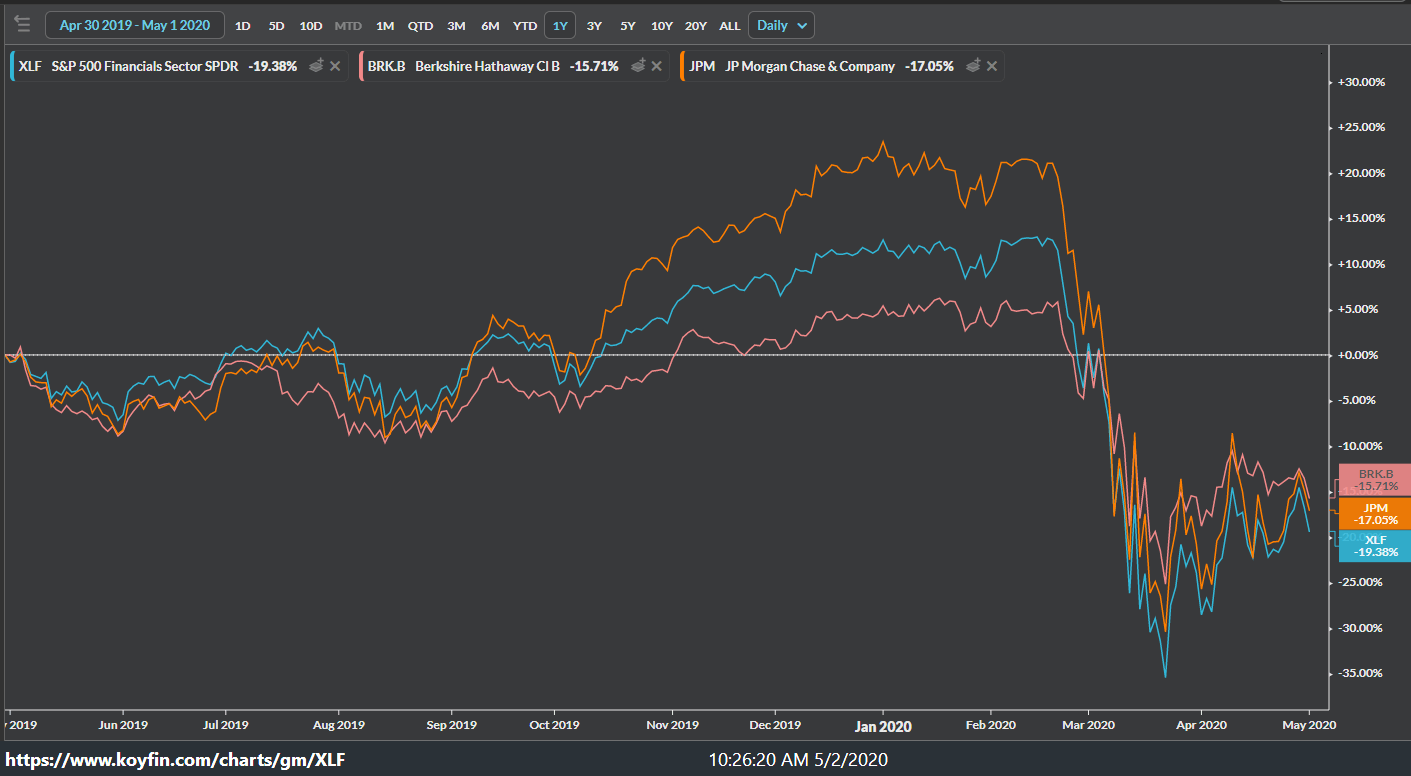
Looking under the hood of XLF, we see that Berkshire (NYSE:BRK.A) (NYSE:BRK.B) and JPMorgan (NYSE:JPM) represent approximately 27% of the XLF. They have contributed -209bps and -225bps of the last year’s activity, respectively.
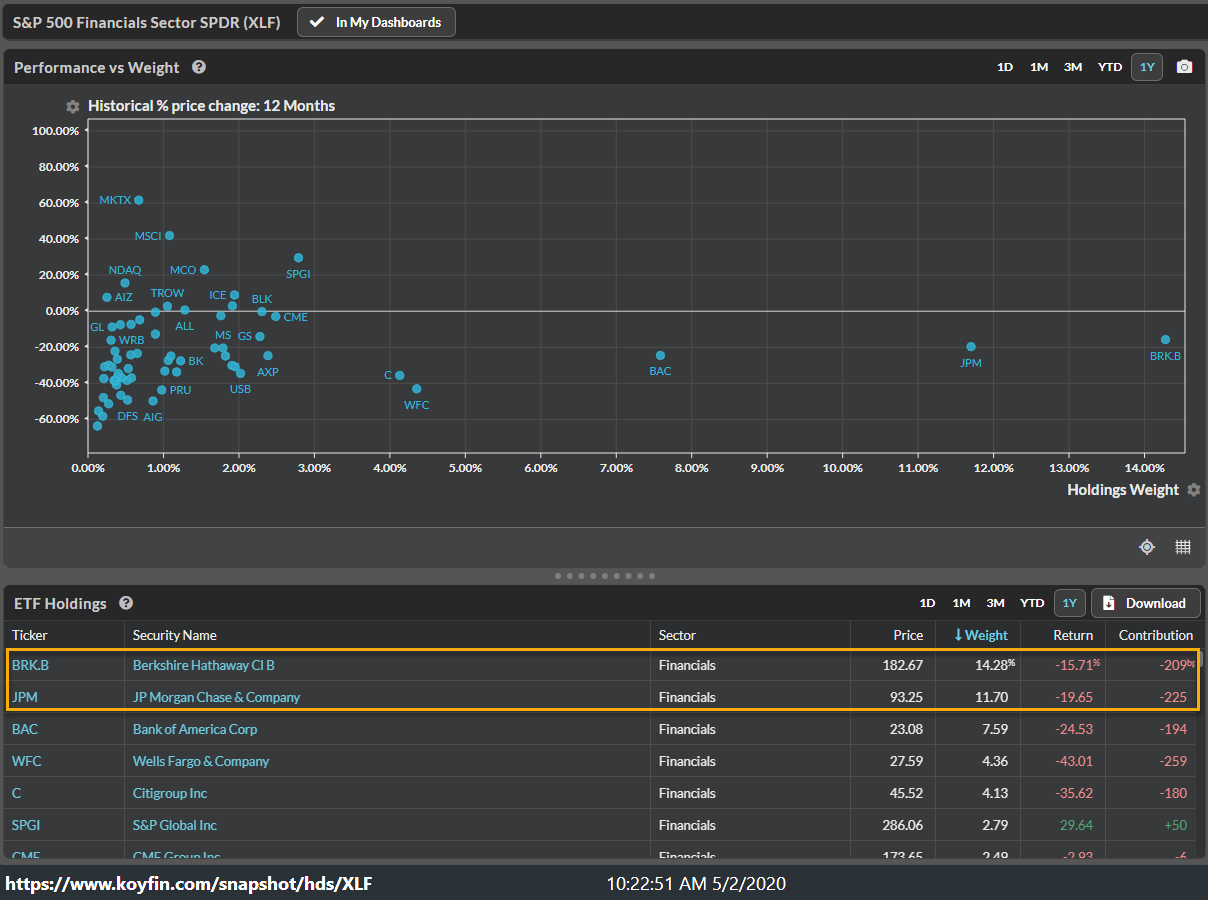
These companies are the largest weighted holdings in XLF, and their response will remain key.
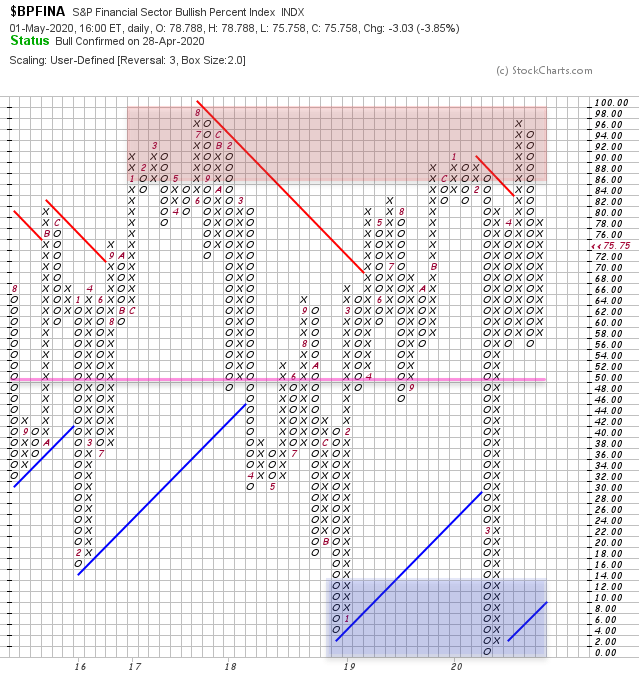
It is worth noting that breadth, based on the S&P Financial Sector Bullish Percent Index, saw continued decline following the remarkable rise in bullish breadth following the development of the current structural low, 17.50s. Consolidation in breadth now develops near the bullish extreme zone. Stocks more broadly, as viewed via the NYSE, have also seen similar behavior. Asymmetric opportunity develops when the market exhibits extreme bullish or bearish breadth with structural confirmation. Caution remains warranted as some time is likely needed for lower prices to find acceptance before structural support can develop. It is also worth noting that historically, the largest rallies tend to be within the context of bear markets.
The market structure, order flow, and breadth posture will provide the empirical evidence needed to observe where asymmetric opportunity resides.
Disclosure: I/we have no positions in any stocks mentioned, and no plans to initiate any positions within the next 72 hours. I wrote this article myself, and it expresses my own opinions. I am not receiving compensation for it (other than from Seeking Alpha). I have no business relationship with any company whose stock is mentioned in this article.
Be the first to comment