

Gold (XAU/USD) Analysis
- Tightening global monetary policy weighs on gold as the ECB is set to join the rate hike club
- Gold on track for 6th consecutive weekly decline. 1677 remains a key level of resistance as the metal continues further into oversold territory
Gold Languishes as the ECB Joins the Rate Hike Club
Today the ECB is all but confirmed to achieve lift-off and raise the main refinancing rate after weeks of forward guidance issues by Christine Lagarde. July was identified as the month where the Bank will raise rates by 25 basis points (bps) but June’s soaring inflation print of 8.6% spurred markets to price in the possibility of a 50 bps rise.
Follow the live coverage of the crucial ECB Decision(13:00 BST) with DailyFX Strategist Justin McQueen
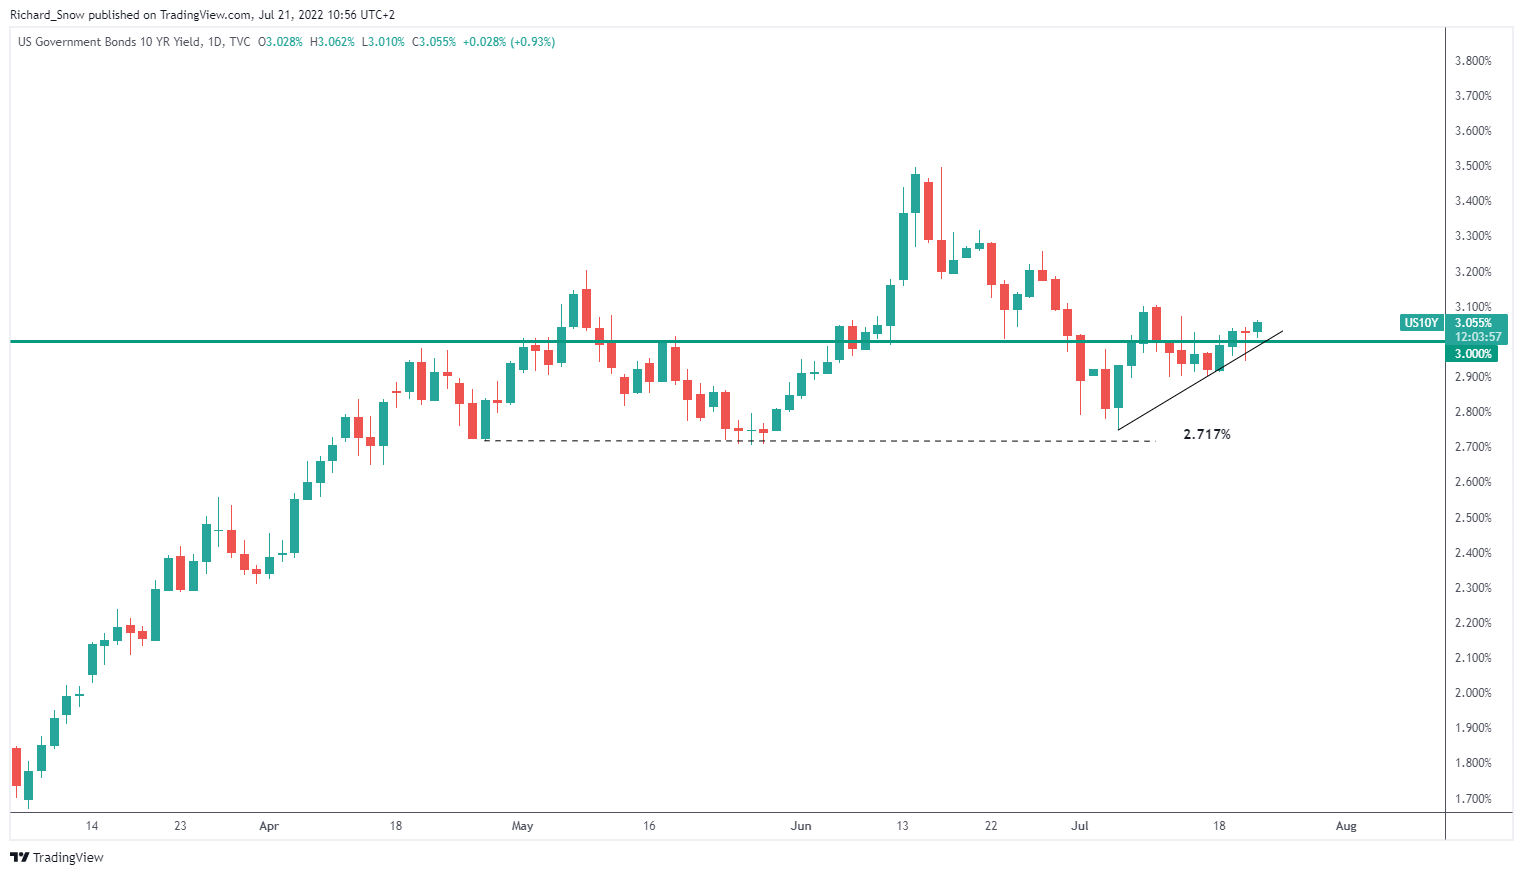
Higher interest rates globally tend to weigh on the non-interest yielding metal and neither does increasing bond yields. The US 10-year yield has recovered in recent days as recession fears ease and now sits above the 3% mark once more.
US 10-Year Treasury Yield Daily Chart
Source: TradingView, prepared by Richard Snow
Gold: Key Technical Levels
Both drops through 1800 and 1760 have not looked back as the precious metal looks set to record a 6th consecutive week of losses. While it appears that global recession fears have eased, global commodity prices continue the downward spiral. Negative fundamentals have dominated gold’s direction and not even a slightly weaker dollar was able to stop the bearish trend.
The 1677 level marks a full Fibonacci retracement of the 2020-2021 move and could trigger a spate of further selling if broken with reasonable momentum. The MACD shows that momentum appears intact for the time being but the RSI continues to trade in oversold conditions – raising the risk of a potential pullback in the coming days. Support appears at 1677, 1645 and then 1557 with resistance all the way back at 1760.
Gold (XAU/USD) Daily Chart
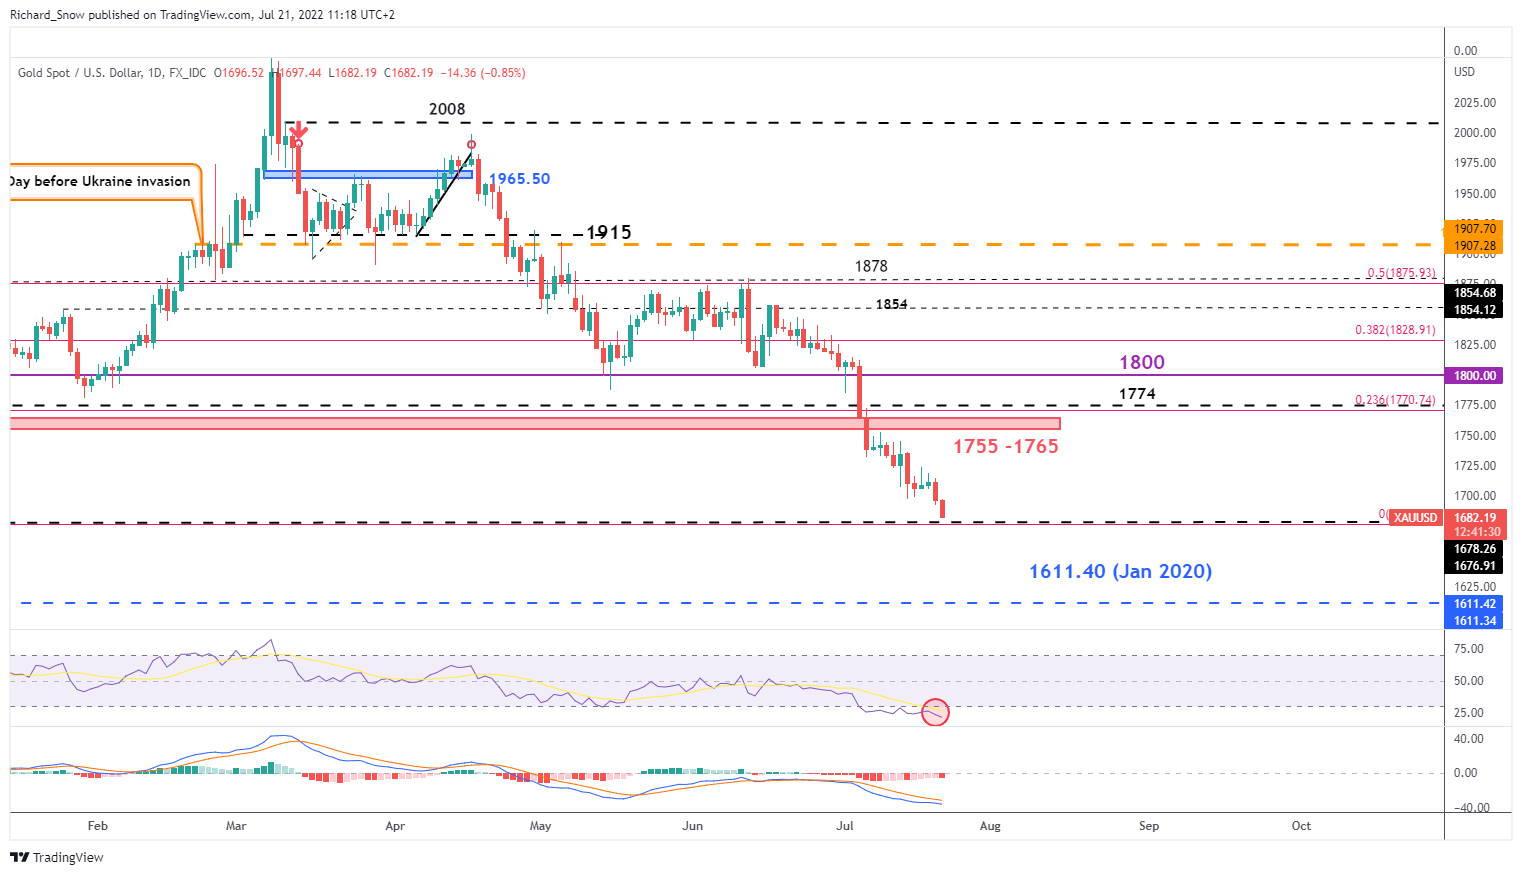
Source: TradingView, prepared by Richard Snow
The weekly chart helps to show the significance of the 1677 level as it kept sellers at bay throughout 2021. Interestingly, the RSI on the weekly is approaching oversold conditions, suggesting that we may see a period of consolidation or even a short-term pullback if 1677 holds in the coming days. However, given the weak fundamentals and strong trend – it is difficult to see any longer-term ascendency in gold meaning further selling, on a break below 1677, appears more likely. 1677 remains key for gold’s next move.
Gold (XAU/USD) Weekly Chart
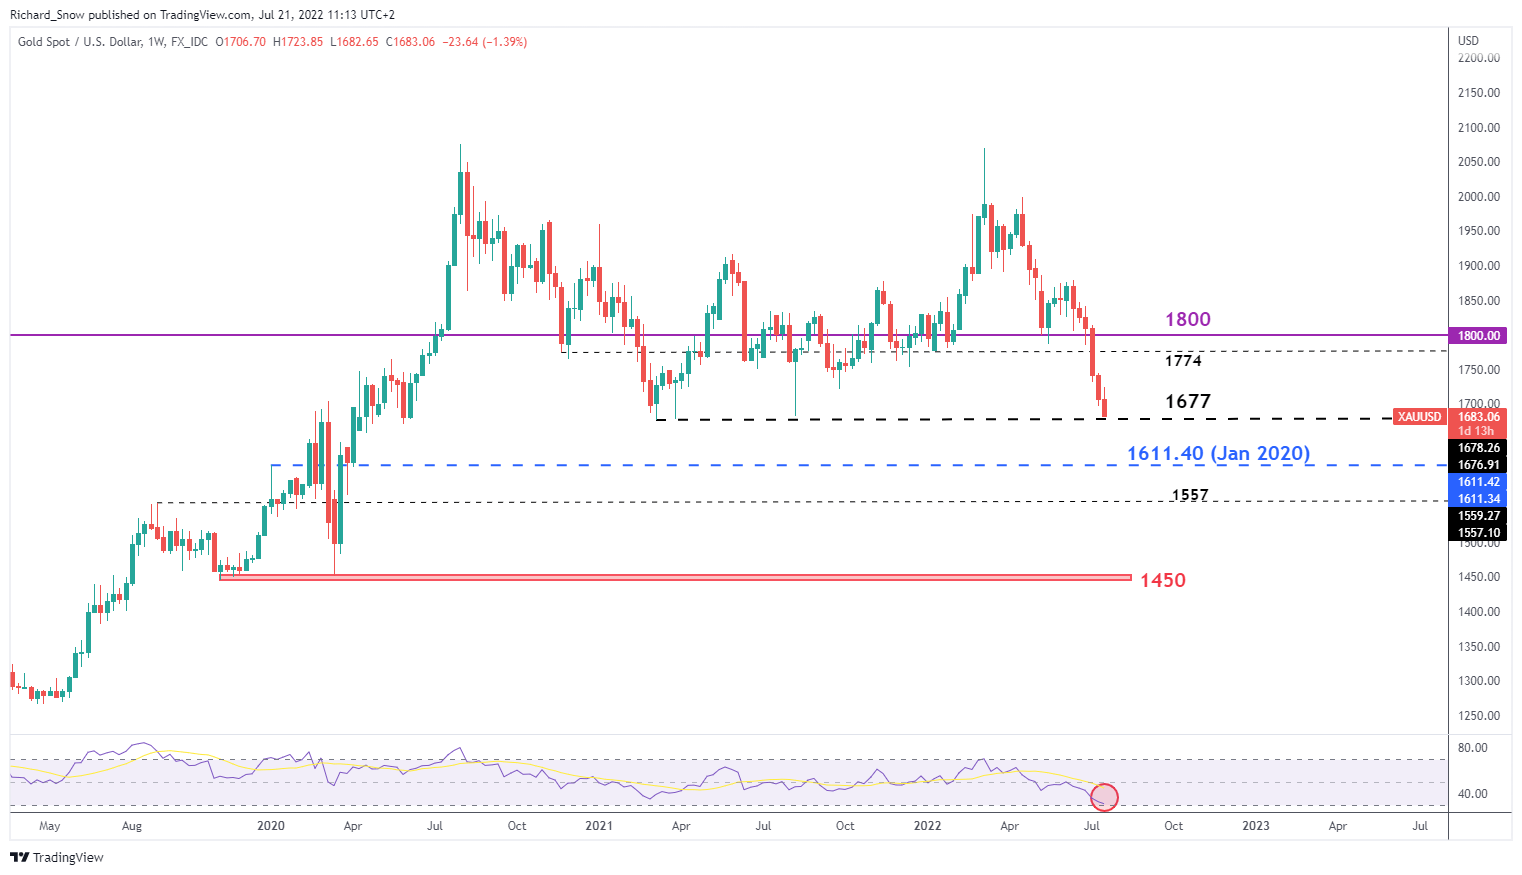
Source: TradingView, prepared by Richard Snow
— Written by Richard Snow for DailyFX.com
Contact and follow Richard on Twitter: @RichardSnowFX
Be the first to comment