

Gold (XAU/USD) Analysis, Price and Chart
- Gold continues to respect 20-day sma resistance.
- A cluster of support levels lie ahead.
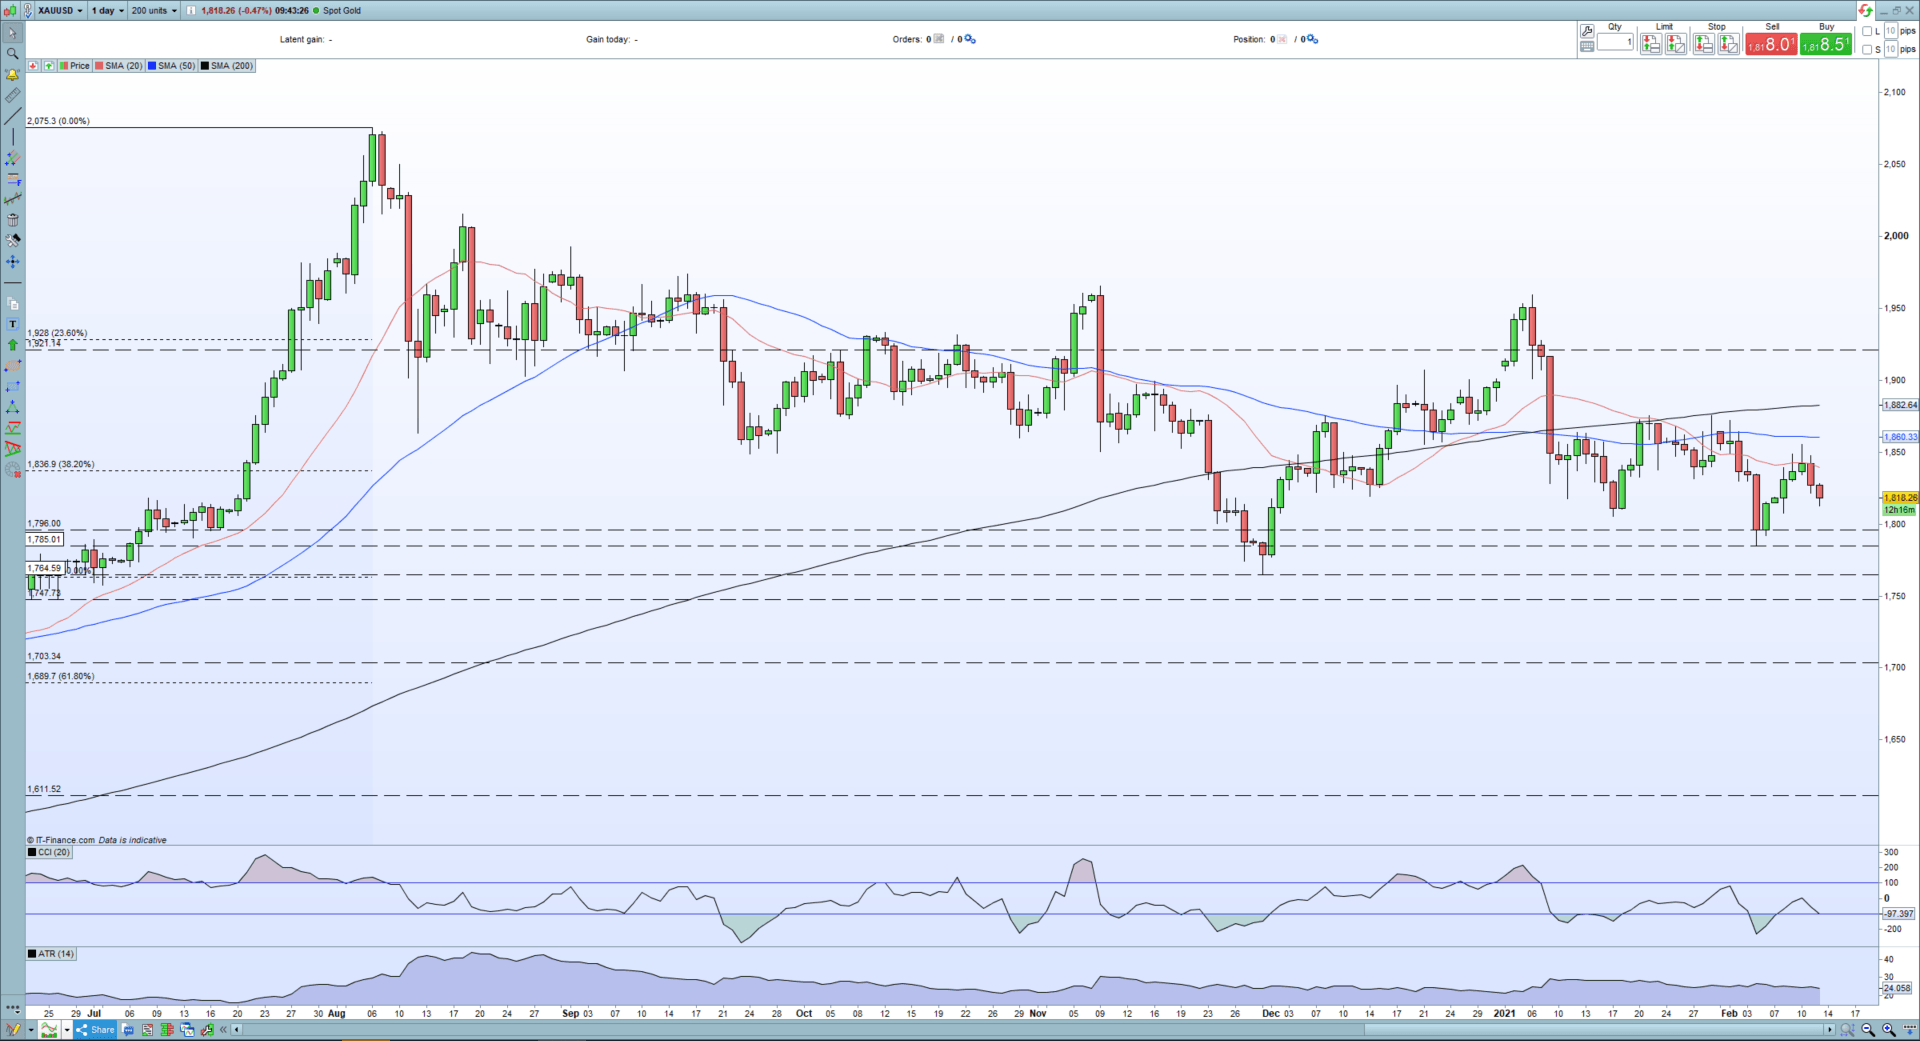
The price of gold is struggling to find any real direction with all of this week’s gains given back so far. The small pick-up in the US dollar is weighing on the precious metal although the move in the greenback has been small at best. From a technical viewpoint, gold remains under downside pressure from all three simple moving averages with the 20-day sma (red line) acting as initial resistance this week. Gold will need to open above this indicator if it is to regain any bullish sentiment.
Moving Averages (MA) Explained for Traders
Initial resistance off the 20-day sma currently at $1,840/oz. is followed by this week’s high at $1,855/oz. and the 50-day sma at $1,860/oz. In the short-term it looks increasingly likely that these levels will cap any further upside. Support for gold starts at around $1,807/oz. with various levels of horizontal support seen on the chart all the way down to $1,764/oz. which also coincides with the 50% Fibonacci retracement of last year’s March to August rally. It looks likely that unless there is a sharp change in market sentiment, the value of the US dollar or US Treasury yields, then gold will continue to fluctuate in a $1,760/oz. to $1,860/oz. range for now.

Recommended by Nick Cawley
Download the Q1 2021 Gold Forecast
Gold Daily Price Chart (June 2020 – February 12, 2021)
| Change in | Longs | Shorts | OI |
| Daily | 3% | -2% | 2% |
| Weekly | -12% | 36% | -6% |
Client sentiment throws up an interesting move this week with the numbers of traders net-short compared to last week jumping sharply. IG retail trader data show 81.49% of traders are net-long with the ratio of traders long to short at 4.40 to 1.The number of traders net-long is 2.97% higher than yesterday and 14.87% lower from last week, while the number of traders net-short is 8.71% higher than yesterday and 38.34% higher from last week.
We typically take a contrarian view to crowd sentiment, and the fact traders are net-long suggests Gold prices may continue to fall. Yet traders are less net-long than yesterday and compared with last week. Recent changes in sentiment warn that the current Gold price trend may soon reverse higher despite the fact traders remain net-long.
What is Market Sentiment and How Does it Work?
What is your view on Gold – are you bullish or bearish?? You can let us know via the form at the end of this piece or you can contact the author via Twitter @nickcawley1.
Be the first to comment