Gold Price Outlook:
Gold Price Forecast: XAU/USD Clings to Support After Steep Losses
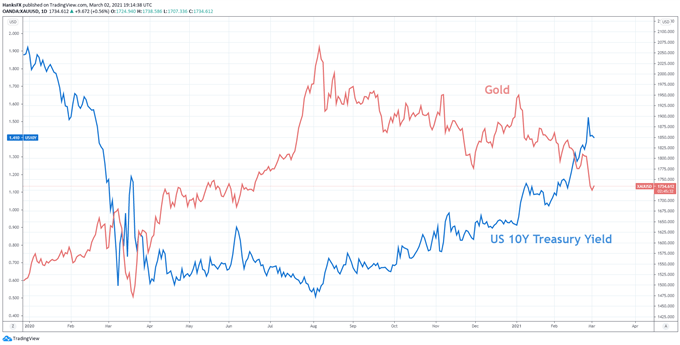
Gold suffered staggering declines last week falling from the $1,800 area to just north of $1,700. The losses came as US Treasury yields continued to rise, briefly overtaking the 1.5% mark which spawned a simultaneous sell off in US equities. Now with gold at support and US Treasury yields treading water, gold may look to inch higher in the days ahead as itconsolidates recent price action.

Recommended by Peter Hanks
Get Your Free Gold Forecast
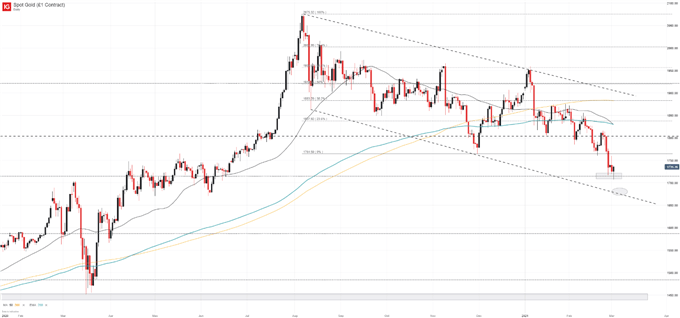
That being said, the fundamental landscape remains largely unchanged for gold and if US Treasury yields continue to rise in the weeks ahead, there may be further weakness in store for gold.Aside from the fundamental side of the argument, gold has posted series of lower highs and lower lows consistently since August. With the most recent leg lower taking aim at support around $1,715 and the death cross formationin early January, the technical outlook remains firmly bearish in my opinion.
Gold Price Chart Overlaid with US 10 Year Treasury Yield (January 2020 – March 2021)
Chart created in TradingView
Nevertheless, gold may have to consolidate before it extends lower still. Should gains materialize, initial resistance may lie around the $1,765 mark which coincides with the November 2020 low. The zone also offered modest support in mid to late February. Subsequent resistance likely resides around the $1,800 level. Again, while gains may occur on shorter timeframes, such retracements could allow for renewed bearish exposure as the risk reward profile shifts favorably.
Gold (XAU/USD) Price Chart: Daily Time Frame (February 2020 – March 2021)
How to Trade Gold: Top Gold Trading Strategies and Tips
Gold has shown few signs the larger downtrend since August will suddenly end so there is little to suggest a larger reversal higher to the 200 day moving average or the top end of the descending channel is imminent.
Starts in:
Live now:
Mar 03
( 16:03 GMT )

Recommended by Peter Hanks
Weekly Stock Market Outlook
On the other hand, a break beneath the lower bound of the channel could increase selling pressure which might see losses accelerate. The lower bound currently rests around the $1,675 area but moves gradually downward from there on. As gold awaits it next move, follow @PeterHanksFX on Twitter for updates and analysis.
–Written by Peter Hanks, Strategist for DailyFX.com
Contact and follow Peter on Twitter @PeterHanksFX


Be the first to comment