

kynny/iStock via Getty Images
SPDR S&P Aerospace & Defense ETF (NYSEARCA:XAR) is an exchange-traded fund that invests in accordance with its chosen benchmark index, S&P Aerospace & Defense Select Industry Index: “The Index comprises stocks in the S&P Total Market Index that are classified in the GICS aerospace & defense sub-industry.” The fund‘s gross expense ratio is 0.35%, with assets under management of $1.25 billion as of September 1, 2022.
I previously covered XAR in my article dated June 20, 2022, in which I was bearish on the fund’s prospects, essentially based on valuation alone (looking at analyst forecasts of earnings, and applying an appropriate discount rate to these). While the fund’s price has risen by 4.55% since that article’s publication, per Seeking Alpha data at the time of writing, the S&P 500 has risen by 6.79% (per the same data). I would continue to hold a bearish view, as I will now explain.
What I like about the data available from S&P Dow Jones Indices, is that they are not forgiving when it comes to earnings numbers. The most recent factsheet for the benchmark index (referenced above), as of August 31, 2022, provides us with a trailing price/earnings ratio of 2,871.44x, which is of course meaningless for valuation purposes. The forward price/earnings ratio was 65.93x, with a price/book ratio of 3.37x. Even the dividend yield was just 0.63%, or from SPDR themselves: XAR’s 30-day SEC yield was just 0.35%.
XAR seems intuitively overvalued to me. Estimated three- to five-year earnings growth is “just” 6.79%. Even if those earnings come rolling in, XAR’s concentrated portfolio of 34 holding are not even priced in line with other major equity indices’ dividend yield potential. Still, given heavy amounts of depreciation in more industrial portfolios, earnings can often understate underlying cash flows; the fund’s price/cash flow was a much more sensible-looking 18.03x as of September 1, 2022. Meanwhile, SPDR offered trailing and forward price/earnings ratios (most likely adjusted earnings) of 25.19x and 22.98x, respectively. We can by all means use these adjusted earnings figures to value XAR, but only if we properly acknowledge that these over-state underlying earnings.
Assuming a steady (adjusted) return on equity of 10-12%, I arrive at an IRR gauge for XAR of circa 11%, which is high. My three- to five-year earnings growth estimate comes out to circa 7-8%, which is actually more generous than SPDR’s figure. That also implies an underlying equity risk premium of about 7%, if I assume a risk-free rate of about 4% (higher than the current U.S. 10-year or indeed 20-year yield, but allowing for some positive variance there).
Author’s Calculations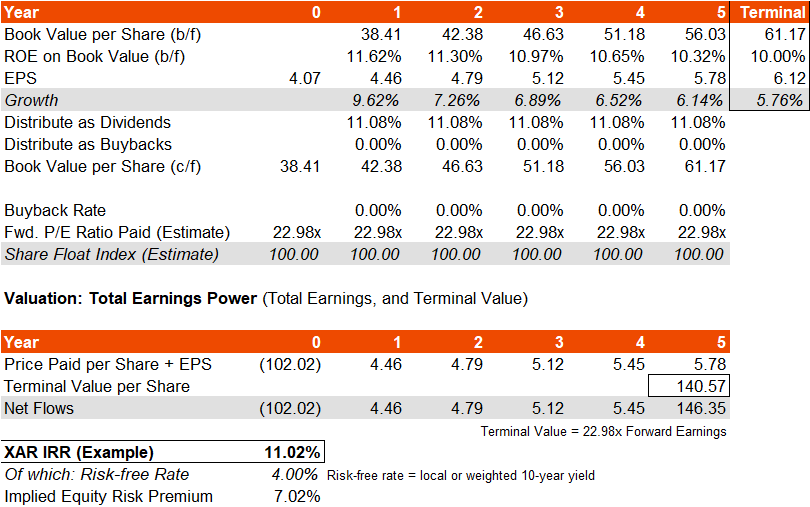
An ERP of 7%, scaled back by XAR’s historical beta of about 1.17x, takes us to about 6% on an adjusted basis. That is still higher than the fair long-term range of about 4.2-5.5% for the U.S. ERP. Still, we are basing this valuation on technically over-stated earnings, and a very tight dividend yield. This is the basic approach I took before, although I did consider that adjusted numbers were over-estimating earnings, which fed into my prior thesis as now.
While the XAR portfolio is made up of large, strong businesses, from a valuation perspective they are not attractive when you consider real, underlying earnings power (which is lower than adjusted numbers).
It is also worth noting that while my implied IRR in my model above at around 11% on a headline basis is higher than my prior article’s circa 7%, in part due to fluctuating consensus estimates of forward earnings, and the price/book value, the IRR delta in great part due to the increased price/earnings multiple that now applies. It is possible that this could fall from the presently higher (adjusted) 22.98x, which implies a forward earnings yield of just 4.35%. Given that risk-free rates are not far off 4%, this implies either a tiny equity risk premium, or very strong long-term earnings growth potential, and the former seems more likely.
Energy markets are likely to hit industrial companies (in which I would include aerospace and defense, more broadly) disproportionately. Given tighter margins and not especially strong underlying (adjusted) returns on equity, the XAR portfolio is certainly not immune to negative macroeconomic shocks. Higher rates are, as with other equities, bad for XAR valuations, but also tighter financial conditions are going to make it difficult for industrial companies to affordably refinance and/or source capital for expansion (without net earnings hits). Tighter labour markets also make it difficult for businesses that require plenty of technical labour.
Unemployment may have peaked, and perhaps inflationary pressures have peaked. But on a forward twelve-month basis, it is possible we see a “true recession” begin. The United States is probably in its later stages of its current business cycle, as of Q3 2022; that is, prior to recession (the final stage). Buying equities that are already trading at elevated levels does not seem to make sense (elevated based on unadjusted earnings and dividends, in this case). If XAR continues to trade on cash flows, that is fine, but I cannot seem to square the underlying earnings power of XAR with its valuation.
Most ETFs have seen significant outflows in recent times, but XAR is somewhat of an exception. While large outflows were recognized in May 2022 (see below), on a net basis, the fund has seen net positive inflows over the past year.
ETFDB.com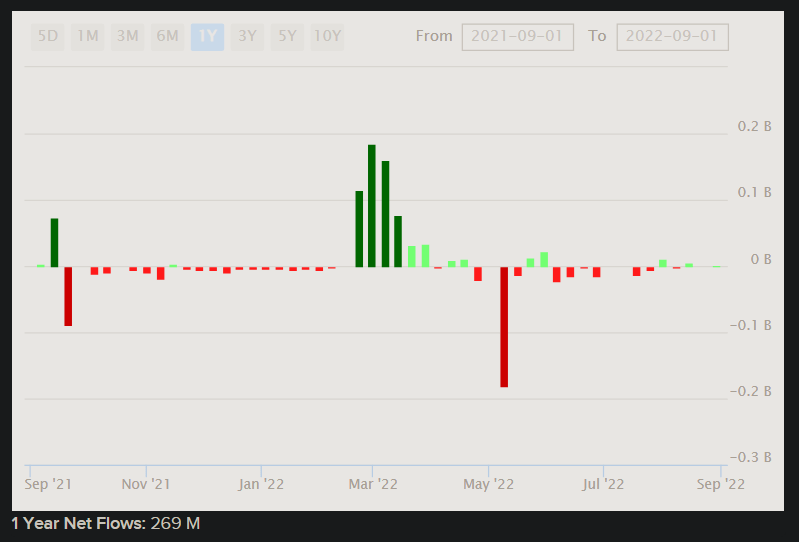
The net inflows hold up even over the past six months, at about $260 million, in spite of a poor month of May earlier this year. XAR’s holdings, and XAR’s shareholders themselves, would appear to both represent strong shareholder bases. XAR is likely a core part of many investors’ portfolios. However, the trailing dividend yield has never been lower, as data from Seeking Alpha would suggest:
Seeking Alpha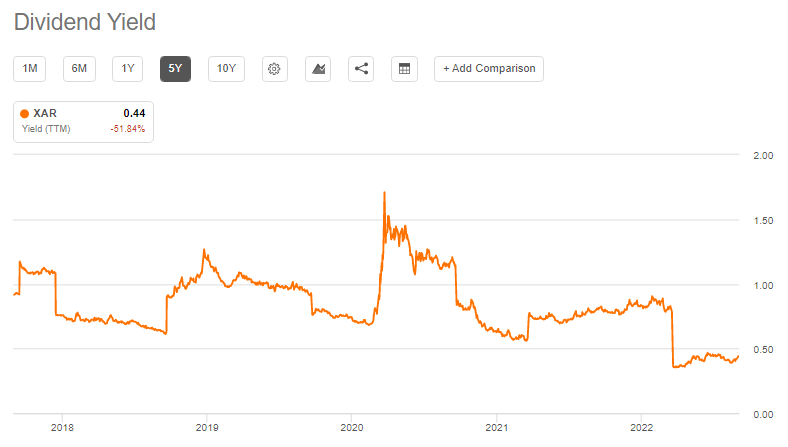
I think XAR is liable to under-perform as we head into the latter stages of this business cycle, based on both the fund’s (unadjusted) valuation, and current inflationary/cost pressures.
Based on my research, over the long run, a fund’s long-term IRR tends to converge on the underlying portfolio return on equity, but usually somewhere between that figure and the forward earnings yield. In this case, the adjusted ROE (as noted earlier) is just under 12%. The forward price/earnings ratio is very high on an unadjusted basis, but its adjusted version implies a forward earnings yield of about 4.35%. The midpoint of the forward ROE and earnings yield is about 8%, which would actually suggest a fairly tight underlying equity risk premium. And once again, this is placing trust in adjusted earnings figures. While these are back-of-the-envelope calculations, I think they are instructive, and would suggest very little out-performance potential.
XAR is either priced for war (admittedly always a risk), which would likely boost aerospace and defense company earnings, or it is otherwise overvalued and/or set to under-perform.
Be the first to comment