

SILVER PRICE OUTLOOK:
- Silver prices plunge about 2.8% to $24.50 as bond yields resume their advance
- Real rates also charge higher and flirt with positive territory for the first time since 2020
- This article looks at the key technical levels for XAG/USD to watch out for in the coming days
Most Read: S&P 500, Nasdaq 100, Dow Jones Forecasts – Variance in the Bounce
Silver prices (XAG/USD) fell sharply on Thursday, down 2.8% to $24.50, tracking a similar but less pronounced move in gold, dragged by rising yields, with the US 10-year up to 2.94%, near multi-year highs set earlier this week. However, the most damaging blow to precious metals is not what is happening to nominal rates, but to real rates. On that note, it is important to underscore that the 10-year Treasury Inflation-Protected Security (TIPS), a good proxy for real rates, is about to turn positive for the first time since 2020 (see chart below).
Source: CNBC
As the Federal Reserve moves forward with its plans for aggressive monetary policy normalization and observed CPI, along with inflation expectations, begins to decline, real rates will drift higher, weighing on assets that don’t produce any income such as silver. Another headwind for this metal, with multiple industrial applications, is the slowdown in economic activity. Although its long-term outlook remains bullish due to the clean energy revolution, near-term demand may weaken if growth falters. At this point, a significant economic downturn is not the baseline scenario, but it is a threat worth keeping an eye on because of the detrimental effects it could have on commodities.
Although the balance of risks for precious metals is tilted toward weakness in the coming months on the back of rising real yields and a stronger U.S. dollar, the situation could change quickly if geopolitical tensions over the war in Ukraine escalate. Gold and silver also act as safe havens, so their prices could rise if the military conflict in Eastern Europe gets out of control and sparks panic in financial markets. That said, traders should follow developments in the region to better assess the outlook for both XAG/USD and XAU/USD.
In terms of technical analysis, after a steep decline this week, silver price has fallen beneath its 50-day moving average and is now attempting to break below a key support near $24.50. If this floor is decisively invalidated with a weekly close below it, the metal could accelerate its decline and head towards $24.18, the 50% Fibonacci retracement of the December 2021/March 2022 rally. On further weakness, the focus shifts down to the 200-day SMA, followed by $23.53. On the flip side, if buyers return and regain control of the market, initial resistance appears at $24.85 and then $25.40.
SILVER PRICE TECHNICAL CHART
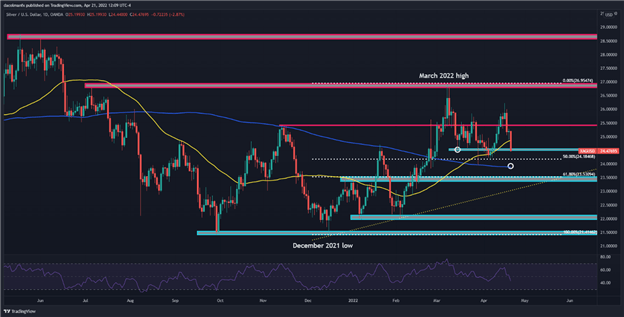
Silver Price Chart Prepared Using TradingView
EDUCATION TOOLS FOR TRADERS
- Are you just getting started? Download the beginners’ guide for FX traders
- Would you like to know more about your trading personality? Take the DailyFX quiz and find out
- IG’s client positioning data provides valuable information on market sentiment. Get your free guide on how to use this powerful trading indicator here.
—Written by Diego Colman, Contributor
Be the first to comment