

Crude Oil, WTI, OPEC, Spare Capacity, RSI Divergence – Talking Points
- Global oil prices drop after OPEC signals releasing more barrels in March
- OPEC members struggle to pump allotted amounts as spare capacity drops
- Technical outlook shows possibility for more weakness on RSI divergences
Crude oil prices are moving slightly lower through Asia-Pacific trading on Thursday, extending losses from Wednesday when prices nearly hit $90 per barrel before retreating. The downside comes after OPEC, and its allies, collectively known as OPEC+, signaled they would open the supply taps further in March at the pace of 400k barrels per day. Brent prices – the global benchmark – continue to trade at a slight premium to WTI.
The pullback in prices may be short-lived, however. That is because OPEC countries are struggling to pump as much as allowed per the cartel’s quota limits, caused by years of underinvestment and recent supply disruptions in Libya and the UAE. At the same time, demand for oil and other fuel products continues to increase, pressuring already strained inventory levels.
Space capacity among OPEC members – defined as the production available within 30 days, with a sustained period of at least 90 days, per the EIA – has fallen near the lowest levels seen since the pandemic started, and most of that spare capacity is concentrated in Saudi Arabia, Kuwait and Iraq. OPEC’s ability to adjust to major supply disruptions diminishes as that capacity drops. That said, the current pullback may be short-lived given the precarious global supply structure.
Possible Event Risks for Energy Traders:
- Next OPEC meeting for April production on March 2
- Russia/Ukraine situation, oil-related sanctions
- US oil rig count on February 4 (Baker Hughes)
WTI Crude Oil – Technical Forecast
Oil prices could be susceptible to a bigger pullback when examining the technical structure, given multiple bearish divergences between price and the Relative Strength Index (RSI). The lower lows on the RSI oscillator compare with higher highs in price, which suggest slowing momentum. That doesn’t necessarily indicate a drop is about to occur, but it is bearish nonetheless.
A break below the 12-day Exponential Moving Average (EMA), which has supported prices since late December, may trigger a move lower, however. A drop to the 23.6% Fibonacci retracement may be on the cards in that scenario. Alternatively, should prices resume moving higher, the psychological 90 level is a likely area of resistance.
WTI Crude Oil – Daily Chart
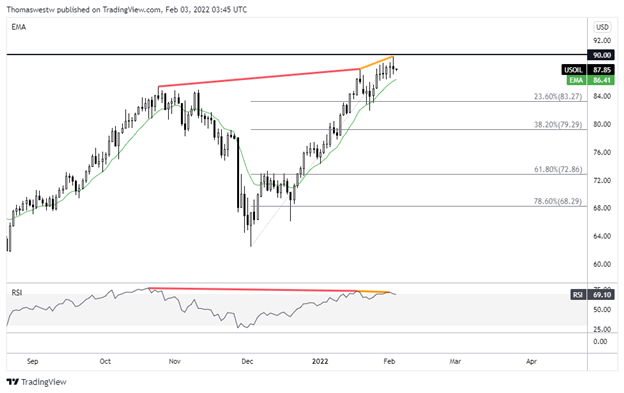
Chart created with TradingView
— Written by Thomas Westwater, Analyst for DailyFX.com
To contact Thomas, use the comments section below or @FxWestwater on Twitter
Be the first to comment