

Key Talking Points:
- Oil demand picks up as economies recover from the pandemic shutdowns
- Power crunch in China unsettling oil traders
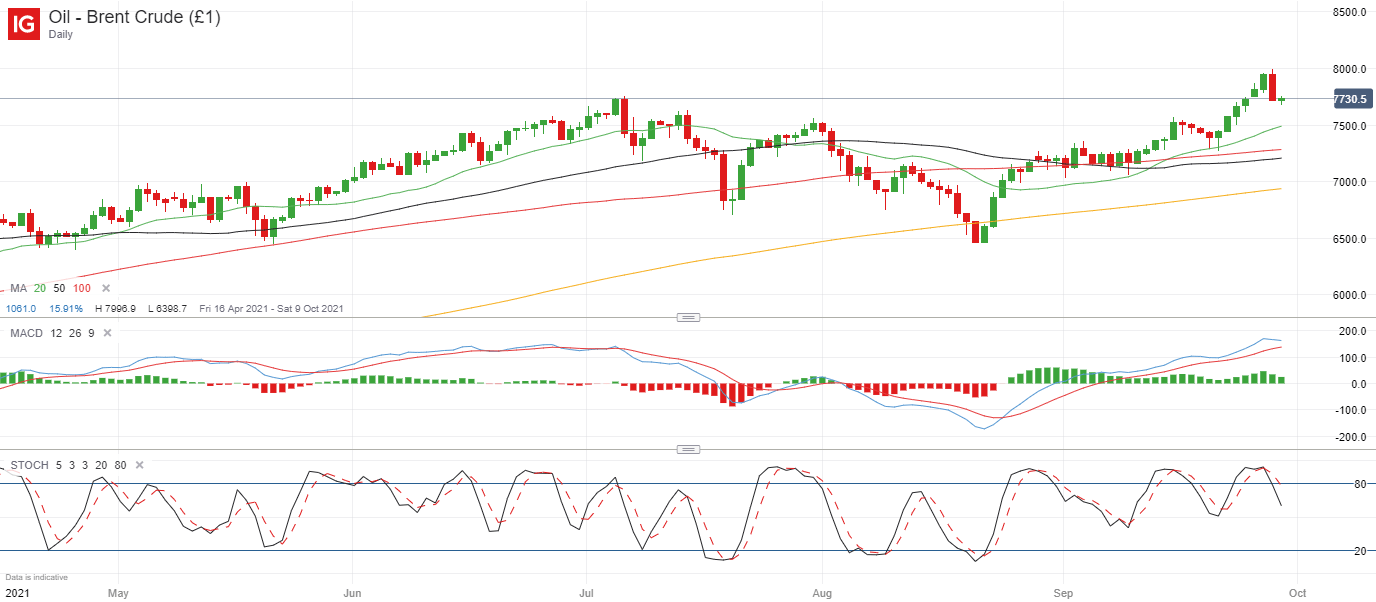
Brent crude has dipped this morning after a 5-day rally ran out of steam after hitting a 3-year high just shy of $80 a barrel. It’s likely that profit-taking is behind yesterday’s rejection after a good rally but we may have some stagnation around this level as investors weigh up where to go next. The run-up in prices is leading on from beliefs that oil-producing countries will decide to keep supply tight when the Organization for Petroleum Exporting Countries (OPEC) meets next week.
This is in addition to growing demand as nations recover from the pandemic, with US crude oil inventories dropping for a seventh week in a row last week, and forecasts expecting another 1.65 million drop in today’s reading. But the market may face headwinds from a power crunch in China, potentially driving down economic activity as power rationing is in force. That said, the shortage in coal supplies may see incremental use of diesel in power generation, which would keep demand for oil supported.
The market may also be in a bigger deficit than expected as struggling supply meets growing demand and so forecasts for Brent to reach $100 by year-end have resurfaced again. So far, the daily chart is showing overbought conditions in the short-term but yesterday’s rejection at $80 is helping to settle the market for another leg higher. There seems to be plenty of support around its current levels, with the simple moving averages grouping up between $75 and $72.
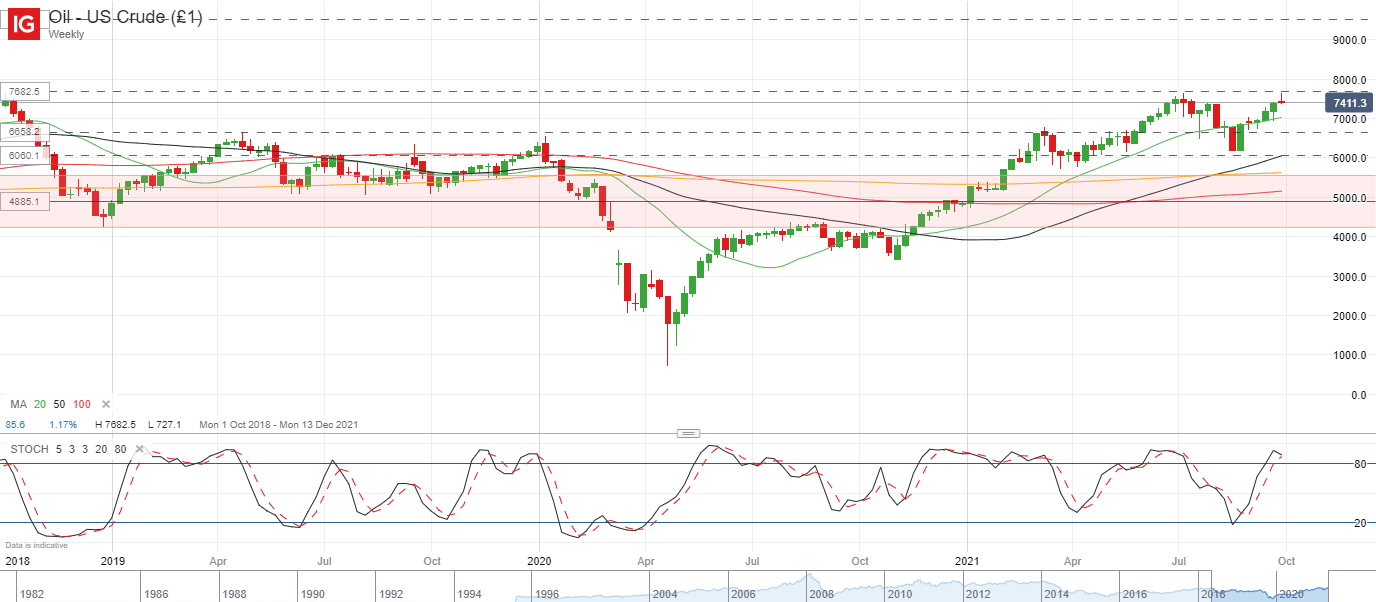
Its US counterpart (WTI) has also seen a steep rally over the past few weeks but has faced rejection at its 2018 high (76.82). The 20-week SMA seems to be trailing the lows and so we may see a pullback towards $70 for support before we see momentum build higher again, whilst the area between $76.80 and $80 is likely to offer increased resistance.
Brent Crude Daily chart
WTI Crude Weekly Chart
Fibonacci Confluence on FX Pairs
Learn more about the stock market basics here or download our free trading guides.
Traders of all levels and abilities will find something to help them make more informed decisions in the new and improved DailyFX Trading Education Centre
— Written by Daniela Sabin Hathorn, Market Analyst
Follow Daniela on Twitter @HathornSabin
Be the first to comment