

ValeryEgorov/iStock Editorial via Getty Images
Step One: Wide-moat stocks with 5-star and 4-star ratings
Historical evidence says that while quality alone is a poor indicator of outperformance, when combined with a decent valuation filter, Morningstar’s moat rating proves to be more than useful. Based on the available data, stocks with a wide-moat rating that also fit into the 4- or 5-star category deserve to be the subject of further analysis. See the detailed explanation and the underlying evidence of our first step in this article.
We focus on those companies that are covered by a Morningstar analyst as assigning a wide-moat rating without thorough analysis is a questionable practice in our opinion. As of March 25, there were 183 wide-moat stocks meeting our criteria, unchanged from last month, as Check Point Software Technologies (CHKP) got included, while IHS Markit got excluded due to S&P Global (SPGI) acquiring the company.
Only 6.0% (11 stocks) of this wide-moat group earned a 5-star (most attractive) valuation rating. Here are they:
|
Company Name |
Ticker |
|
Equifax Inc |
|
|
Meta Platforms Inc |
|
|
Polaris Inc |
|
|
Salesforce.com Inc |
|
|
Yum China Holdings Inc |
|
|
Anheuser-Busch InBev SA/NV |
|
|
Imperial Brands PLC |
|
|
JD.com Inc |
|
|
Taiwan Semiconductor Manufacturing Co Ltd |
|
|
Tencent Holdings Ltd |
|
|
Unilever PLC |
We believe that the percentage of 5-star-rated wide-moat stocks is a good indicator of market sentiment. When this percentage is high, even the best companies are on sale. When the percentage is extremely low, market conditions may warrant caution. (Please note that this is not an indicator for market timing!)
Source: Data from Morningstar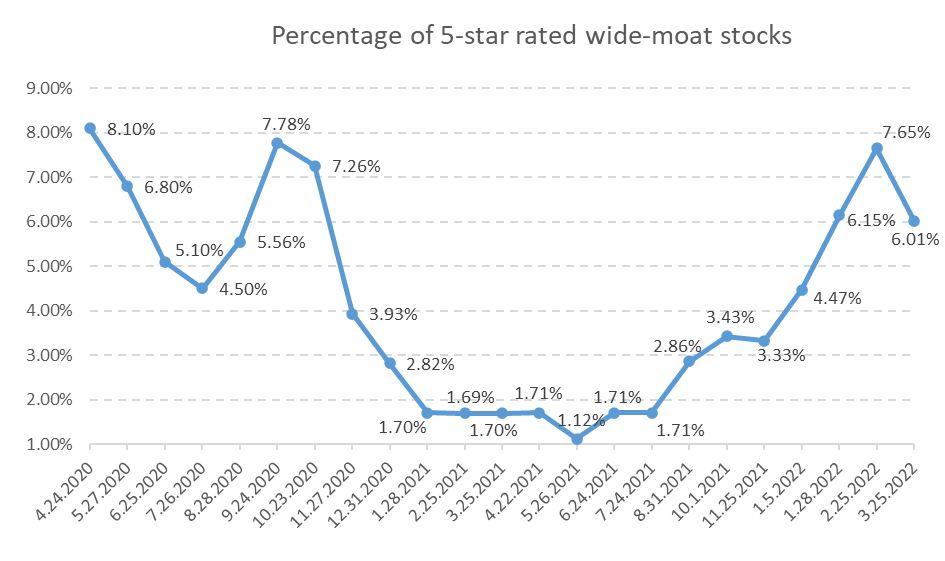
As these best of breed companies may be worth a closer look even when they are just slightly cheaper than their fair value but are not in the bargain bin, we also list the 4-star-rated wide-moat stocks as of March 25:
|
Company Name |
Ticker |
|
3M Co |
|
|
Adobe Inc |
|
|
Alphabet Inc A |
|
|
Amazon.com Inc |
|
|
Biogen Inc |
|
|
Blackbaud Inc |
|
|
BlackRock Inc |
|
|
Boeing Co |
|
|
Brown-Forman Corp Class B |
|
|
Campbell Soup Co |
|
|
Clorox Co |
|
|
Comcast Corp Class A |
|
|
Compass Minerals International |
|
|
Constellation Brands Inc A |
|
|
Ecolab Inc |
|
|
Emerson Electric Co |
|
|
Etsy Inc |
|
|
Gilead Sciences Inc |
|
|
Guidewire Software Inc |
|
|
Honeywell International Inc |
|
|
Intel Corp |
|
|
International Flavors & Fragrances |
|
|
Kellogg Co |
|
|
Lam Research Corp |
|
|
Masco Corp |
|
|
MercadoLibre Inc |
|
|
Merck & Co Inc |
|
|
Microsoft Corp |
|
|
Moody’s Corporation |
|
|
Philip Morris International Inc |
|
|
ServiceNow Inc |
|
|
Starbucks Corp |
|
|
T. Rowe Price Group Inc |
|
|
Teradyne Inc |
|
|
The Walt Disney Co |
|
|
The Western Union Co |
|
|
TransUnion |
|
|
Tyler Technologies Inc |
|
|
Veeva Systems Inc Class A |
|
|
Wells Fargo & Co |
|
|
Zimmer Biomet Holdings Inc |
|
|
Airbus SE |
|
|
Alibaba Group Holding Ltd |
|
|
Allegion PLC |
|
|
Ambev SA |
|
|
ASML Holding NV |
|
|
Baidu Inc |
|
|
Bayer AG |
|
|
British American Tobacco PLC A |
|
|
Core Laboratories NV |
|
|
Fanuc Corp |
|
|
GlaxoSmithKline PLC |
|
|
Julius Baer Gruppe AG |
|
|
Medtronic PLC |
|
|
Reckitt Benckiser Group PLC |
|
|
Roche Holding AG |
|
|
Sanofi SA |
All in all, we have 68 firms that pass our very first criteria. (Down from 76 a month ago.)
Source: Data from Morningstar
Step Two: Historical Valuation in the EVA Framework
We believe that the most widely used valuation multiples are terribly flawed. See this article on why we consider the Future Growth Reliance metric the best-of-breed sentiment indicator that addresses accounting distortions, thus gives us a true picture of which wide-moat companies seem attractively valued in historical terms. We want to buy our top-quality targets when the baked-in expectations are low, since that is when surprising on the upside has the highest probability. As investment is a game of probabilities, all we can do is stack the odds in our favor as much as possible.
32 of the 68 stocks survived this second step. Here’s the list:
We are rather strict when it comes to historical valuation. There are stocks that unquestionably fail both or short- and long-term tests. There are some targets, however, that may look attractively valued if you only focus on the short-term (like the last 5 years), but the longer you zoom out, the more you lose your appetite. It comes down to personal preference where you draw the line. For us, only those stocks are allowed to appear on the heat map in our third step that seem attractively valued in both a short-term and long-term context. (We go back as far as 20 years, calculate averages and medians on different time frames and let our algorithm do the ruthless work.)
Step Three: The Heat Map of the most investable wide-moat stocks
Seeing the stocks of our shortlist on a heat map with a quality and valuation axis is something that can prove very useful when we need to make a decision on which candidates to analyze thoroughly. As explained in our previous article, we use the PRVit (Performance-Risk-Valuation investment technology) model of the EVA Dimensions team.
All in all, PRVit is a multifactor quantitative stock selection model based on EVA-centric measures of Performance, Risk, and Valuation. It first estimates the fundamental value of a company based on its risk-adjusted EVA performance (shown on the vertical axis) and then compares it to its actual valuation (shown on the horizontal axis). All factors in this model were chosen heuristically based on common sense, and not by data mining, yet strong and statistically significant backtests prove the soundness of the PRVit approach both in the U.S. and globally. (See the details here.)
Here is the heat map as of March 25:
Source: Institutional Shareholder Services Inc.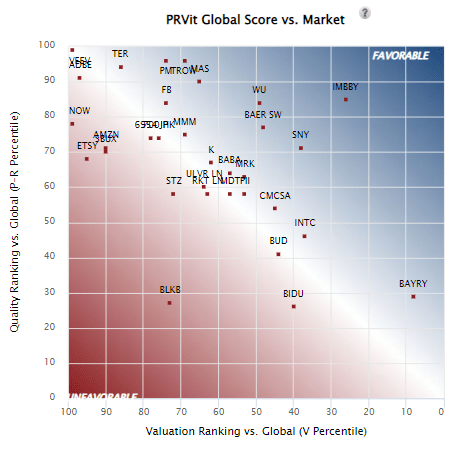
We also present the results in a table format to make your decision easier.
Source: Institutional Shareholder Services Inc., Morningstar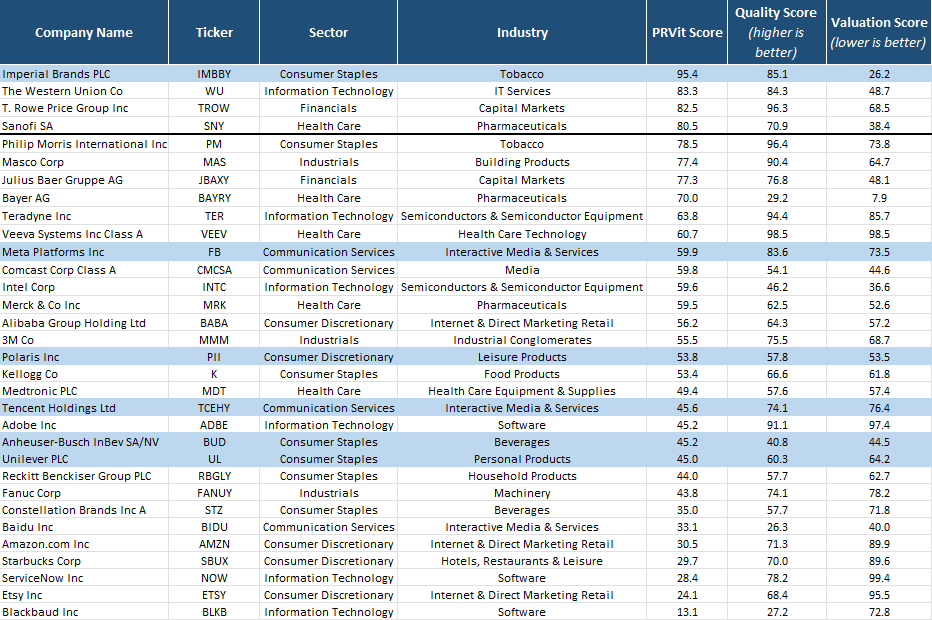
(Stocks highlighted in light blue are Morningstar’s 5-star-rated wide-moat names that survived the second step of our process.)
In PRVit, the factors are grouped into three categories: Performance, Risk, and Valuation. Each company has a composite 0-100 score in each category, where higher is better for Performance and lower is better for Risk and Valuation. We believe that stocks in the upper quintile of the PRVit ranking (with a PRVit score above 80) are worth a closer look.
We plan to run this three-step process on a monthly basis and publish the shortlist of targets it produces. If you don’t want to miss any of these pieces, please scroll up and click “Follow”.
Be the first to comment