

PM Images
Introduction
I have invested 95% of my entire net worth in my dividend growth portfolio. So, needless to say, I’m very passionate about what I own. If I own something, it has my total stamp of approval. I own some exciting stocks that I monitor on a regular basis, and I own stocks that I only check after earnings. Some stocks, I completely forget about sometimes. One of these stocks is Xcel Energy (NASDAQ:XEL). Located in Minnesota, it’s one of America’s largest electric/gas utilities with a fortress balance sheet. It doesn’t pay a high yield (which isn’t common for good utility stocks), yet it has high earnings growth, satisfying dividend growth, and all characteristics that make the stock a good dividend stock. After all, it outperforms the S&P 500 on a long-term basis with an almost equal standard deviation. The fact that I sometimes forget that I own it is a compliment and it’s one of the stocks that I do recommend to (very) conservative dividend growth investors and pretty much everyone looking for defensive investments in their long-term portfolios.
In this article, I will give you the details!
Xcel Energy: Low-Volatility Outperformance
With a market cap of $40.0 billion, Xcel Energy is the fifth-largest company in the regulated electric utility industry. I own two companies in the top 5, the other is Duke Energy (DUK).
Headquartered in Minneapolis, MN, the company was incorporated in 1909. Nowadays, Xcel Energy serves customers in eight mid-western and western states, including parts of Colorado, Michigan, Minnesota, New Mexico, North Dakota, South Dakota, Texas, and Wisconsin. The company does this through six main subsidiaries.
Xcel Energy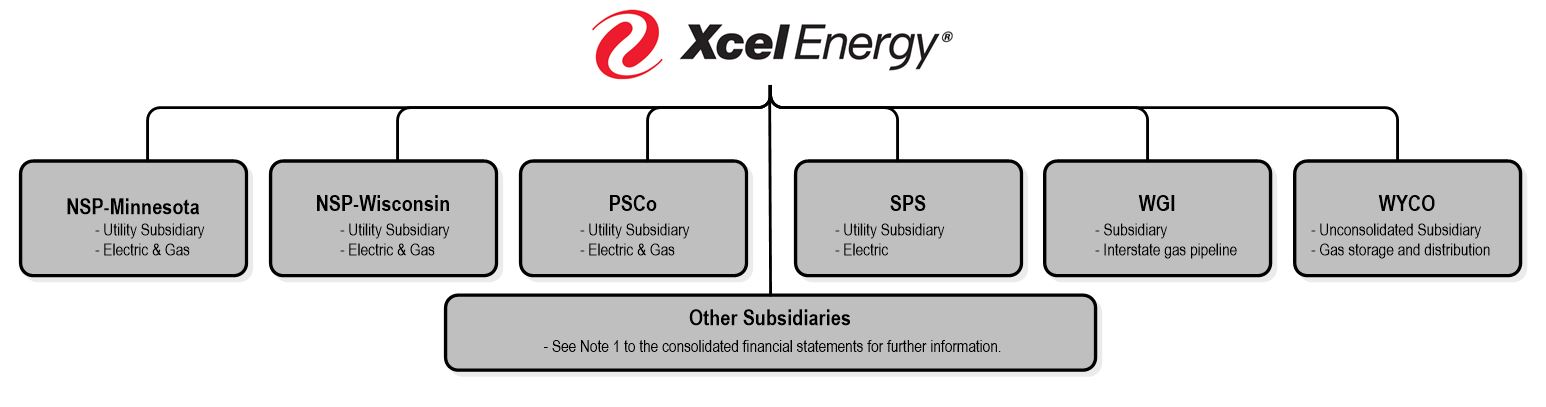
The company services 3.7 million electric customers, and 2.1 million natural gas customers using an asset base of roughly $60 billion.
Xcel Energy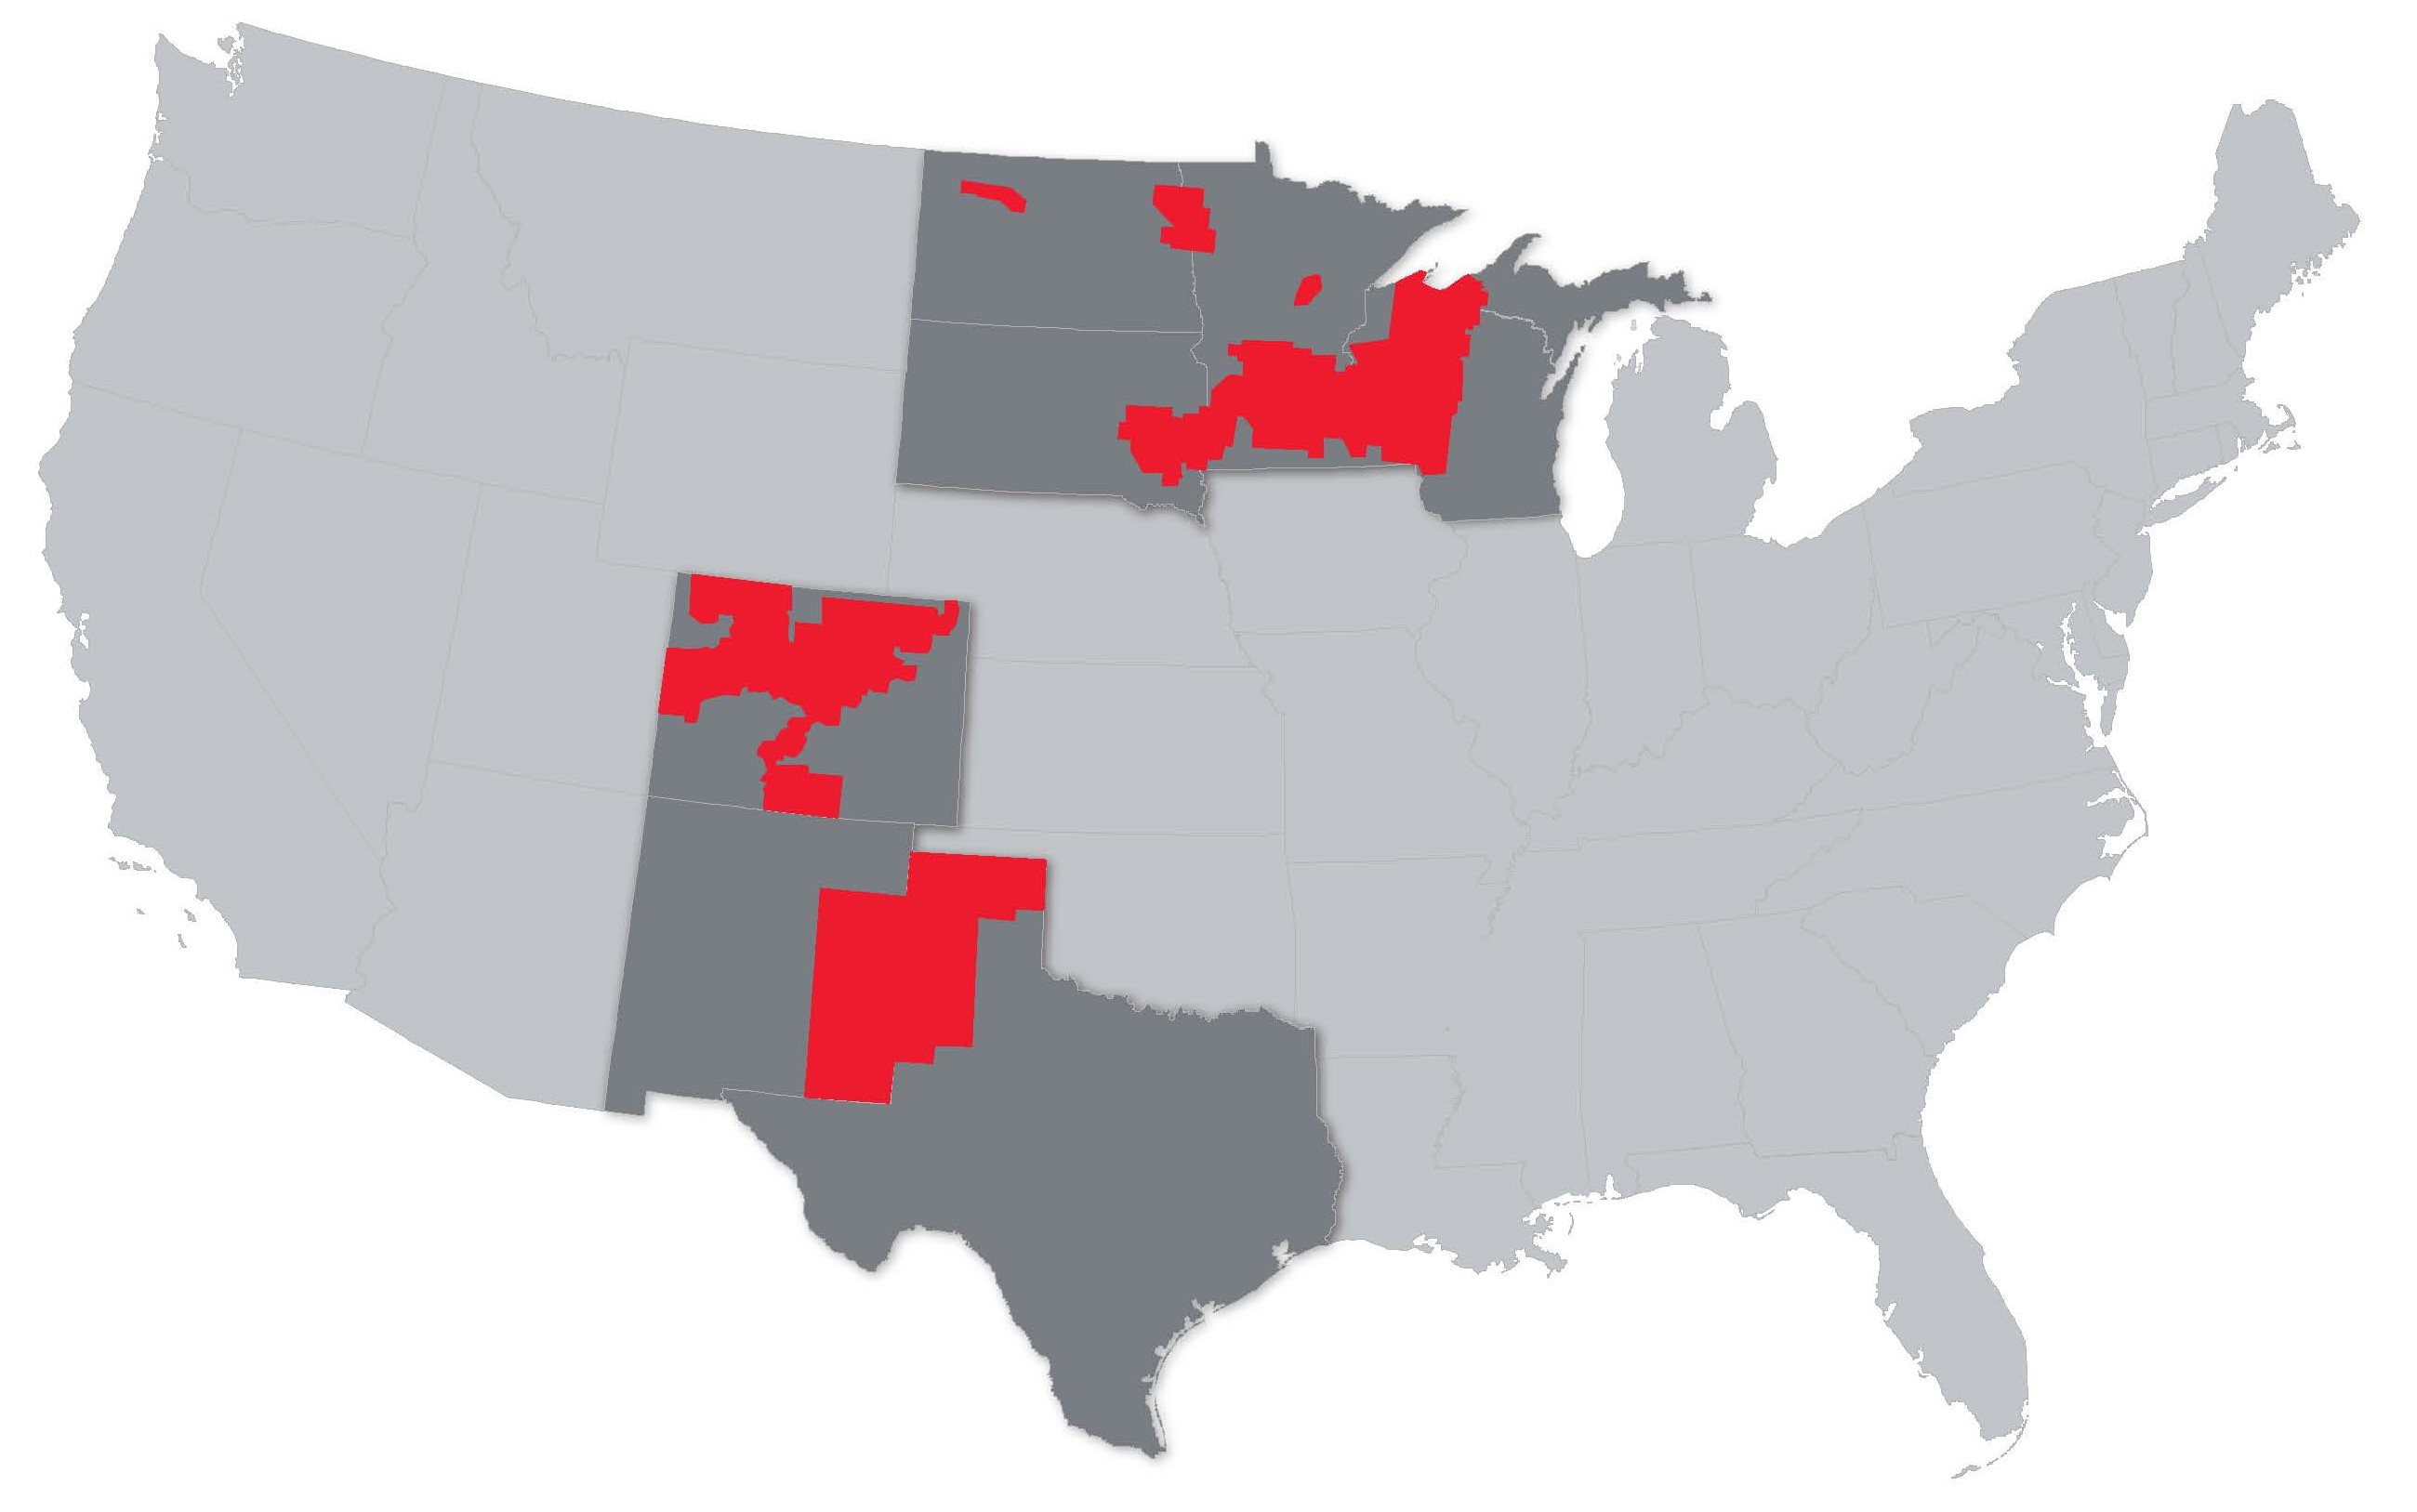
While I believe that utilities are among the most boring investments on the planet (that’s not a bad thing in investing), the company is generating high shareholder returns, outperforming most of its peers.
On a long-term basis, the company aims for 5-7% earnings per share growth. Please note the “PER SHARE” part as utilities often use common equity to finance operations, this dilutes the value per share, including earnings per share. So, 5-7% is fantastic. Also, note that XEL has increased the number of common shares outstanding by 1.2% per year between 2017 and 2021.
Using Seeking Alpha’s handy overview, we see that the company’s EPS has indeed grown between 5% and 7% over the past 10 years – using different intervals.
Seeking Alpha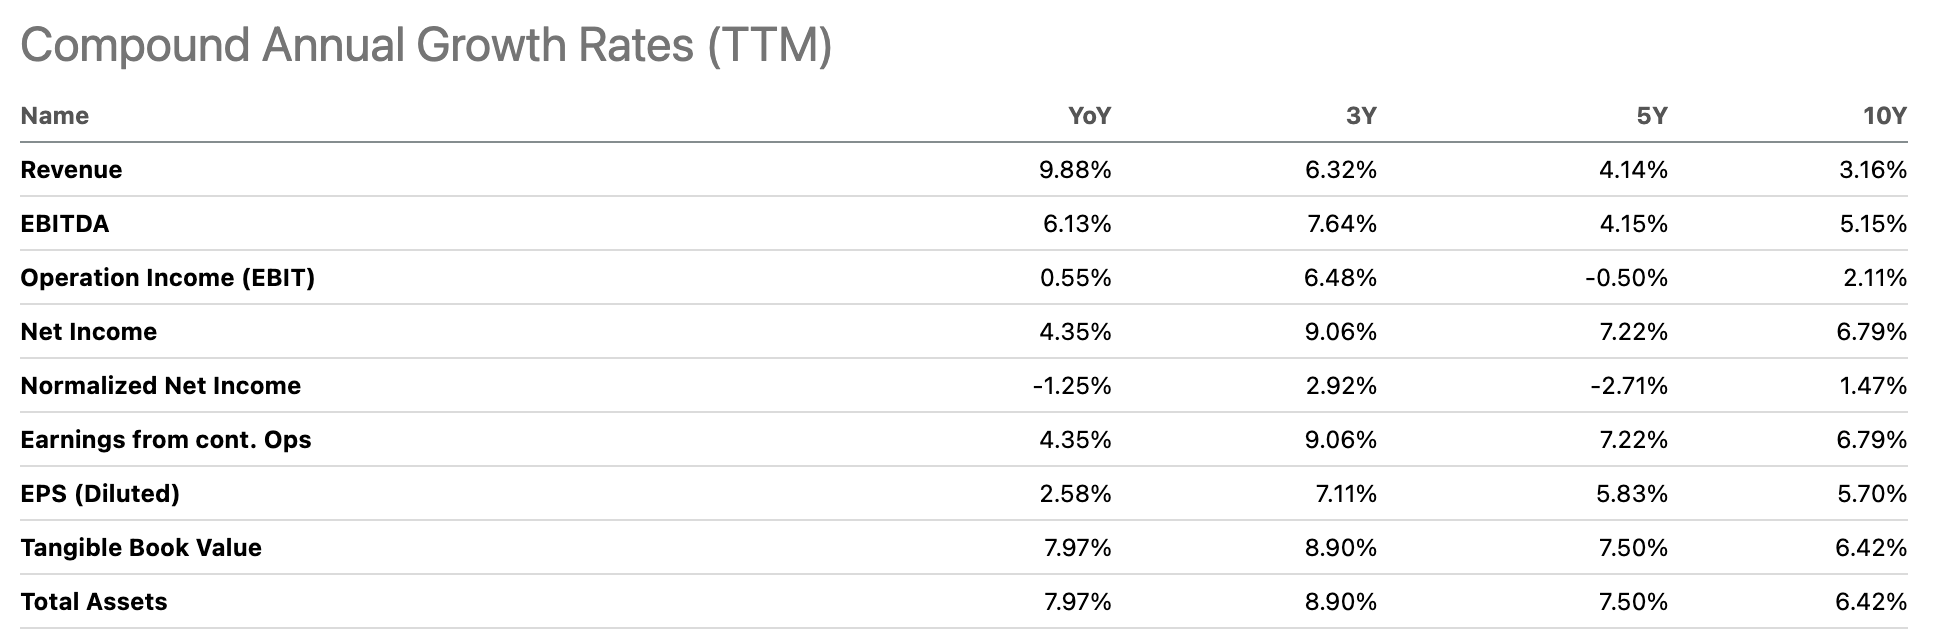
On top of that, the company has a dividend yield of 2.7% with 5-7% annual dividend growth (more on that in this article), which means the company believes it’s in a position to deliver between 8% and 10% in annual shareholder returns.
Xcel Energy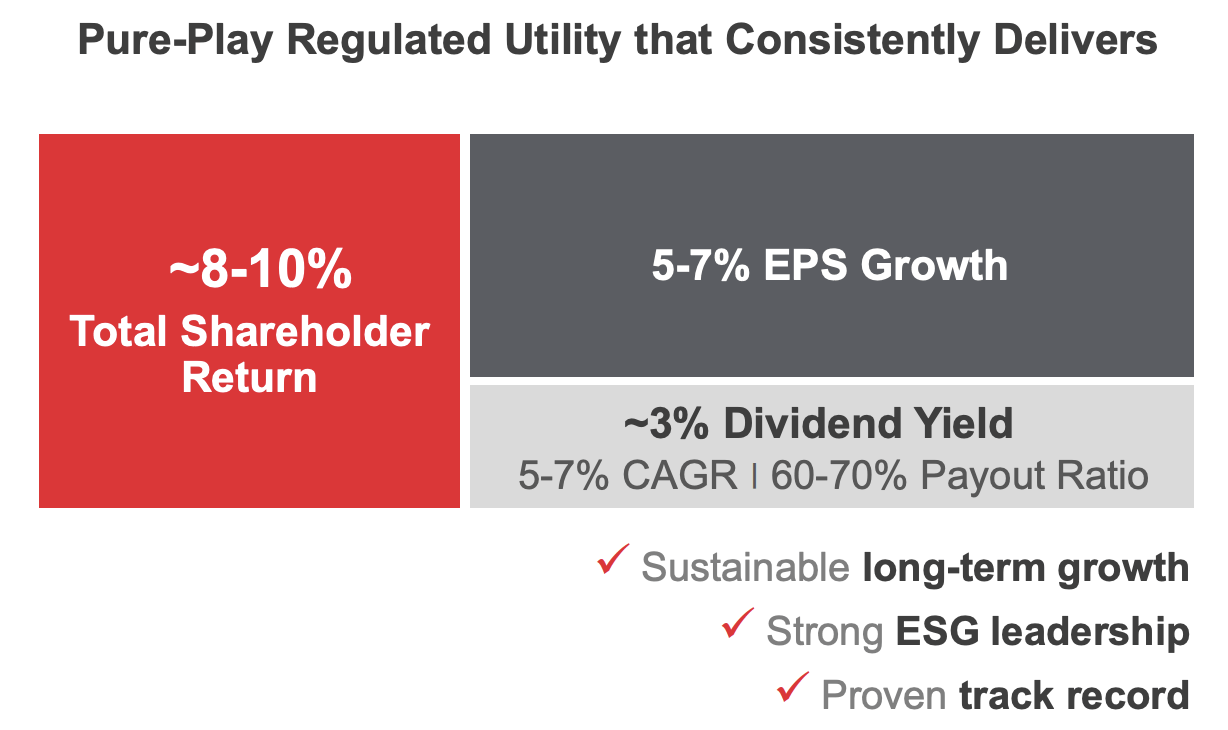
That’s the theoretical part.
The good news is that investors have benefited from even higher returns than that. Since 2004, Xcel has returned 12.3% including dividends. This beats the S&P 500 by 300 basis points. Moreover, the standard deviation was just 15.1% during this period. That is roughly 50 basis points higher than the S&P 500. Bear in mind that the S&P 500 is an index holding 500 stocks. A standard deviation difference this narrow is truly fantastic.
Portfolio Visualizer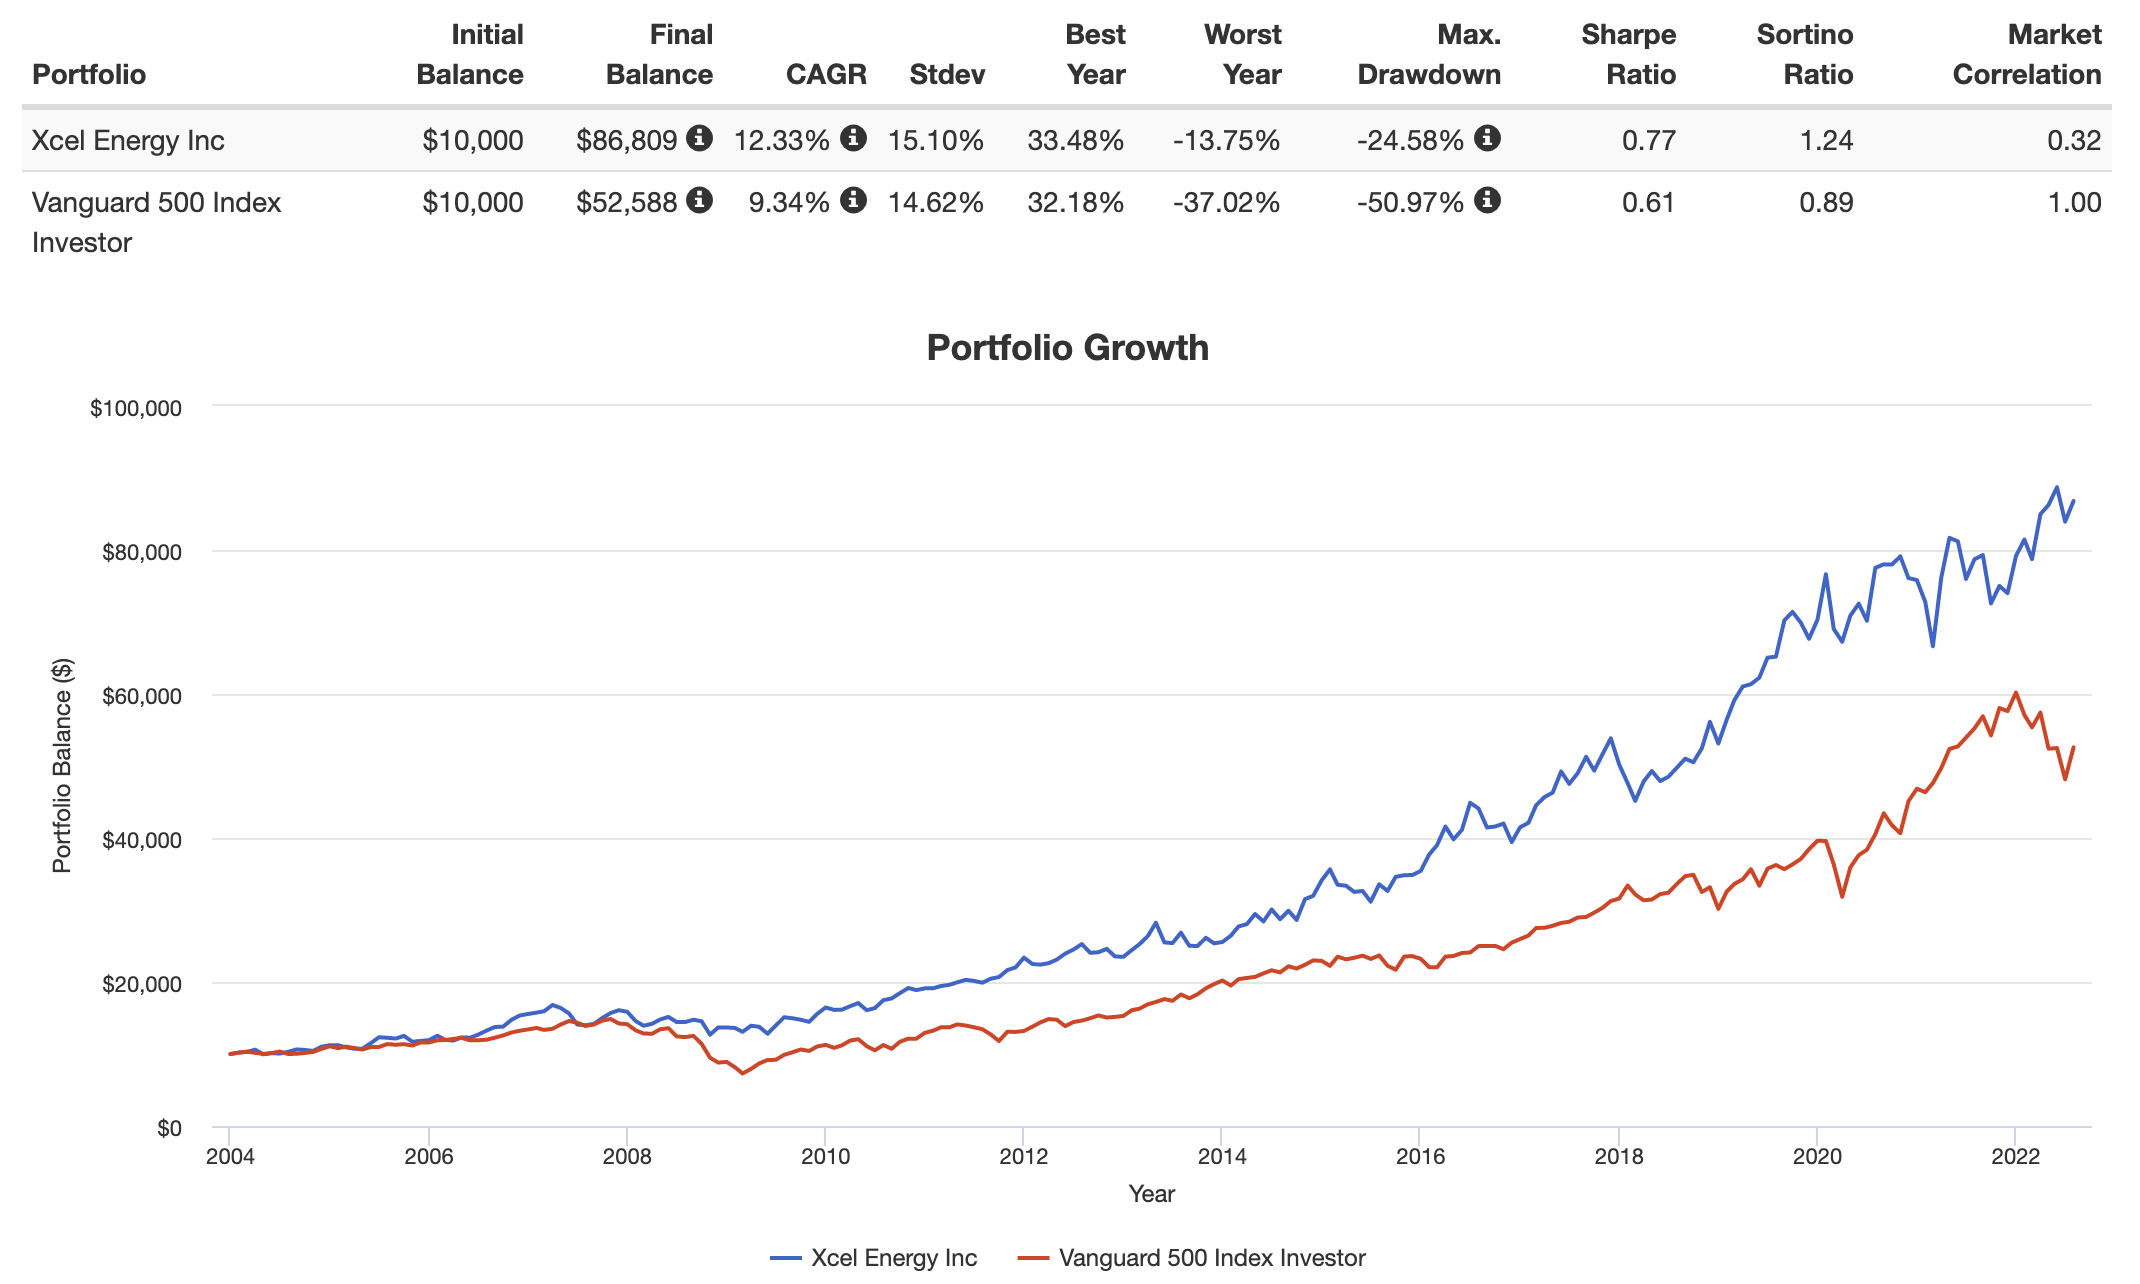
It’s also important to mention that not a lot has changed in the past five years. Over the past five years, Xcel Energy has returned 12.1% per year. While this is below the 12.7% performance of the S&P 500, it comes with an equal standard deviation of 17.3%. Moreover, this period included the pandemic and the post-pandemic surge in stocks led by tech and related. Yet, investors in Xcel were still in a terrific position.
Why?
Because of downside protection.
Low-volatility dividend strategies not only benefit from the fact that companies that distribute a dividend (let alone raise it consistently) are trusted because of solid financial fundamentals, but also because of downside protection. Stocks that outperform during bear markets do not need to keep up with the market during every bull market. Downside protection goes a long way on a long-term basis, even if it doesn’t always feel that way.
The chart below shows that XEL has outperformed the S&P 500 in both the Great Financial Crisis and the current drawdown. It didn’t always keep up in bull markets, but even in most bull markets, the stock returned close to 20% in certain years.
Portfolio Visualizer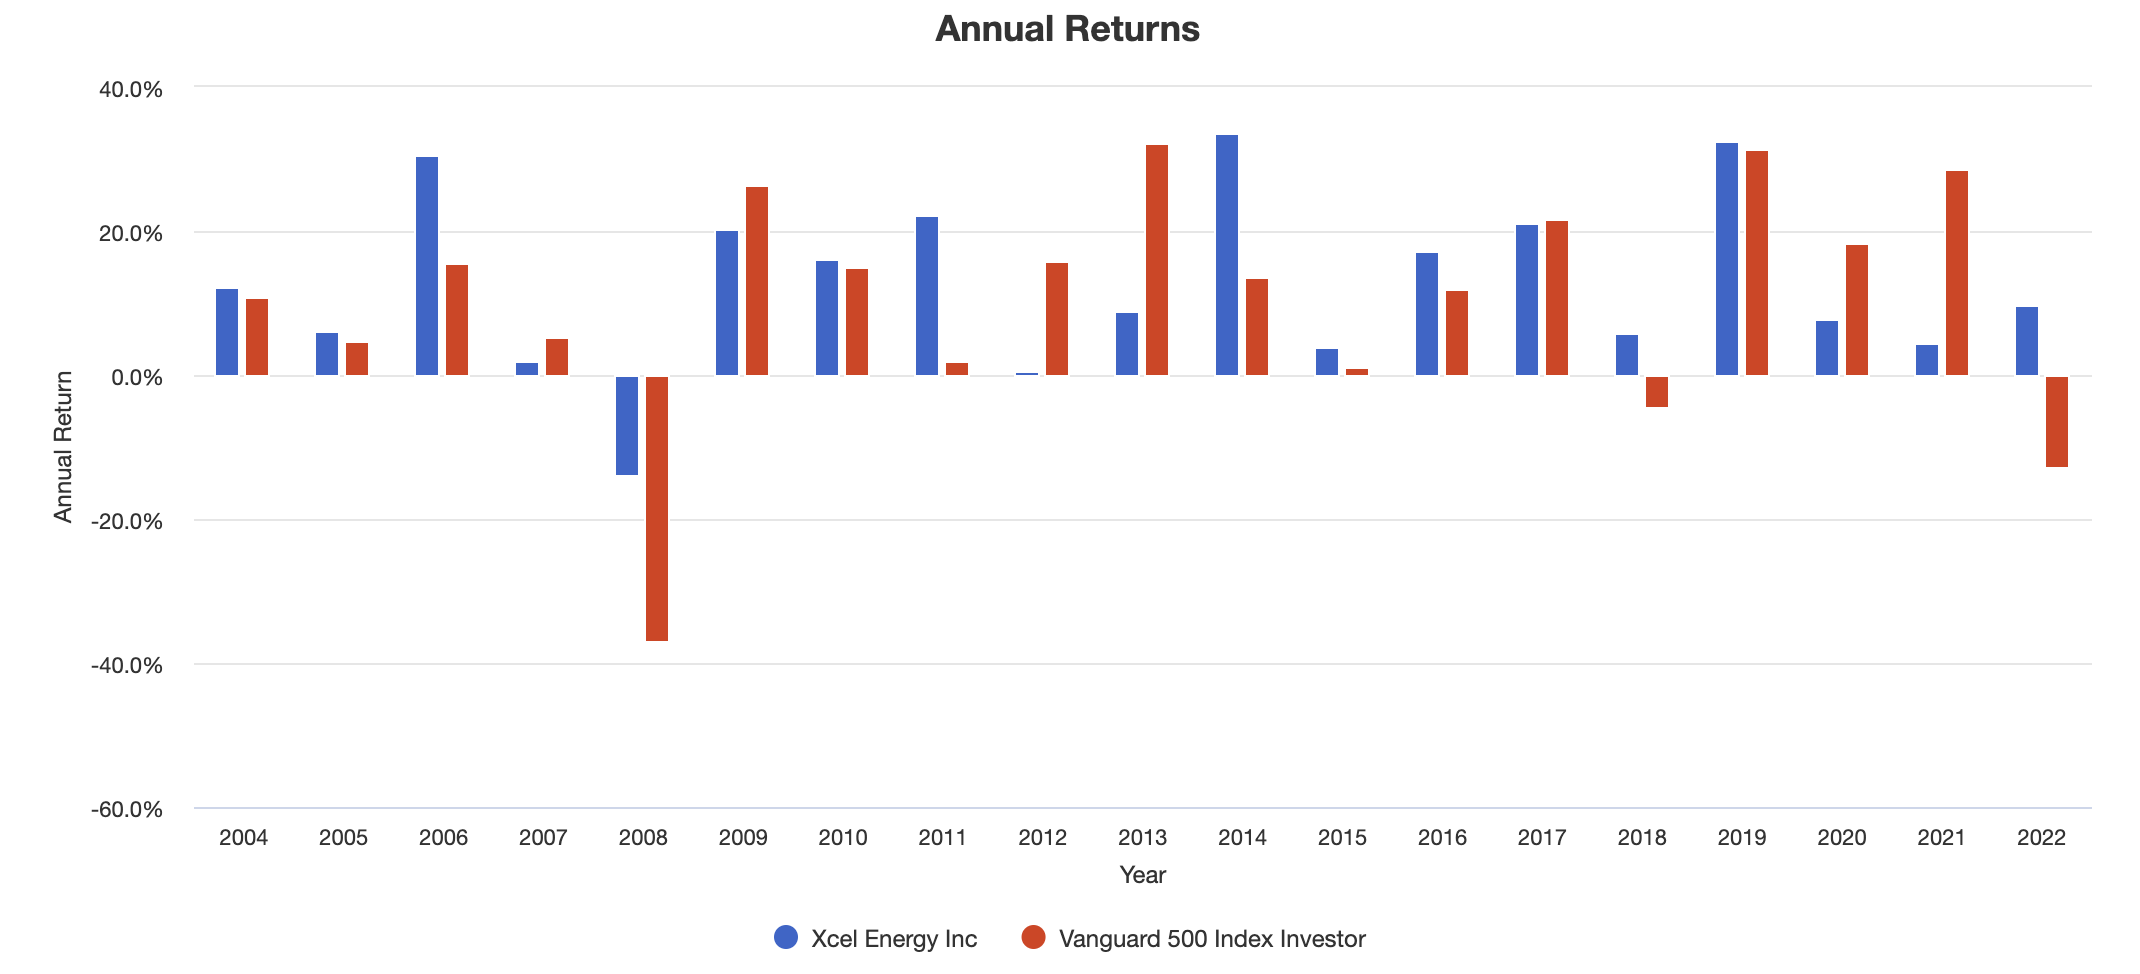
Now, let’s take a closer look at the dividend.
The Dividend
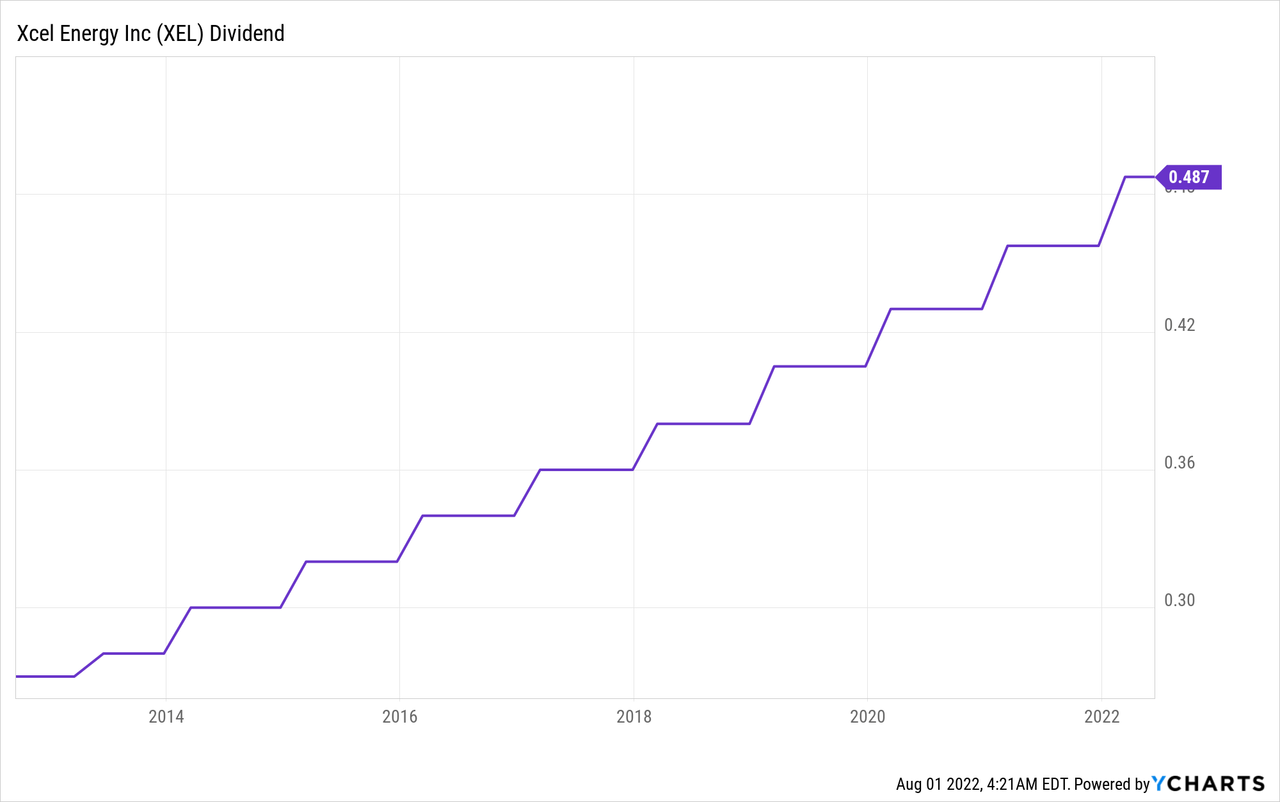
Xcel pays a quarterly dividend of $0.4875 per share. This translates to $1.95 per year. That’s 2.7% of the current stock price.
It’s roughly 30 basis points below the Utilities Select Sector ETF (XLU) yield of 3.0% and not really a yield that people consider to be “high yield”. Especially because people tend to buy utilities for their yield.
This also explains why XEL scores relatively low on the Seeking Alpha dividend scorecard (relative to its peers) when it comes to its yield. A big fat D plus.
Seeking Alpha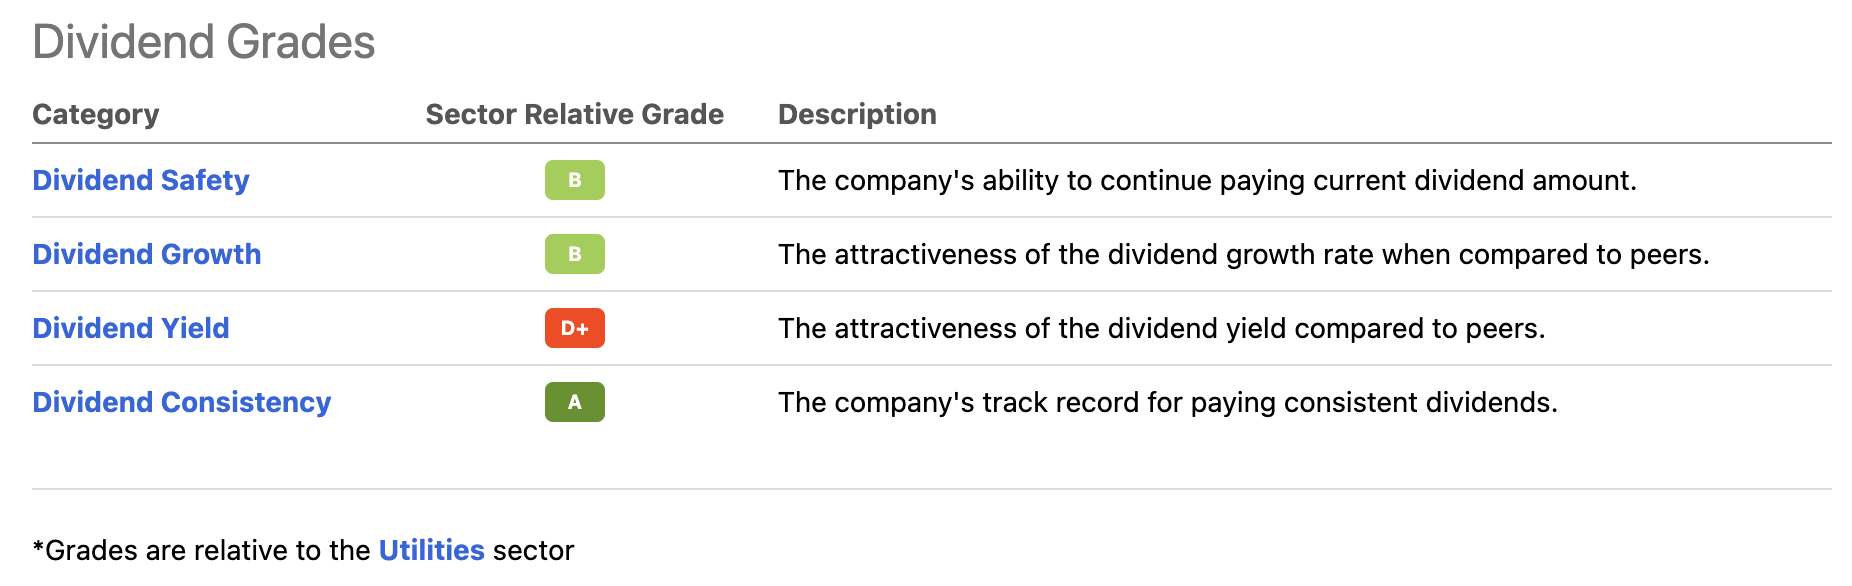
So far, that was the bad news. Not only is XEL a long-term outperformer as I explained in the first half of this article, but the company is also scoring high on dividend growth.
Over the past 10 years, the average annual dividend growth was 6.1%. The most recent hike was announced on February 23, when the company hiked by 6.6%.
One year prior to that, the hike was 6.4%.
Overall, these numbers are satisfying and they are well within the company’s own 5-7% annual dividend growth target range.
You probably noticed it already, but the company’s dividend growth expectations are equal to EPS growth expectations: 5-7% long-term annual growth.
Between 2005 and 2013 the company hiked its dividend by a mere 3.4% per year. This changed as XEL was in a good position to generate more than 6% annual average EPS growth. Hence, management hiked to an average annual rate of 6.4%.
Xcel Energy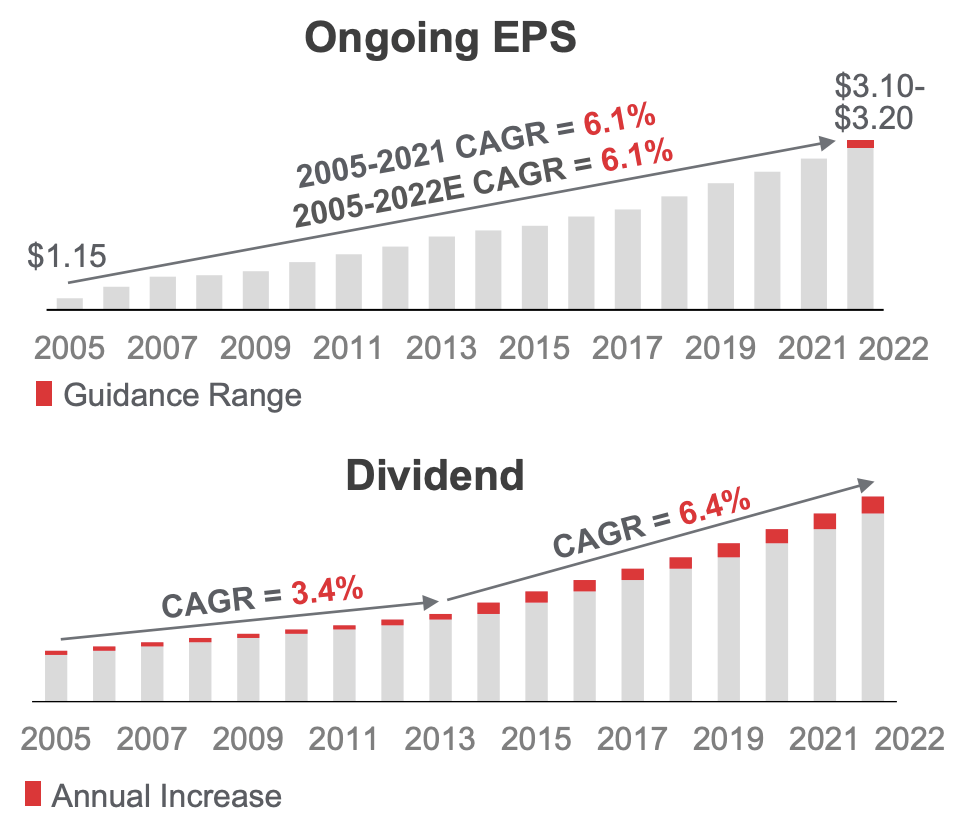
With that in mind, we need to talk about the balance sheet, the dividend gap, and renewables.
The Balance Sheet & Renewables
Like all major utilities, XEL is failing to use free cash flow to distribute its dividend.
For example, this year, XEL is expected to generate $3.8 billion in cash from operations. Capital expenditures, however, will be close to $5.3 billion, which means the company needs money to fund CapEx – let alone pay a dividend.
Normally, this would be a huge red flag. Yet, it’s not.
Like all major utilities, XEL is lowering its carbon footprint to be aligned with the Paris Agreement. This means reducing carbon emissions by 50% in 2021 (versus 2005), 80% in 2030, and 100% in 2050.
In 2005, XEL generated 56% of its energy from coal. One can imagine how much capital is needed to turn that around.
In 2025, the company wants to reduce coal to 12%, keep 23% natural gas exposure, 12% nuclear, and boost renewables to 53%.
The chart below shows that annual CapEx is expected to remain close to $5.0 billion per year. That’s up from roughly $3.5 billion prior to the pandemic.
TIKR.com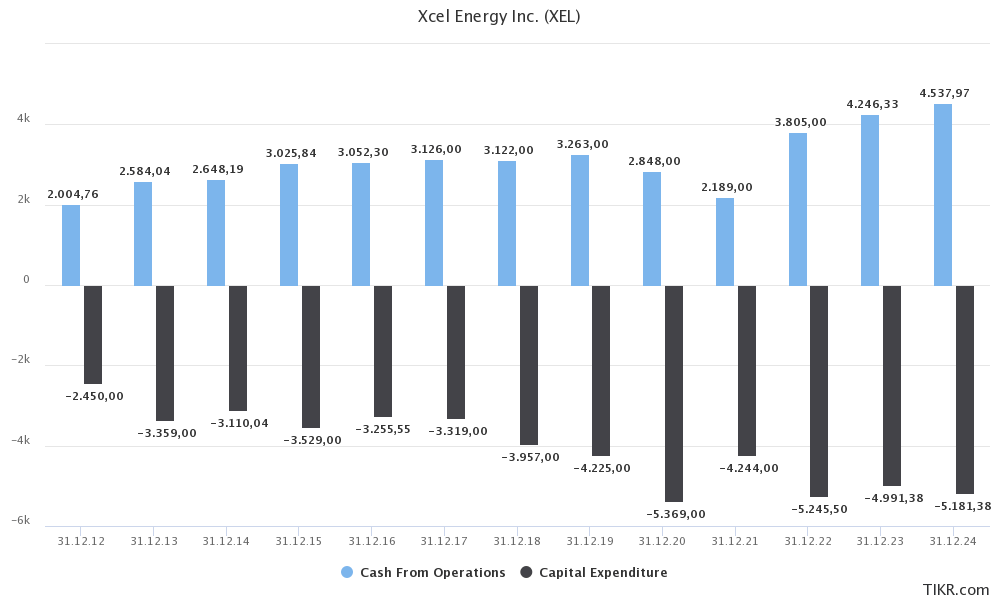
Before I continue, I believe that the company will encounter higher than expected costs in the years ahead. I would not be surprised if CapEx were to exceed $5.0 billion next year as Xcel is struggling with the implementation of new renewable projects.
The Wall Street Journal included XEL comments in a recent article discussing the energy transition in the USA, it highlighted its $26 billion investment plan between 2022 and 2026:
Xcel Energy Inc., a Minneapolis-based utility company serving parts of eight Western and Midwestern states, is wrestling with slowdowns on solar projects. Those include contracts with solar farms in Colorado that were scheduled to be online in late 2022 and early 2023.
And…
Xcel CEO Bob Frenzel said higher energy prices pose near-term challenges for the company and its customers, but he expects they will fall with time. The war in Ukraine, the pandemic and supply chain snarls, he added, would have been easier to manage if they didn’t converge.
I also believe that the availability of materials will play a major role. If metal prices remain high, we could see much higher expenses on top of potential delays related to other factors.
To go back to my earlier comments, the funding gap is leading to new debt. In 2016, XEL had $14.8 billion in net financial debt (gross debt minus cash). Next year, it’s expected to be $26.8 billion. It will reach $30 billion soon.
However, at the very bottom of the chart below (my apologies for the poor visualization), we see that the book value per share (book value equity per share), is rising consistently. In 2016, it was $21.71. Next year, it will be close to $32. This means that the company isn’t just borrowing money, it is generating actual value with it. Also on a per share basis, to account for dilution. If this were not the case, I wouldn’t touch XEL with a ten-foot pole.
TIKR.com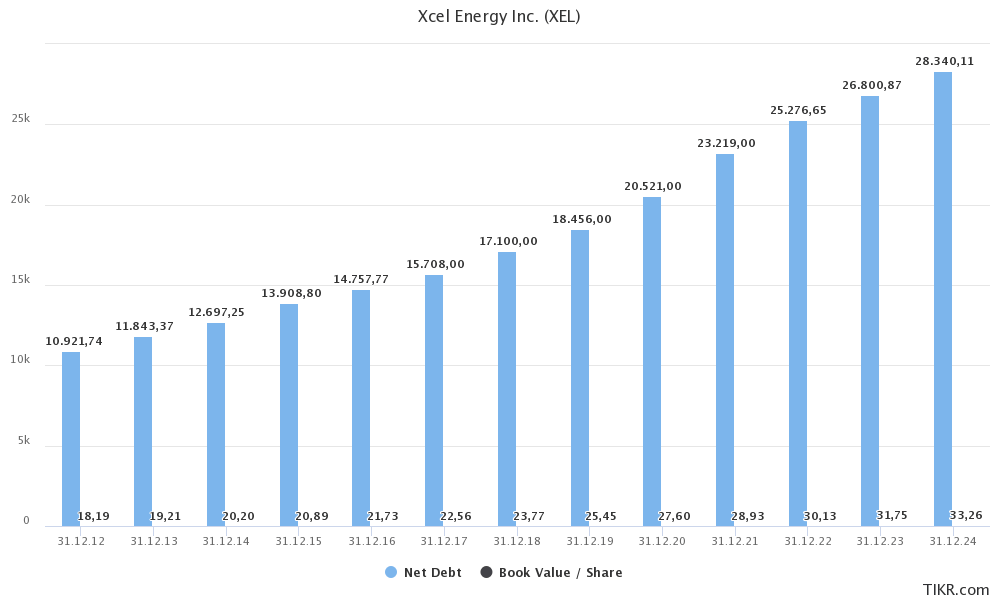
Moreover, the company is expecting to lower its leverage ratio to 4.7x by 2026. That’s down from 5.0x in 2022. That’s not a lot, but it is impressive given that neither dividend growth nor investments in renewables are expected to slow (new debt).
Also related, the company has a stellar credit rating, which also goes for all of its subsidiaries.
Xcel Energy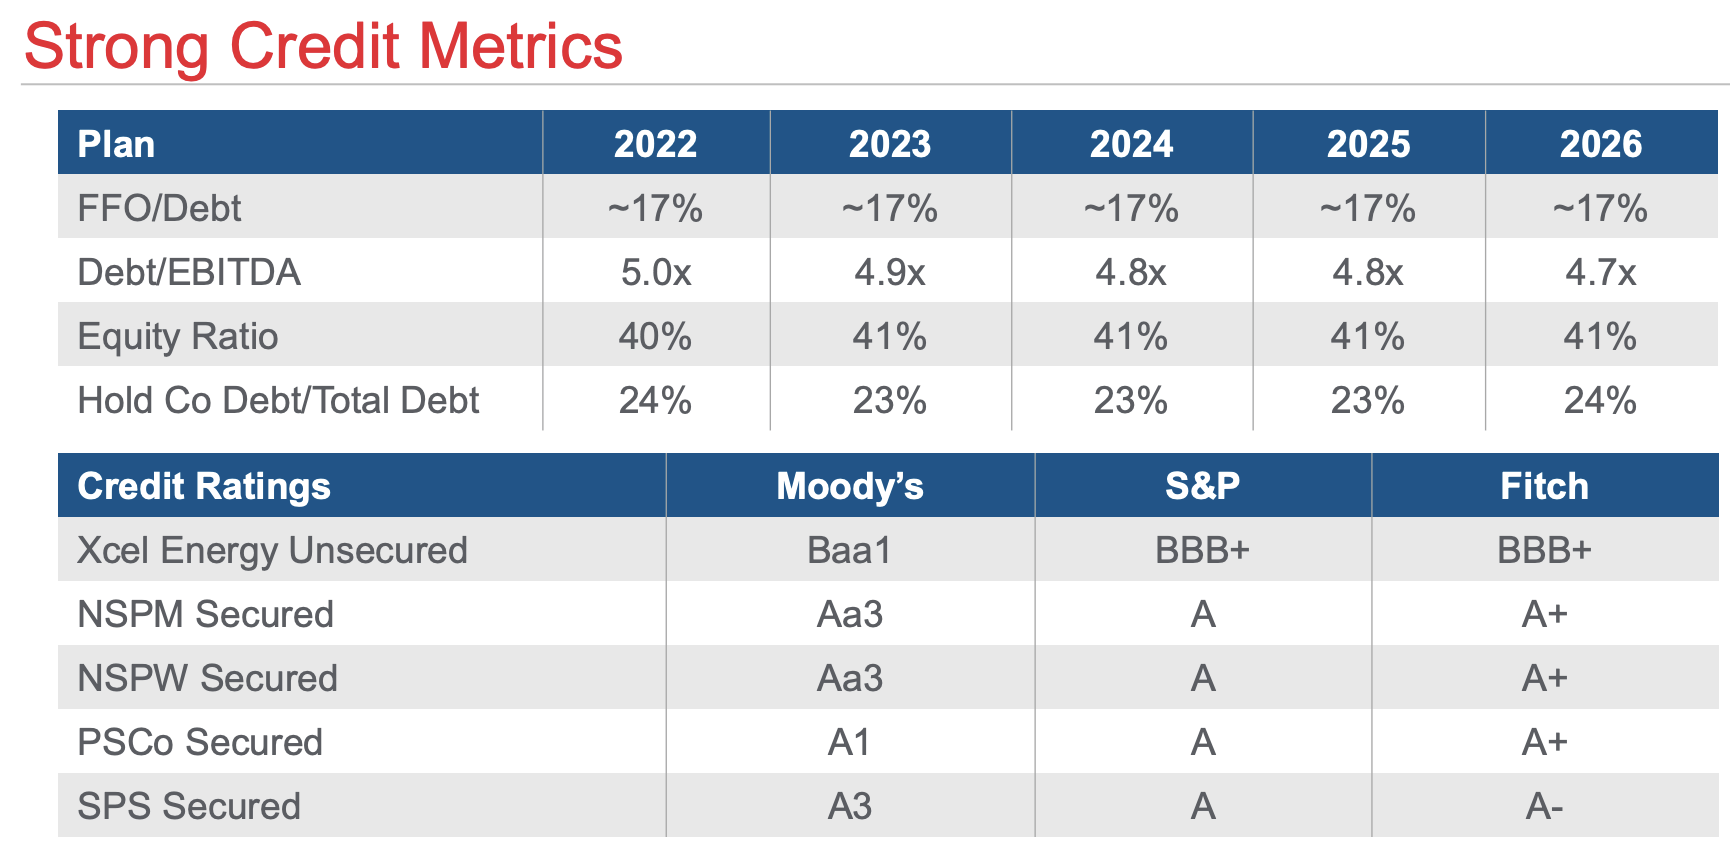
So, what about the valuation?
Valuation
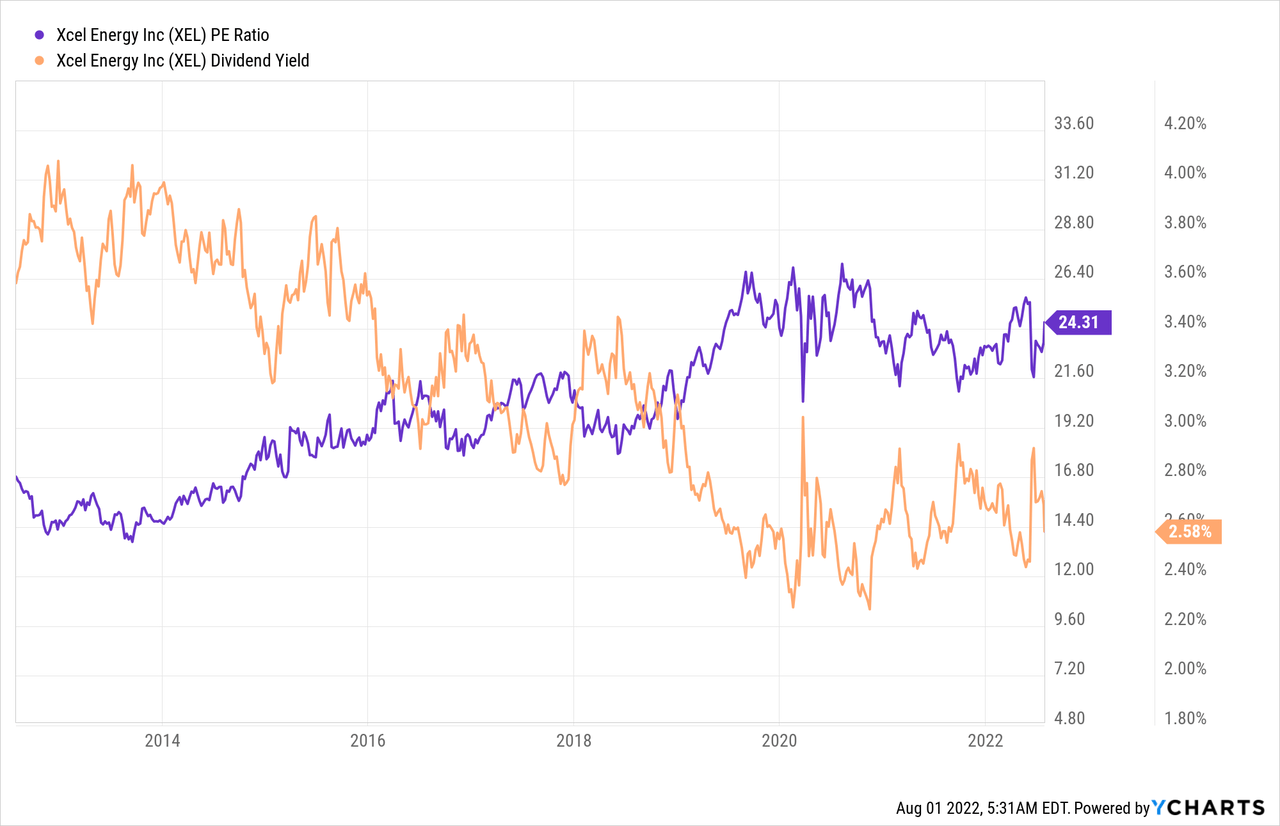
Xcel Energy is trading at 23.0x 2022 EPS and 21.6x 2023 EPS.
TIKR.com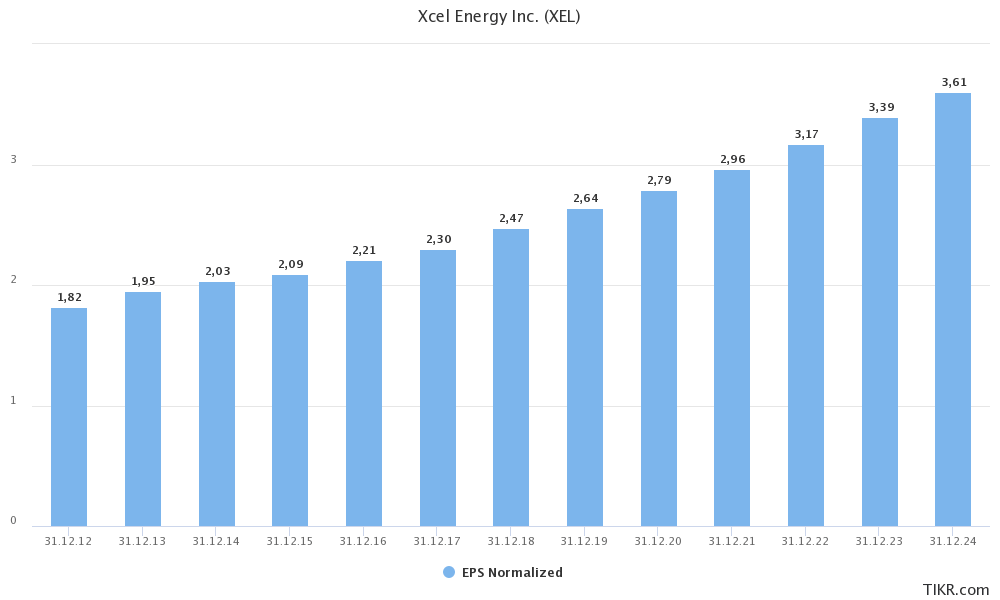
This valuation isn’t cheap or expensive. If anything, it’s “fine”. The valuation is close to the lower bound of the post-pandemic range – (post 2Q20). The same goes for the dividend yield, which is close to the higher bound of the yield range in that period.
Moreover, the chart below shows two indicators. The black line displays the ratio between XEL and the S&P 500, excluding dividends. The blue line shows the inverted 10-year government bond yield. If the yield falls, this line rises.
In light of ongoing economic struggles and the changing narrative that the Fed may take the foot off the gas pedal in 2023, and is in favor of lower rates. If this indeed happens, investors will increasingly focus on quality yields. That’s where XEL shines, especially because of its conservative business (utilities).
TradingView (Black = XEL/SPY, Blue = 1-US10Y)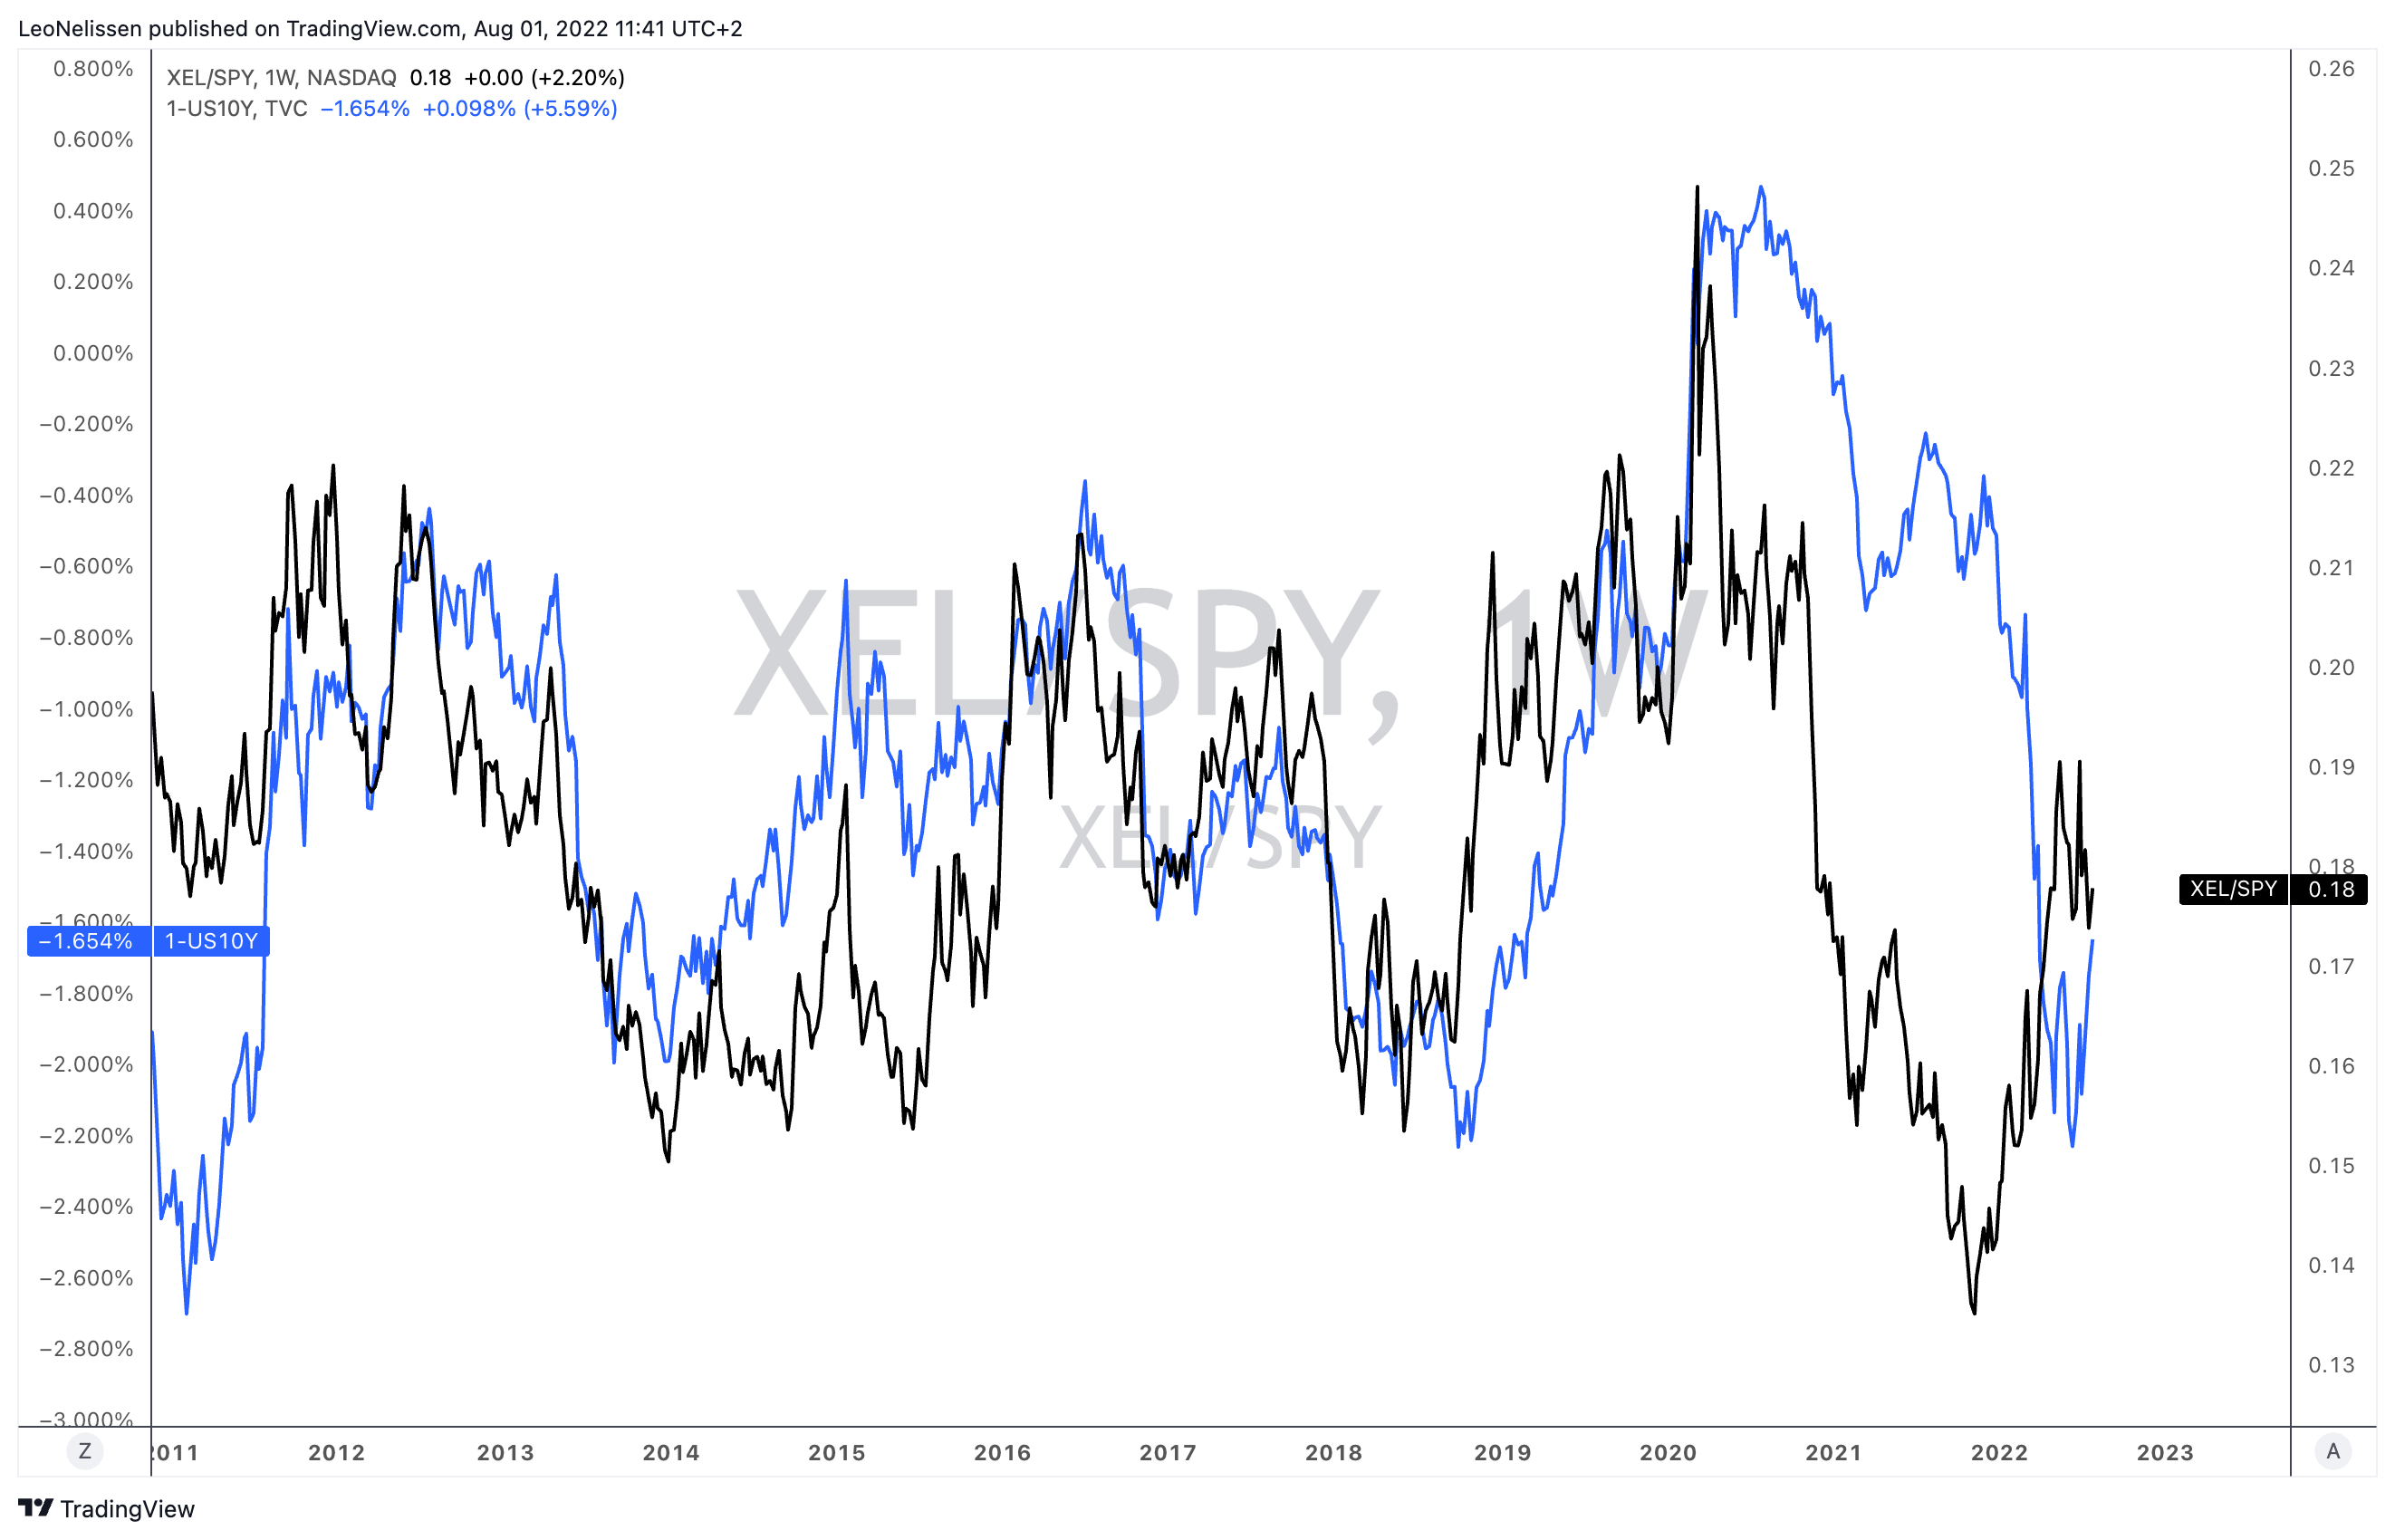
I’m bringing this up because I expect XEL to outperform the S&P 500 on a long-term basis and I do not expect the current valuation to come down a lot. This is OK, as the valuation is fine for long-term investments, in my opinion.
Takeaway
“Boring” isn’t always a bad thing in investing. I believe that XEL is one of the best examples of a boring stock that does exactly what most investors are looking for in a dividend (growth) stock. The company has a dominant position in the US utility industry, it has a healthy balance sheet, fantastic financials that come with satisfying long-term growth, as well as a decent dividend yield that has been raised by more than 6% over the past 10 years.
Moreover, XEL comes with (expected) long-term outperformance thanks to low volatility, downside protection during recessions, and more than decent performances during bull markets.
While the yield below 3% may be a dealbreaker for the “typical” yield-seeking investor in this industry, I think the stock is a good buy for both yield-seeking and dividend growth investors as it comes with a great (expected) total return down the road. Sometimes that’s better than only focusing on high yield.
(Dis)agree? Let me know in the comments!
Be the first to comment