

AndreyPopov/iStock via Getty Images
Those benefiting from speculative bubbles have powerful incentives to deny the bubble can burst. Rationalizations abound as bubbles inflate, and the continued ascent of speculative bets seems to “prove” the rationalizations are correct.
But bubbles arise from speculative excesses, and once these reach extremes and reverse, bubbles burst and all the self-serving rationalizations are revealed as rationalizations.
Let’s start with some caveats I’ve already covered in “Is Housing a Bubble That’s About to Crash?“:
- Housing is local, so there may be locales where prices are still rising due to unquenchable demand and low supply and other places where demand is low and supply ample where prices plummet.
- The wealthiest 1% on a global scale is a very large number, and wealthy buyers seeking a safe haven in North America come with cash and don’t care about mortgage rates. Desirable enclaves could see home prices climb even as the national bubble pops. (World population: 7.8 billion X 1% = 78,000.000 or roughly 30,000,000 households.)
- Wealthy investors are holding a large number of dwellings off the market as investments. These empty units consequentially reduce the supply in desirable locales, and create an artificial scarcity that would not exist if central banks hadn’t inflated the Everything Bubble.
- The number of homes bought by corporations has soared. This has driven demand in many markets, but if rents dive due to recession, corporate buyers become corporate sellers.
With those caveats out of the way, let’s look at the foundation of home ownership for the bottom 95%: income and mortgage rates. As mortgage rates rise, more income must be devoted to the monthly payment. If household income lags the increase in housing prices, price eventually exceed what the bottom 95% can afford once mortgage rates rise.
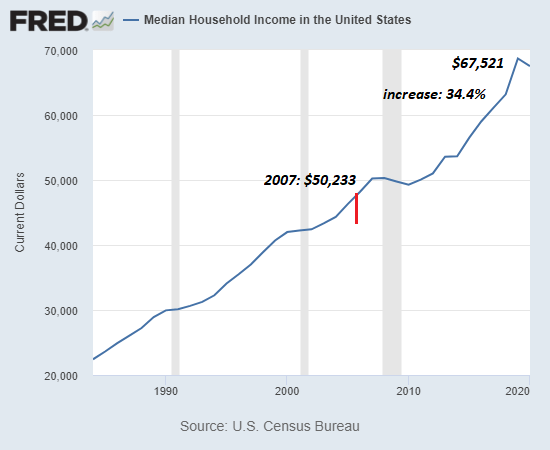
The first chart below is the national Case-Shiller Index. Note that housing prices have soared 63.6% since the previous housing bubble peak in 2007, outpacing inflation (up 41%) and median household income (up 34%), the second chart.
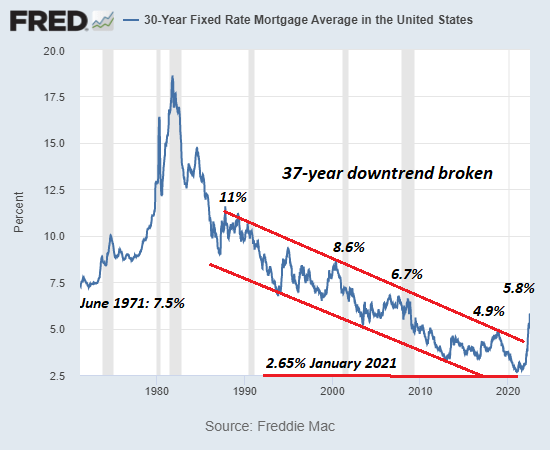
The third chart shows mortgage rates have broken out of a 37-year downtrend. It is noteworthy that mortgage rates were in the 7-8% range in previous economic booms (late 1960s, the 1990s), but now 6% mortgages are considered the end of the world. That suggests a dependence on cheap money / low rates is the primary support of the current bubble rather than an organic economic expansion such as we enjoyed in the 1990s.
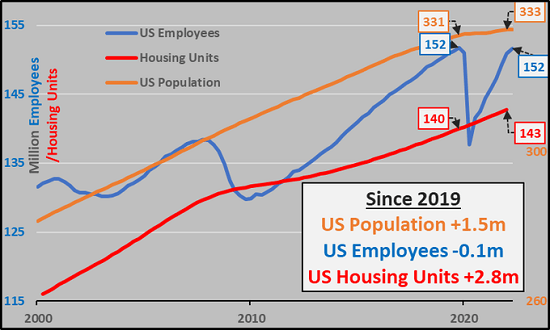
Courtesy of my colleague CH at Econimica, the next three charts shed light on housing fundamentals. The first Econimica chart shows the rate of growth in population, employment and housing units. The U.S. population increased by a scant 1.5 million since 2019, the number of employed was flat and the number of housing units increased by 2.8 million.
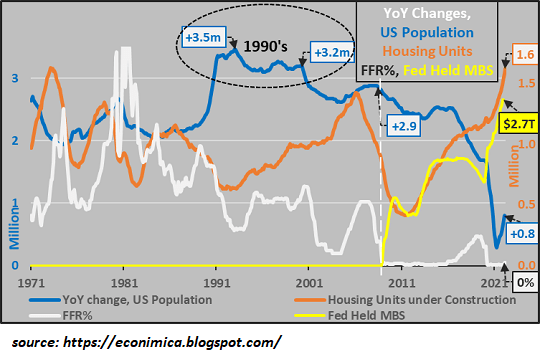
The second Econimica chart shows the Fed Funds Rate (FFR), the staggering increase of mortgage-backed securities purchased by the Federal Reserve to keep mortgage rates low (from zero to $2.7 trillion), declining rate of population growth year-over-year and the remarkable rise in the number of housing units under construction.
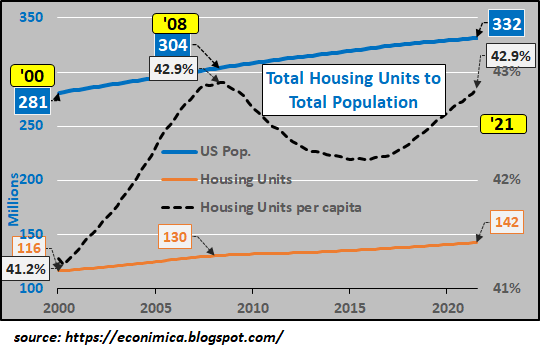
The third Econimica chart shows housing units per capita (per person), which has reached the same level as the previous housing bubble peak in 2007-08.
As CH observed: “Housing units (per capita) against US population should suggest not a shortage of housing units but a surplus of dollars with which to buy them.”
Putting this all together, it’s clear that the source of the current housing bubble is the explosion of financial speculation fueled by central bank policies. Housing prices that far exceed the growth of household incomes are not sustainable, and neither are housing prices that rose solely on the basis of unprecedentedly low mortgage rates.
It’s also clear that those with access to the (temporary) wealth created by central banks’ trillions in new credit have poured many of these “free money” trillions into housing globally as a hedge against inflation, a safe-haven investment or, for corporations, for rental income. All of these factors exacerbate an artificial demand and equally artificial scarcity.
As I’ve noted in the past, bubbles typically manifest a symmetry in their ascent and decline. All the gains are eventually reversed, and if the system is destabilized by the bubble bust, then prices drop far below previous lows.
Setting aside rationalizations in favor of fundamentals, the housing bubble’s bust is already baked in.
S&P/Case-Shiller U.S. National Home Price Index Median Household Income In The US 30-Year Fixed Rate Mortgage Average In The US Rate Of Growth In US Population, Employees, Housing Units Since 2019 (Economica) Fed Funds Rate; Fed-Held MBS; Population Growth Rate YoY; Housing units under construction (Econimica) US Population; Housing Units; Housing Units Per Capita (Econimica)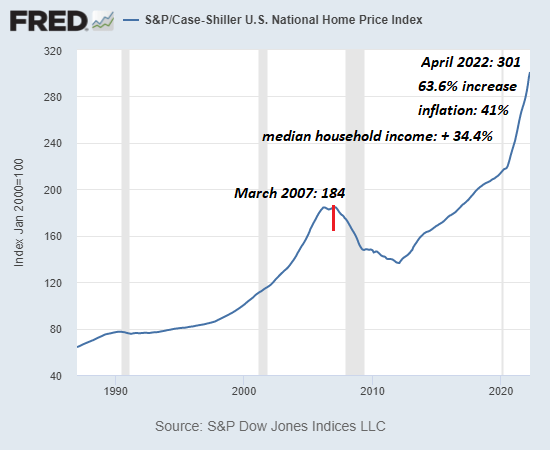
Editor’s Note: The summary bullets for this article were chosen by Seeking Alpha editors.
Be the first to comment