

Alfribeiro/iStock via Getty Images
Introduction
The agriculture bull market is returning. Crop prices are rising despite good news from Ukraine when it comes to releasing much-needed exports as weather headwinds persist on top of already high demand and tight supplies. Moreover, energy prices are rising again, providing more upside for fertilizers. That’s where my favorite fertilizer company, the Mosaic Company (NYSE:MOS), comes in. Even though it missed earnings estimates by a somewhat wide range, it did not keep investors from pushing the stock up, providing a higher than 20% return since my article was published in July. In this article, we will go over recent developments, the company’s valuation, and why I believe that there’s a lot of room left for capital gains.
Agriculture Fundamentals Remain Strong
Let’s start with the company’s earnings, which were released on August 1.
The company did $5.37 billion in revenue, which is an improvement of 91.8% versus 2Q21, yet it was $250 million below estimates.
Mosaic Company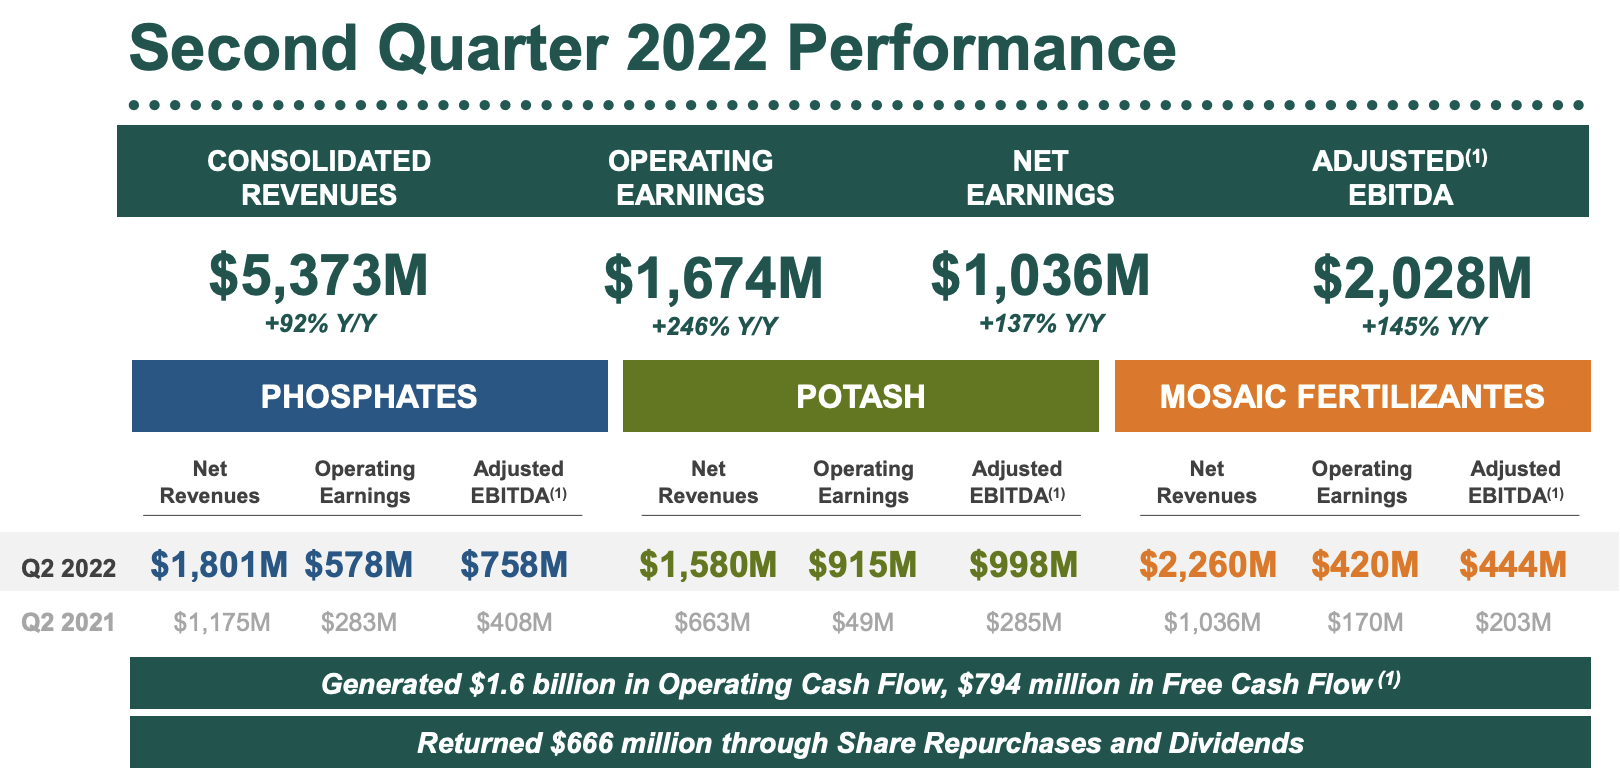
Adjusted EPS came in at $3.63 (some websites say $3.64), which missed estimates by $0.36. As the overview below shows, the company missed big on key numbers like phosphates where it did $642 million in gross profit. That’s almost 30% lower than expected.
ConsensusGurus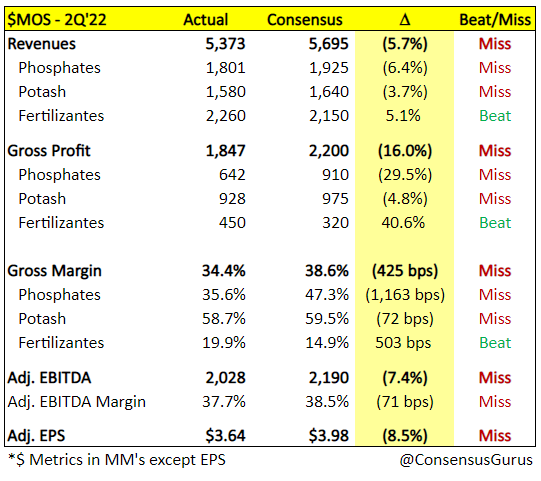
However, that’s where the bad news ends. Investors simply shrugged it off as expectations being too high as the stock closed the day after earnings with a rally of almost 6% from the daily lows. What followed was more upside to a current share price of close to $54.
FINVIZ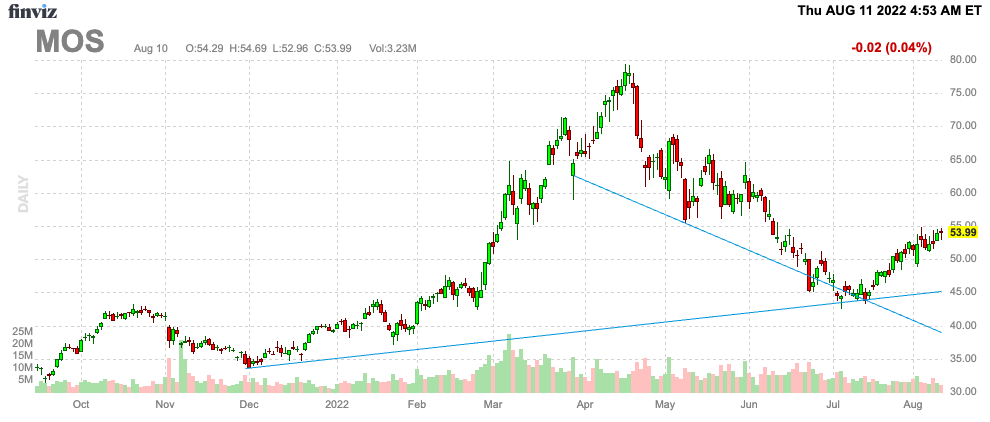
As I discussed in prior agriculture articles, the market is forward looking. And what investors are seeing is a tight market for fertilizer, crop supply, energy, and related things.
Starting with the big picture, the global food supply is tight and expected to remain tight. As I discussed in a recent Deere & Company (DE) article, the OECD projects an annual increase in global agricultural production of 1.1% per year in its 363-page long 2022-2031 outlook.
The problem is that demand is expected to grow by 1.4% per year. According to the OECD:
Global food consumption, which is the main use of agricultural commodities, is projected to increase by 1.4% p.a. over the next decade, and to be mainly driven by population growth. Most additional demand for food will continue to originate in low- and middle-income countries, while in high-income countries it will be constrained by slow population growth and a saturation in the per capita consumption of several food groups.
Moreover, and using corn as an example, we’re increasingly encountering periods where usage is outpacing production. This year will be very close, while 2018 through 2020 all saw lower production than demand.
CME Group
The same is happening to wheat, which enjoyed a number of years with strong supply and underperforming demand prior to the pandemic. That ended in 2020.
CME Group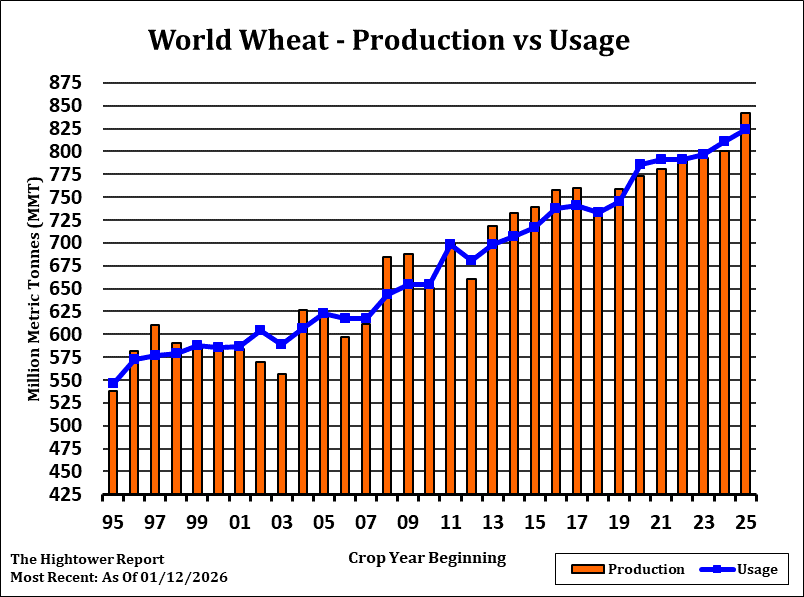
Based on this context, I just read an article on the website of the IEA, the International Energy Agency – easily confused with the EIA (U.S. Energy Information Administration).
The title was “How the energy crisis is exacerbating the food crisis”.
It highlights issues that I haven’t stopped talking about since 2020: the energy and agriculture correlation.
The chart below shows the correlation between ICE Brent crude oil and CBOT corn futures (orange). The correlation isn’t 100%, but the bigger picture shows a strong relationship.
TradingView (Black = ICE Brent, Orange = CBOT Corn)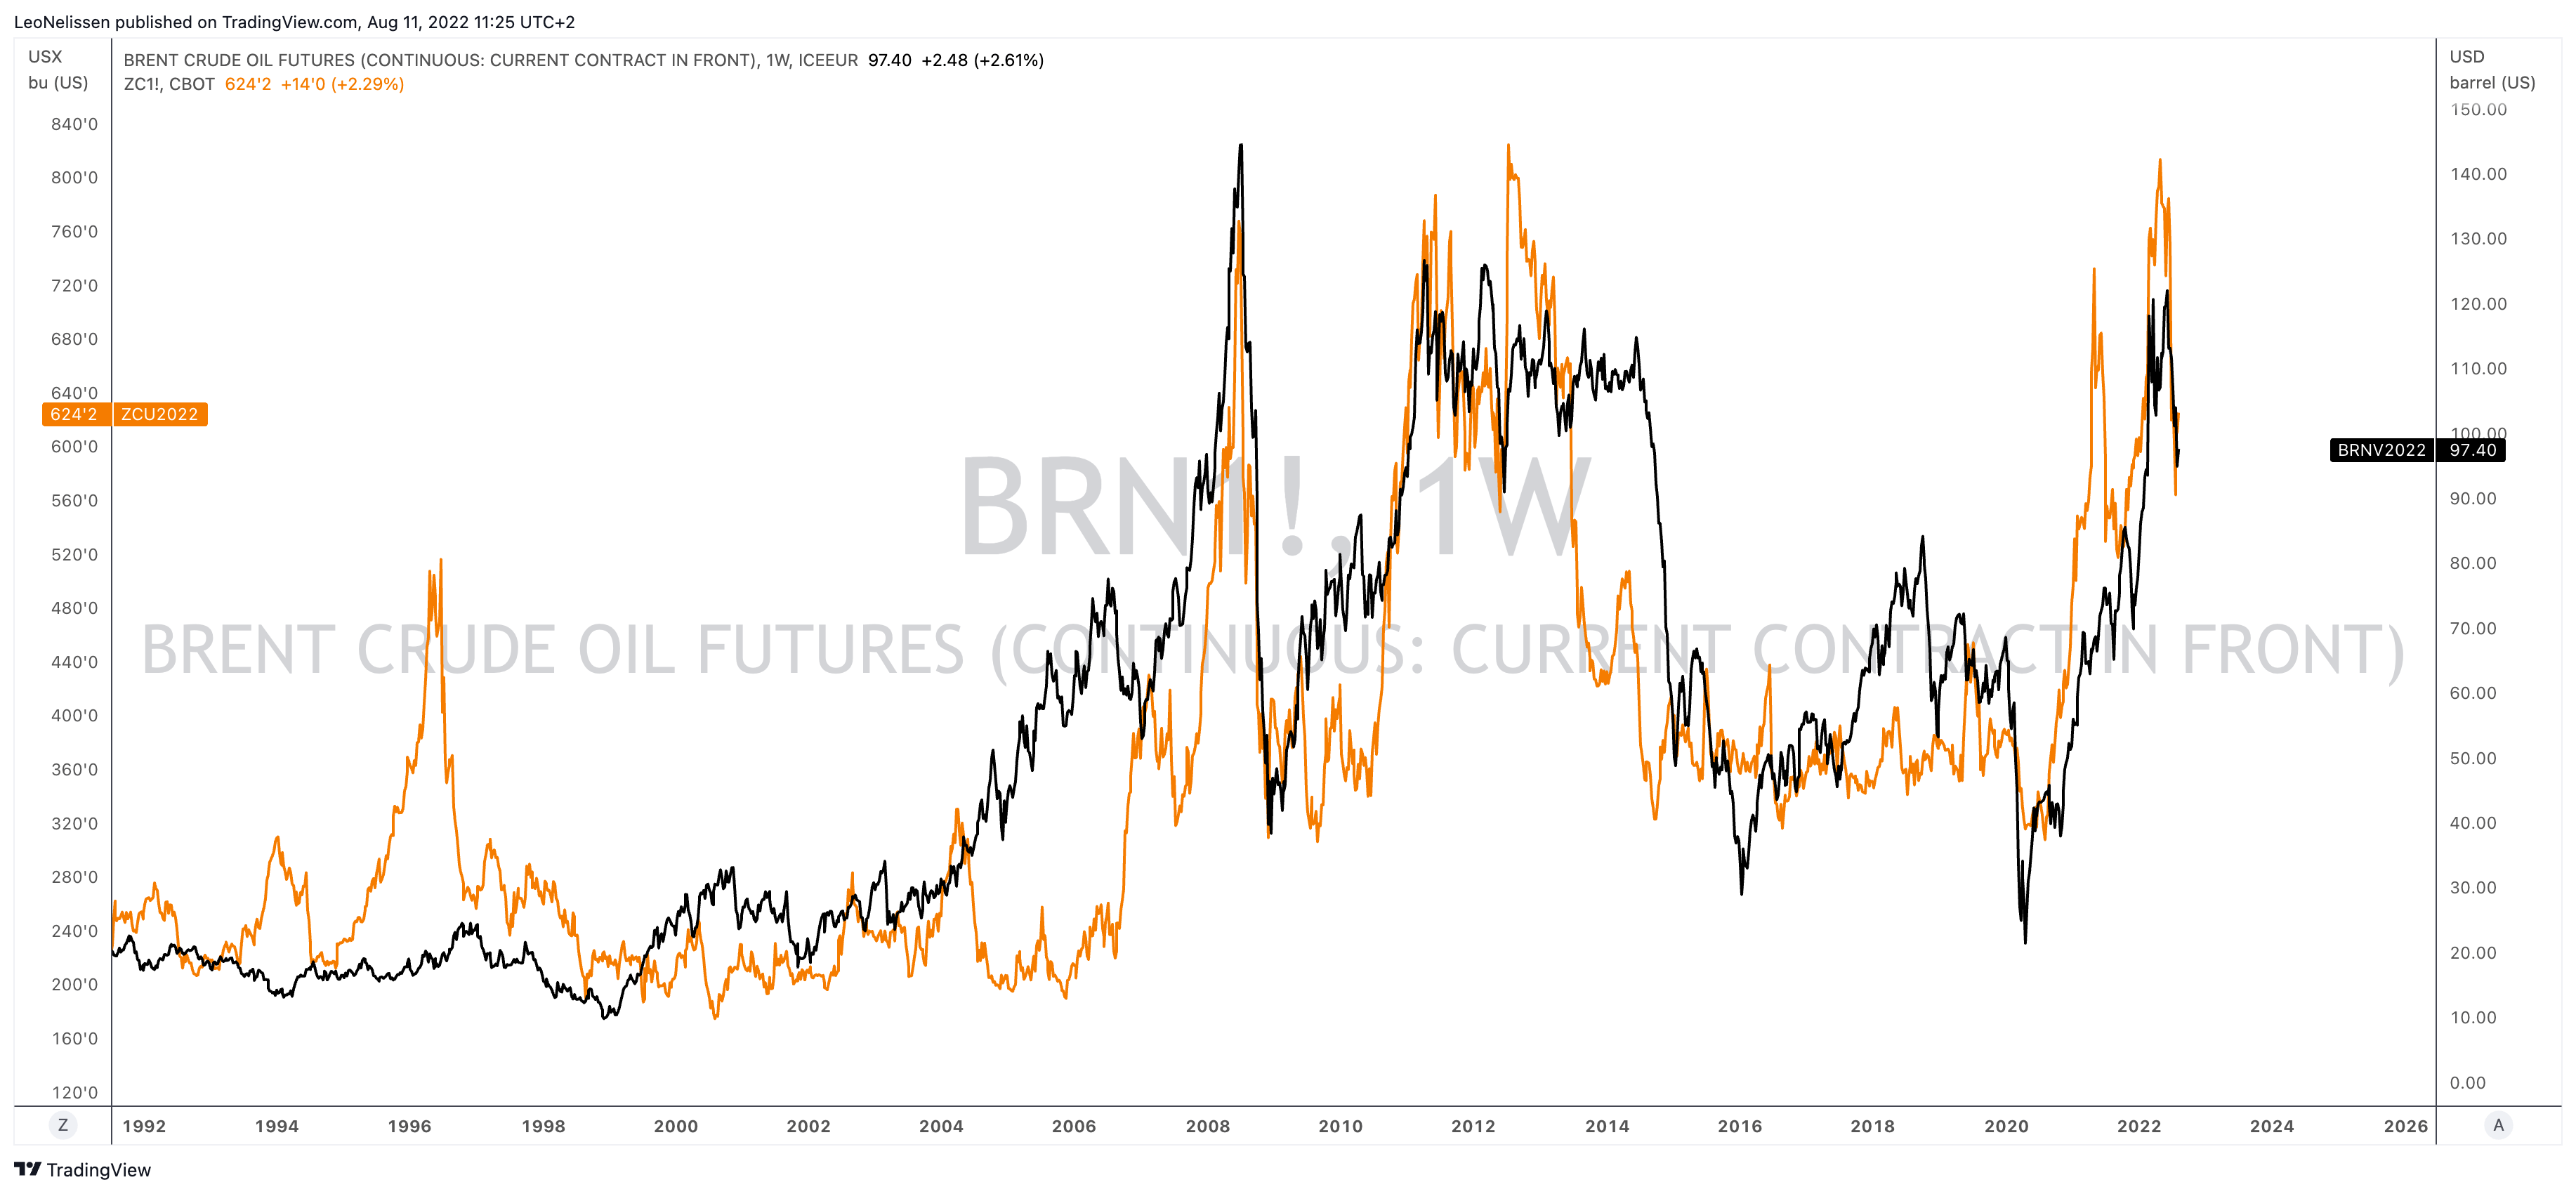
Again using corn as an example, it’s fair to say that agricultural prices trade very close to production costs. That happens in markets with high competition. The supply/demand balance is almost perfect.
A Teucrium chart shows that agriculture markets usually trade close to cost unless a major supply shock occurs.
Teucrium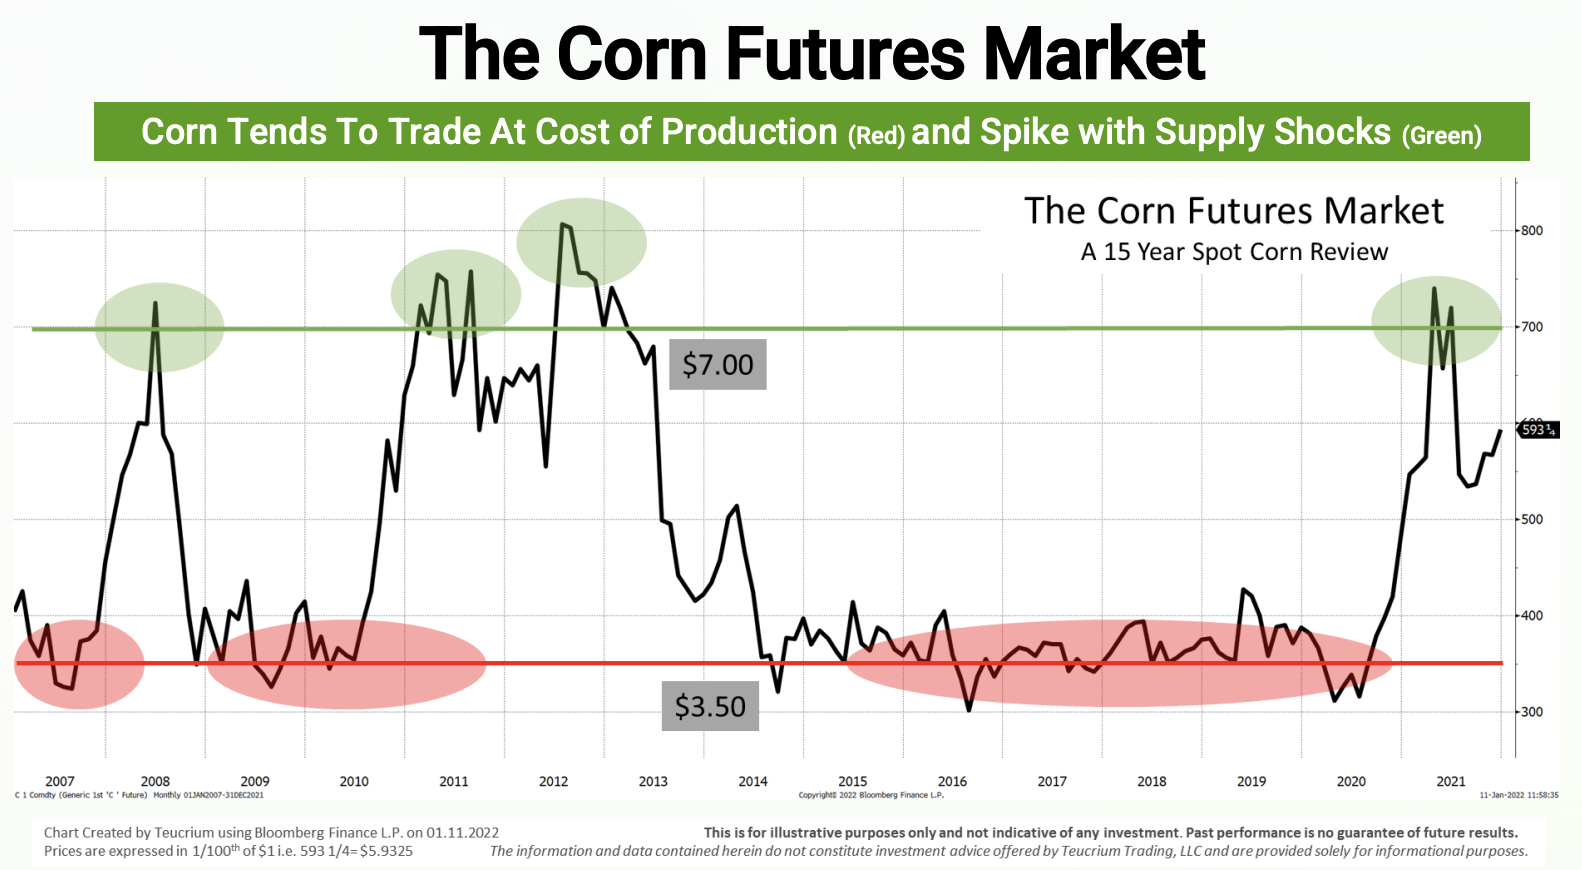
And speaking of supply shocks, corn crop conditions in the US are falling off a cliff. In a very crucial stage of growth, plants are experiencing bad weather conditions, resulting in lower crop conditions than 2021 – on pace to be worse than 2019.
USDA/NASS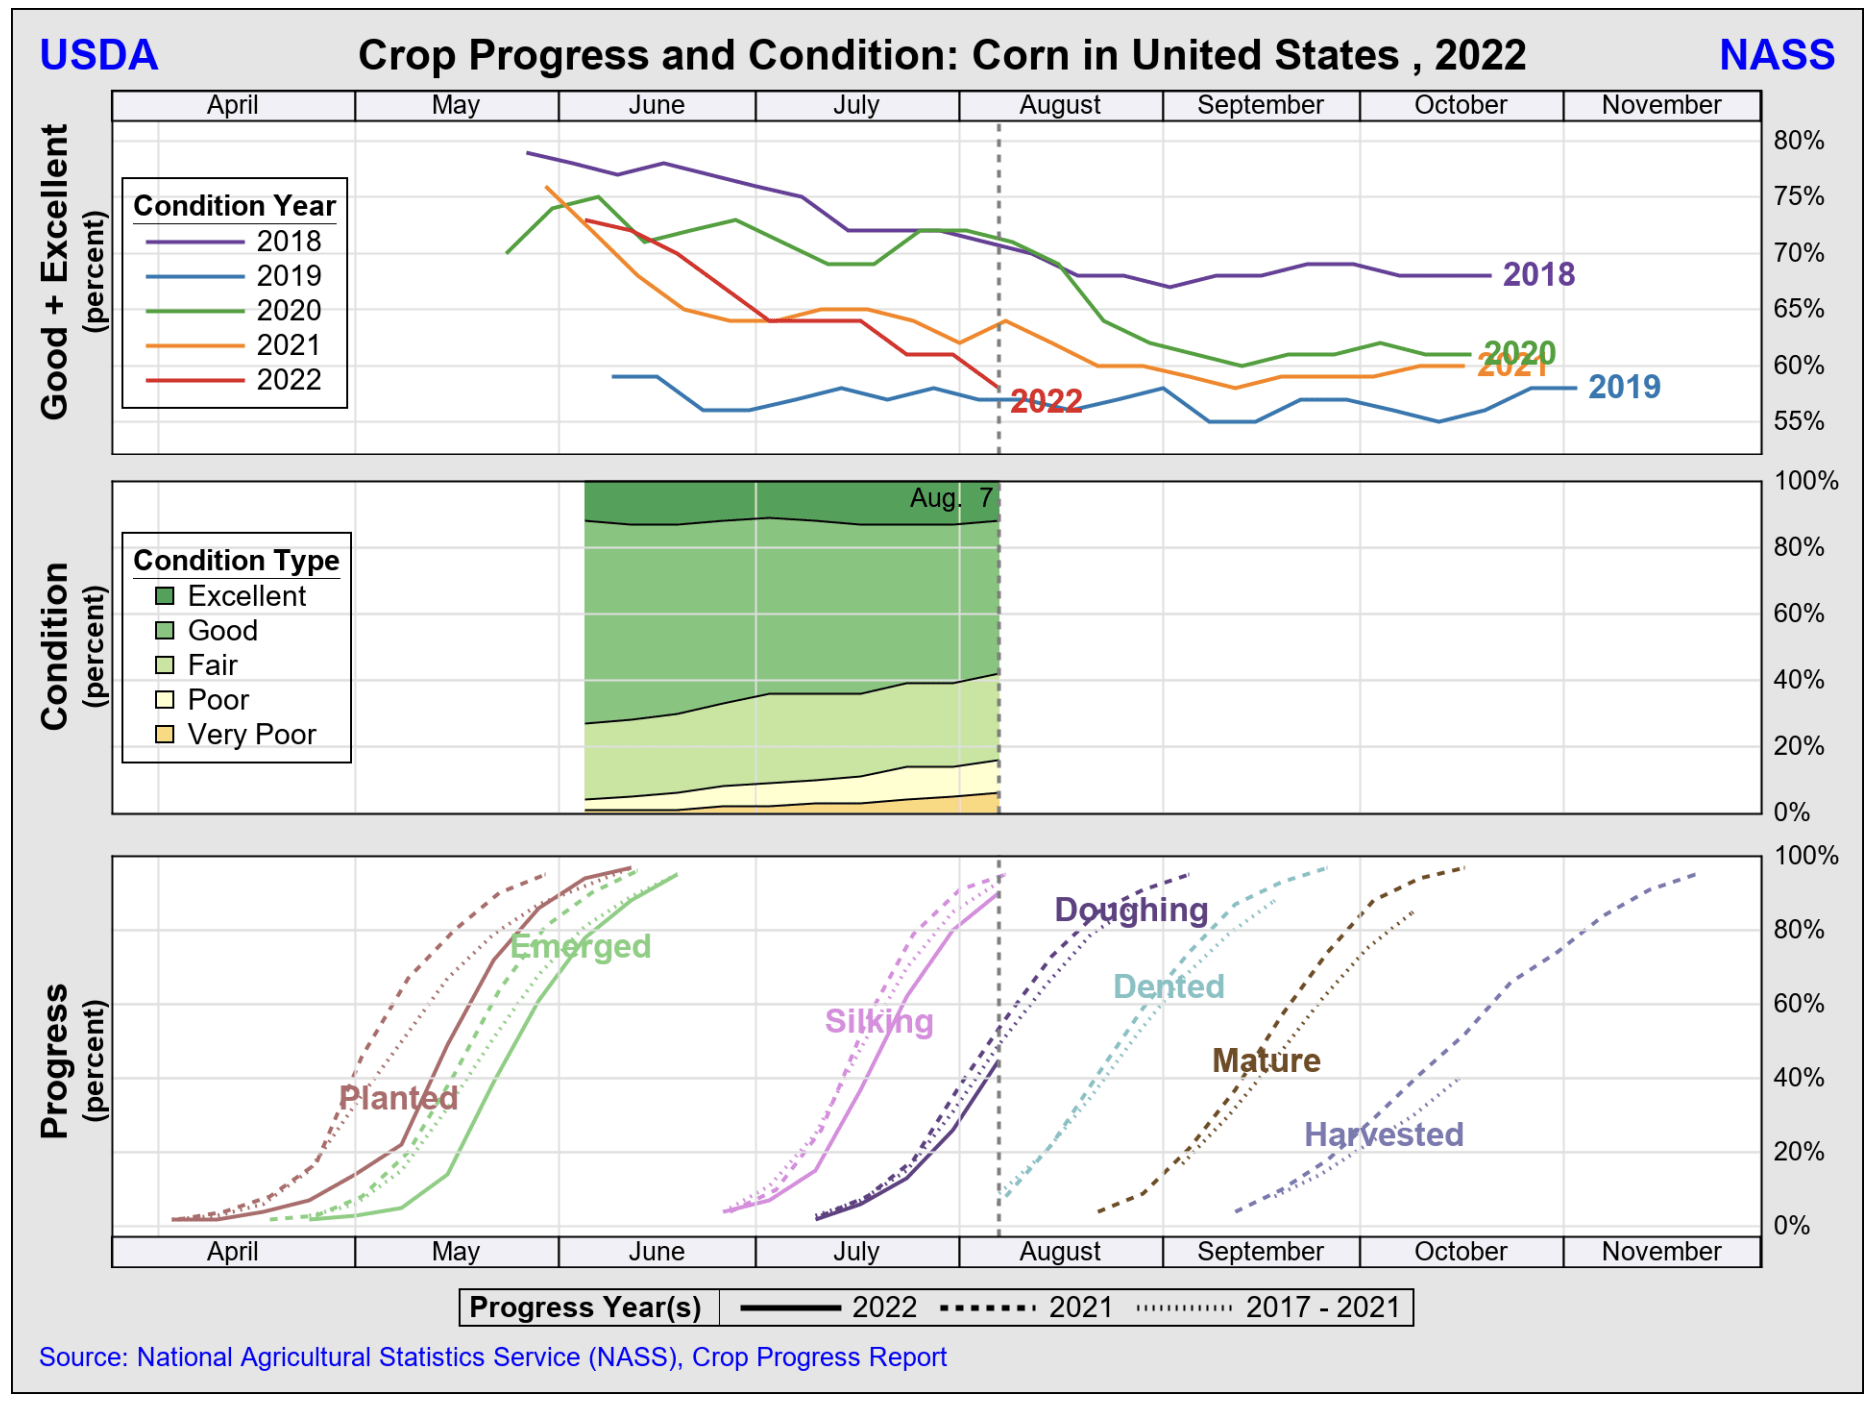
Hence, corn is now resuming its uptrend.
TradingView (Corn)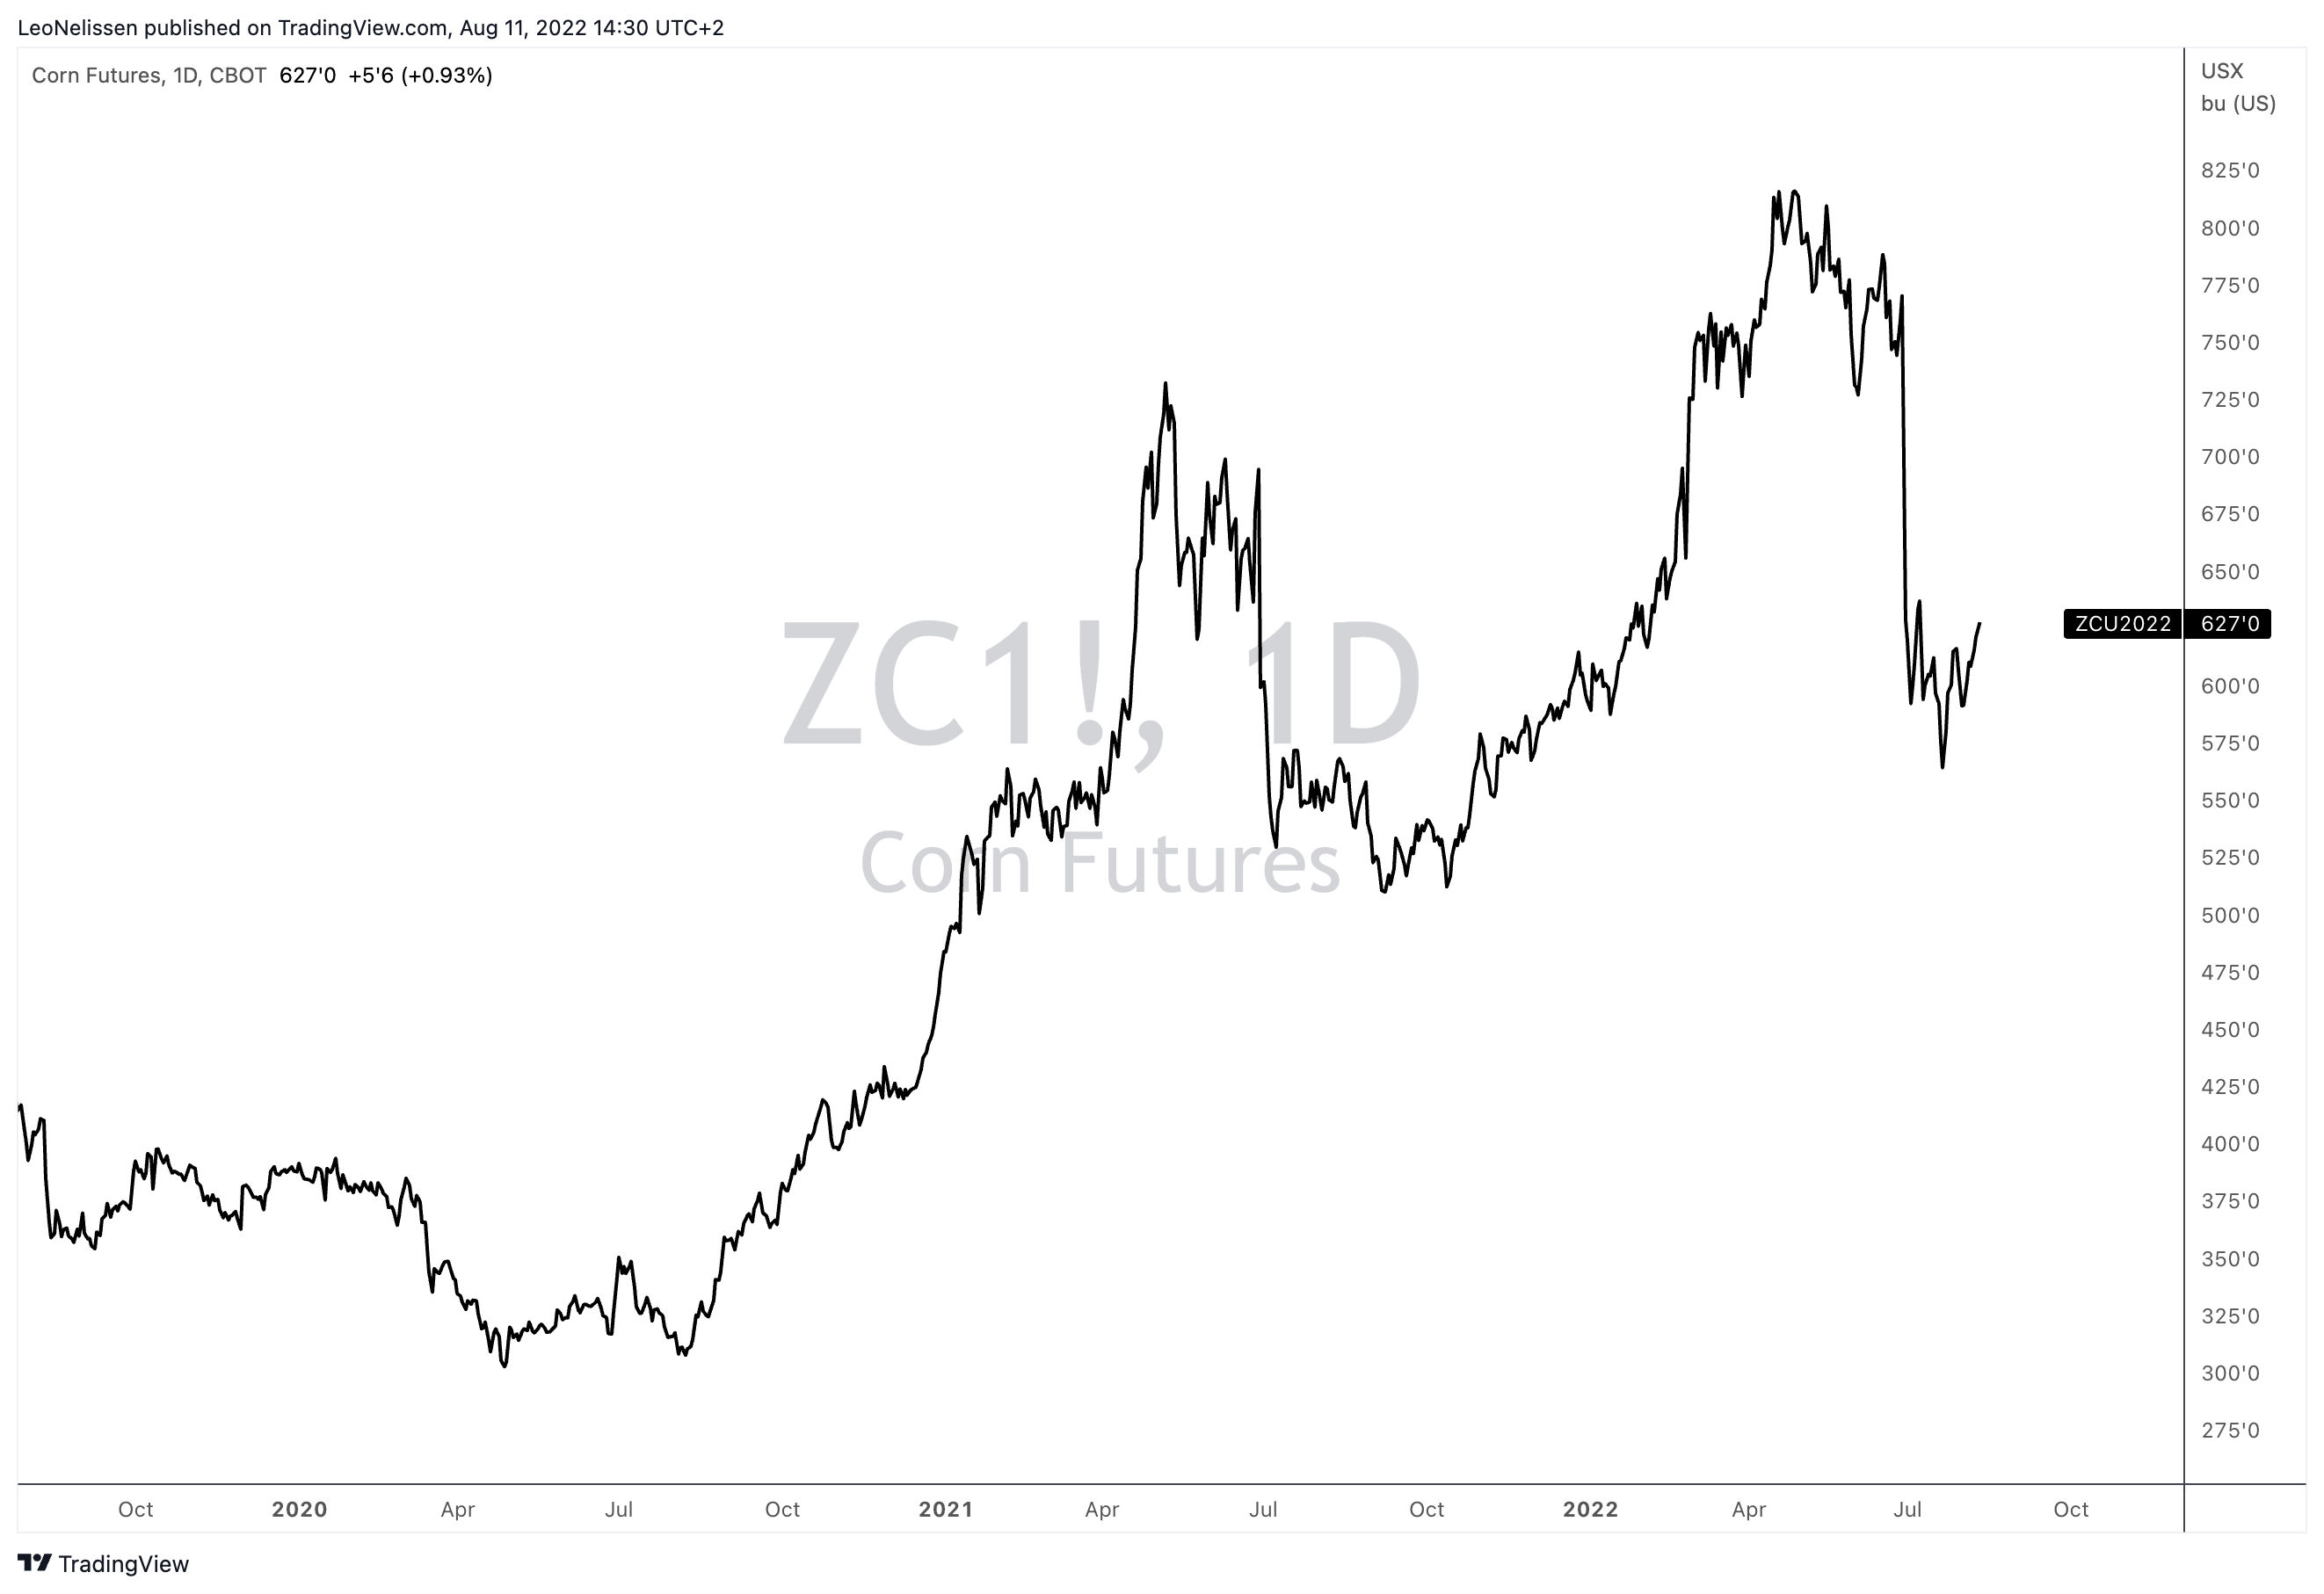
That’s where the aforementioned IEA article comes in handy as it shows the main drivers behind crop prices.
I cannot show you the charts for copyright reasons (please click on this link to see the chart), but I can quote the article. This is the part that matters most:
[…] direct and non-direct energy costs can account for 40% to 50% of total variable costs of cropping in advanced economies such as the United States. Higher energy and fertilizer prices therefore inevitably translate into higher production costs, and ultimately into higher food prices.
Energy prices are one of the most important parts of my macro research since 2021 as we’re dealing with unusual developments. Unlike prior cycles, producers are not accelerating production to make money. They figured out that maintaining steady production (or slow growth) keeps supply tight. This supports prices and free cash flow. I’m not blaming producers here but the bigger picture as this trend was fueled by environmental goals and risk/management to be protected against future oil crashes. I discussed all of this in detail in this article.
These developments include natural gas, which is also suffering from lower supply growth. The chart below shows that the period of cheap natural gas is over. Restricted growth in key production areas is now starting a “new era”, which ends the period of low natural gas prices as a result of accelerating shale gas growth.
EQT Corp.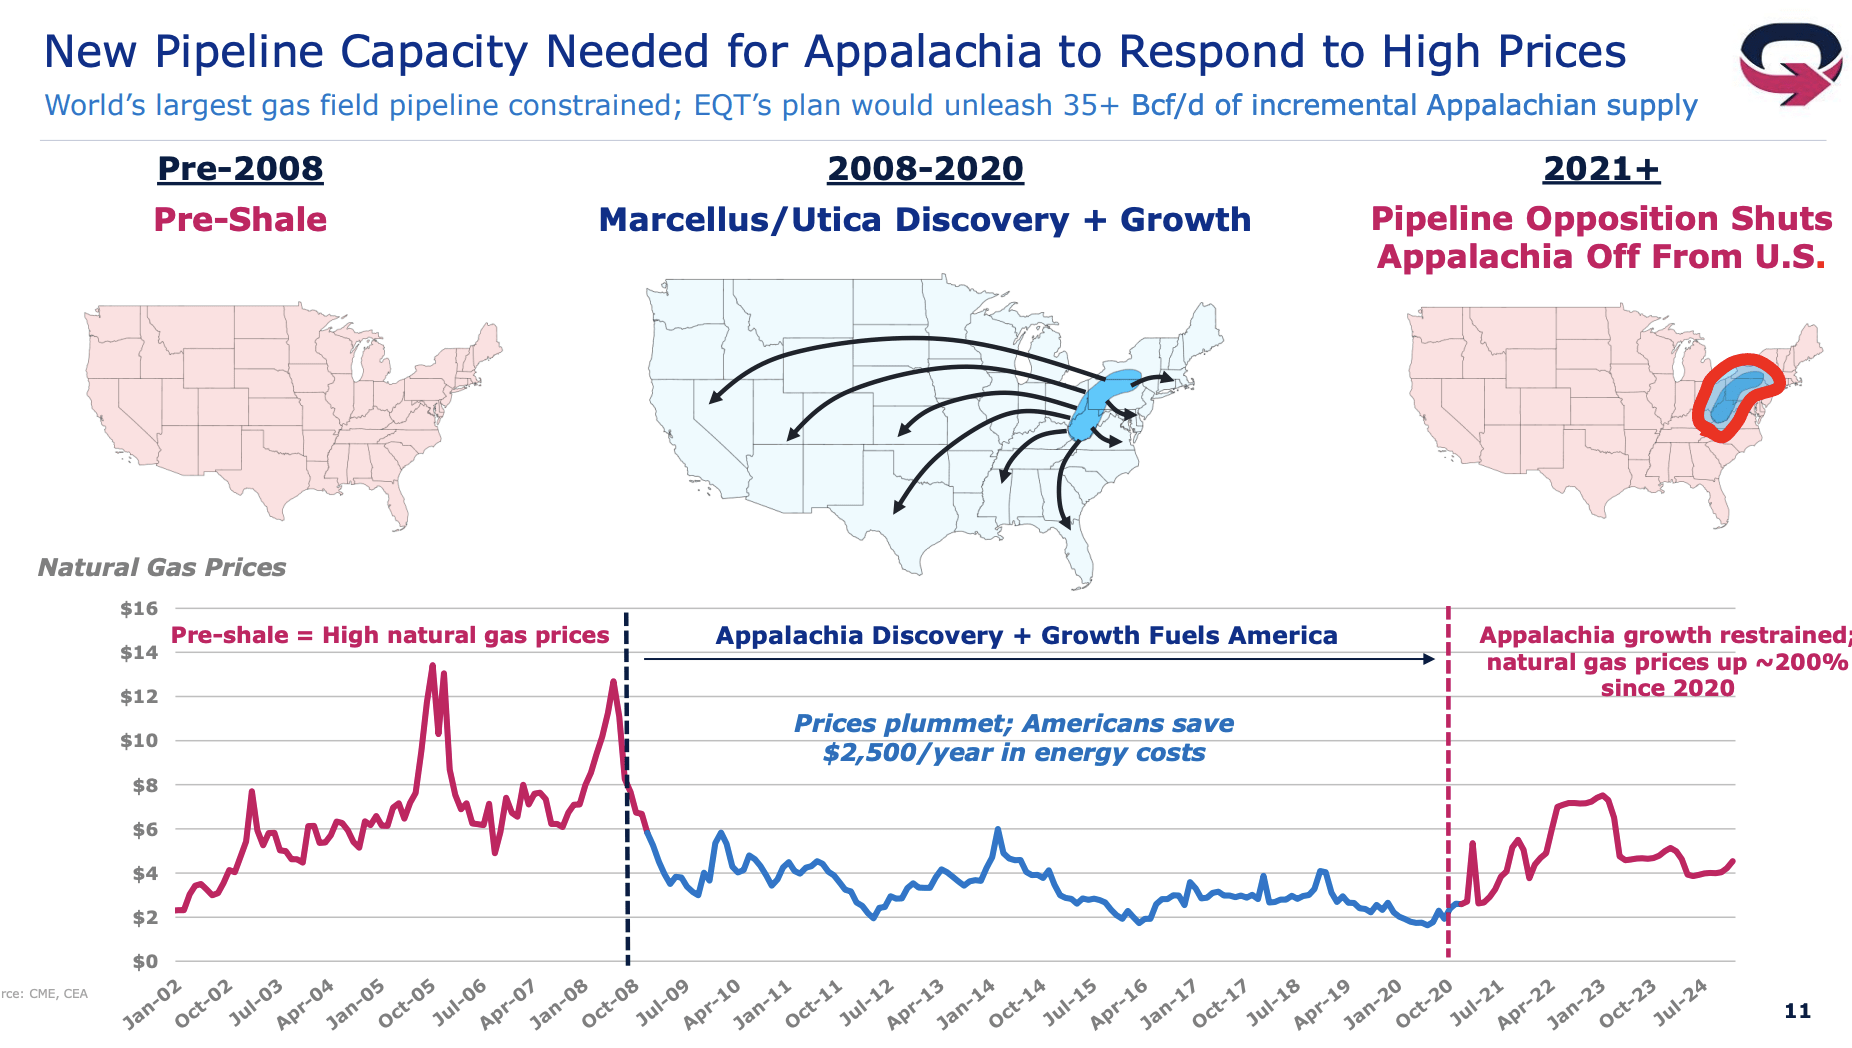
This matters because natural gas is a key feedstock in a lot of fertilizer processes. This mainly concerns Urea/UAN fertilizers, but rising prices put pressure on the market as a whole.
Fertilizers Europe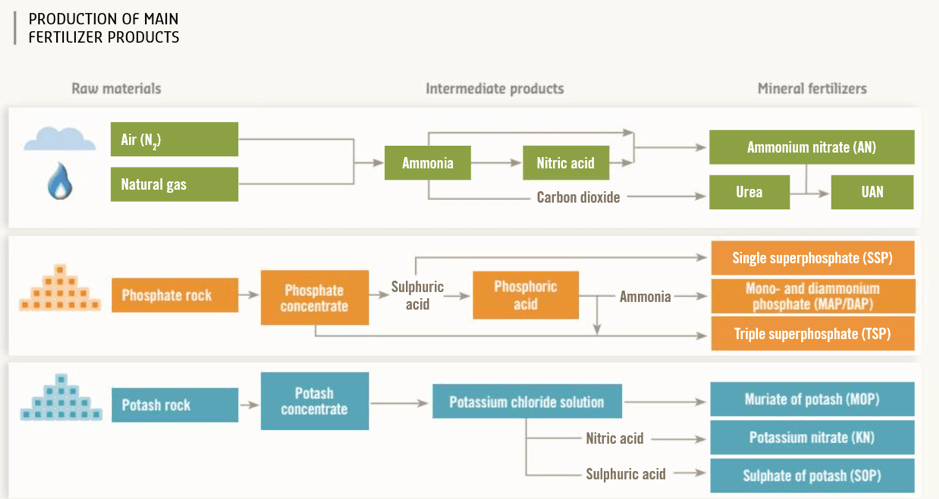
The graph below shows DAP futures. This fertilizer covers both nitrogen and phosphates, which I like to use as a benchmark when analyzing Mosaic.
What you’re looking at below are DAP futures (black line), the price of US-based Henry Hub natural gas (blue), and the price difference between Europe-based TTF natural gas and Henry Hub futures. All three have different scales and I converted European TTF to the same unit as Henry Hub.
While fertilizer prices have come down, I do not believe that this will last. Not only are energy prices rebounding (i.e., Henry Hub), but we’re also seeing that price differences versus Europe are rising again. Russia is further reducing gas flows to Europe, drought is further causing higher electricity prices, and already high energy prices make fertilizer production unaffordable. Hence, it benefits producers overseas – like Mosaic.
TradingView (Black = DAP, Orange = Henry Hub, Blue = TTE-Henry Hub)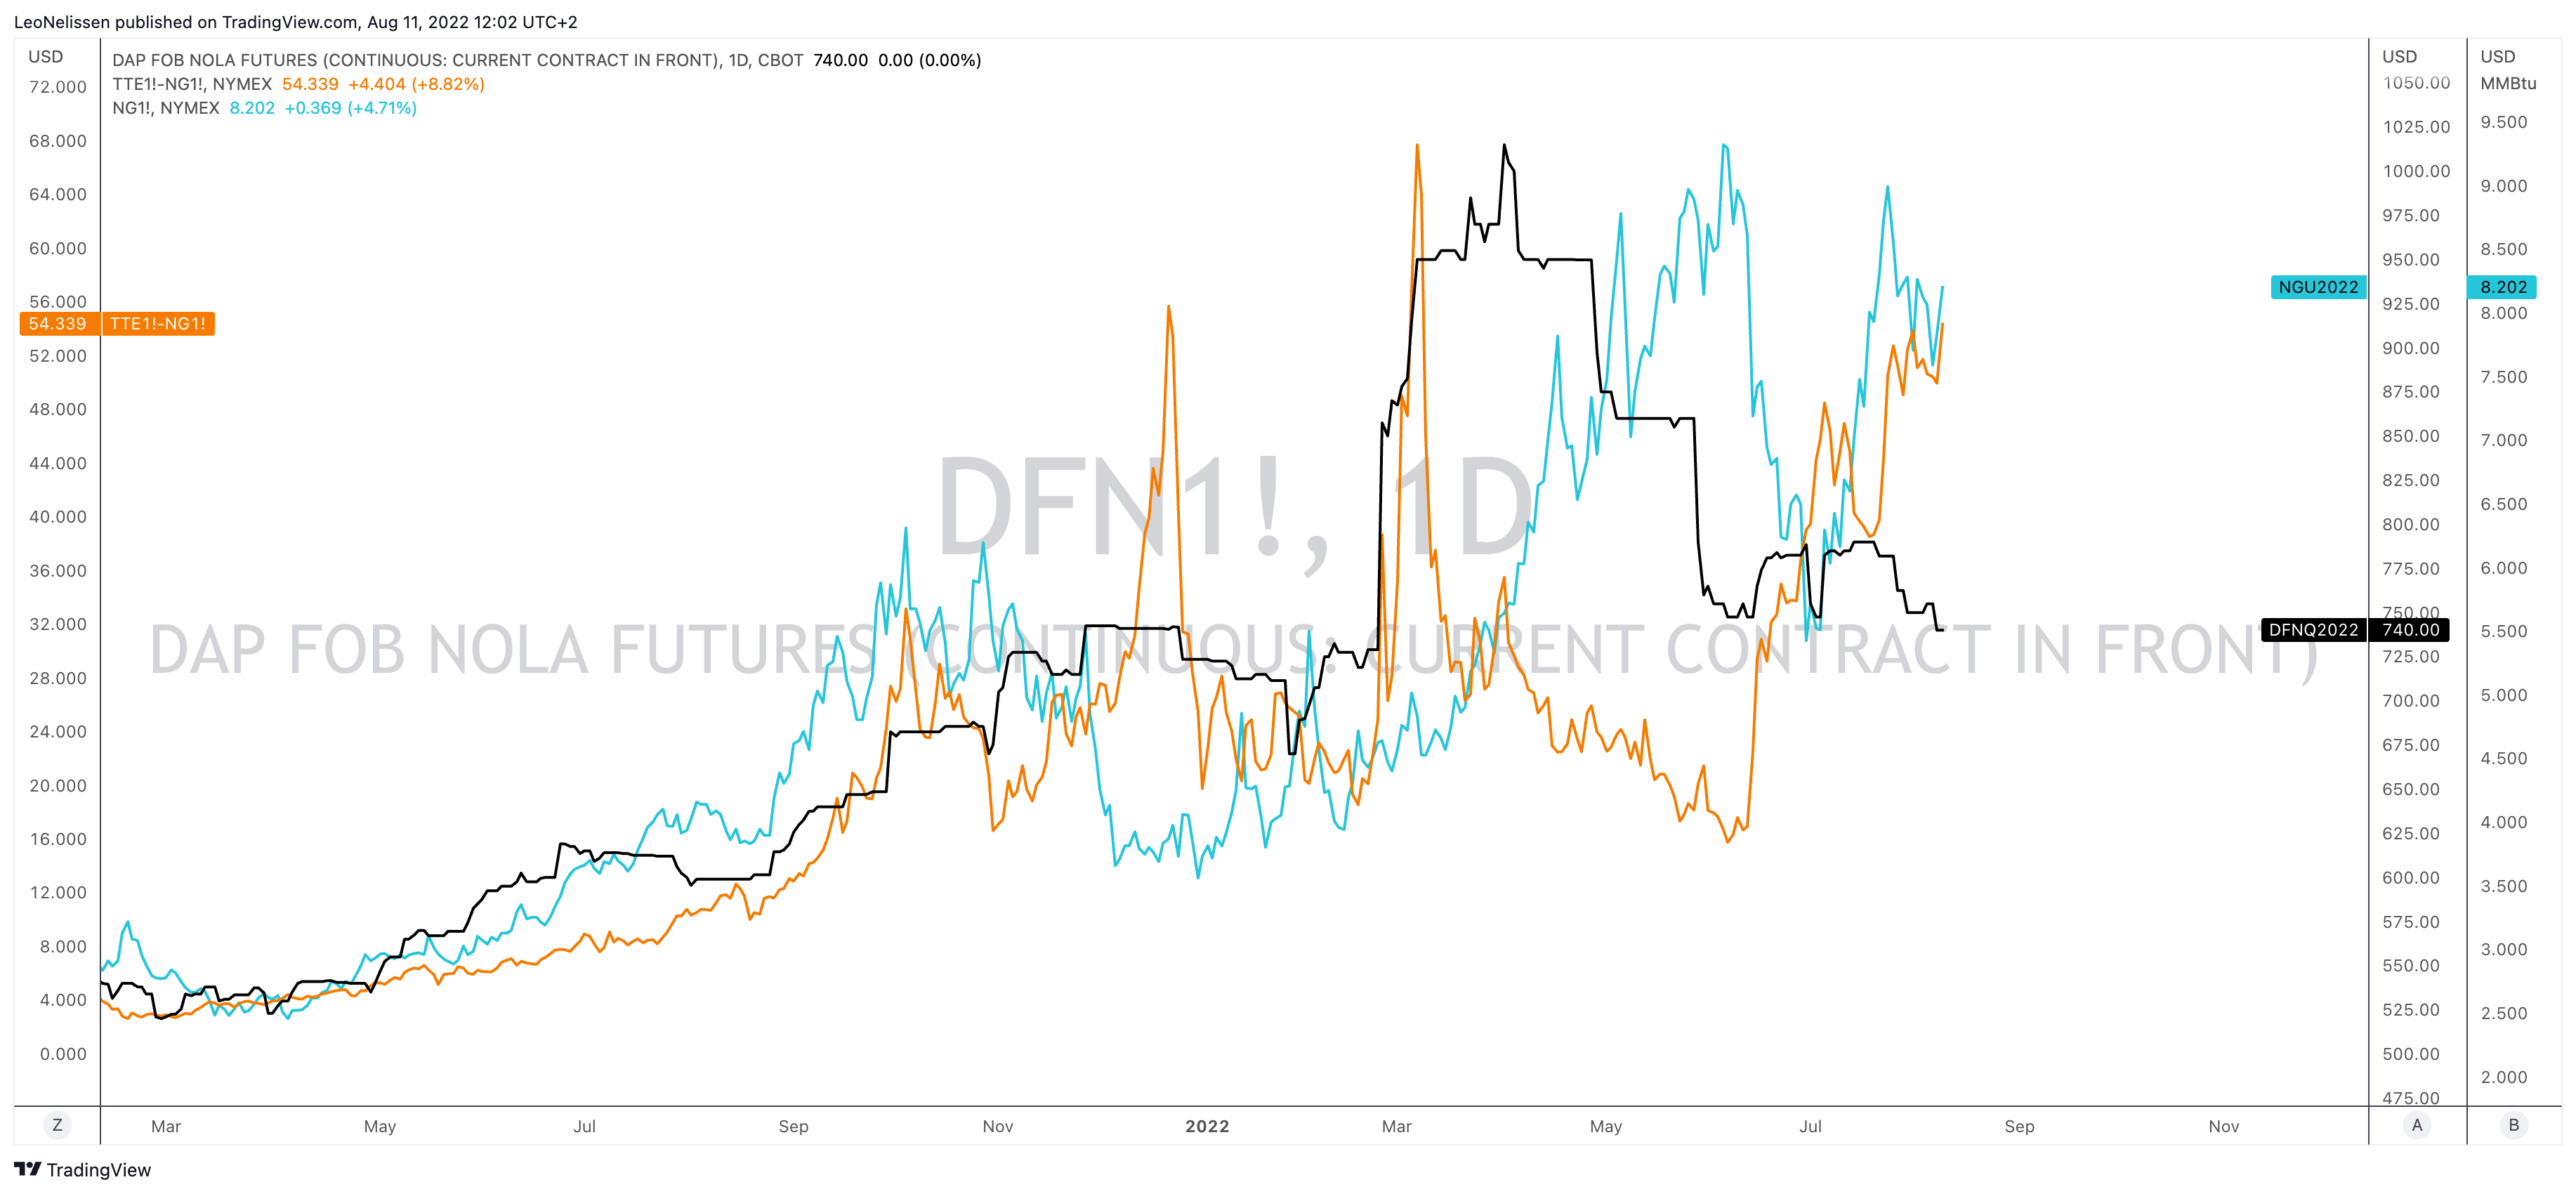
With that in mind, Mosaic also commented on fertilizer supply.
While average annual global shipments of phosphates and MOP (muriate of potassium) are expected to grow by 2.0% and 2.5%, respectively, Mosaic sees significant unfilled demand in both 2022 and 2023.
Mosaic Company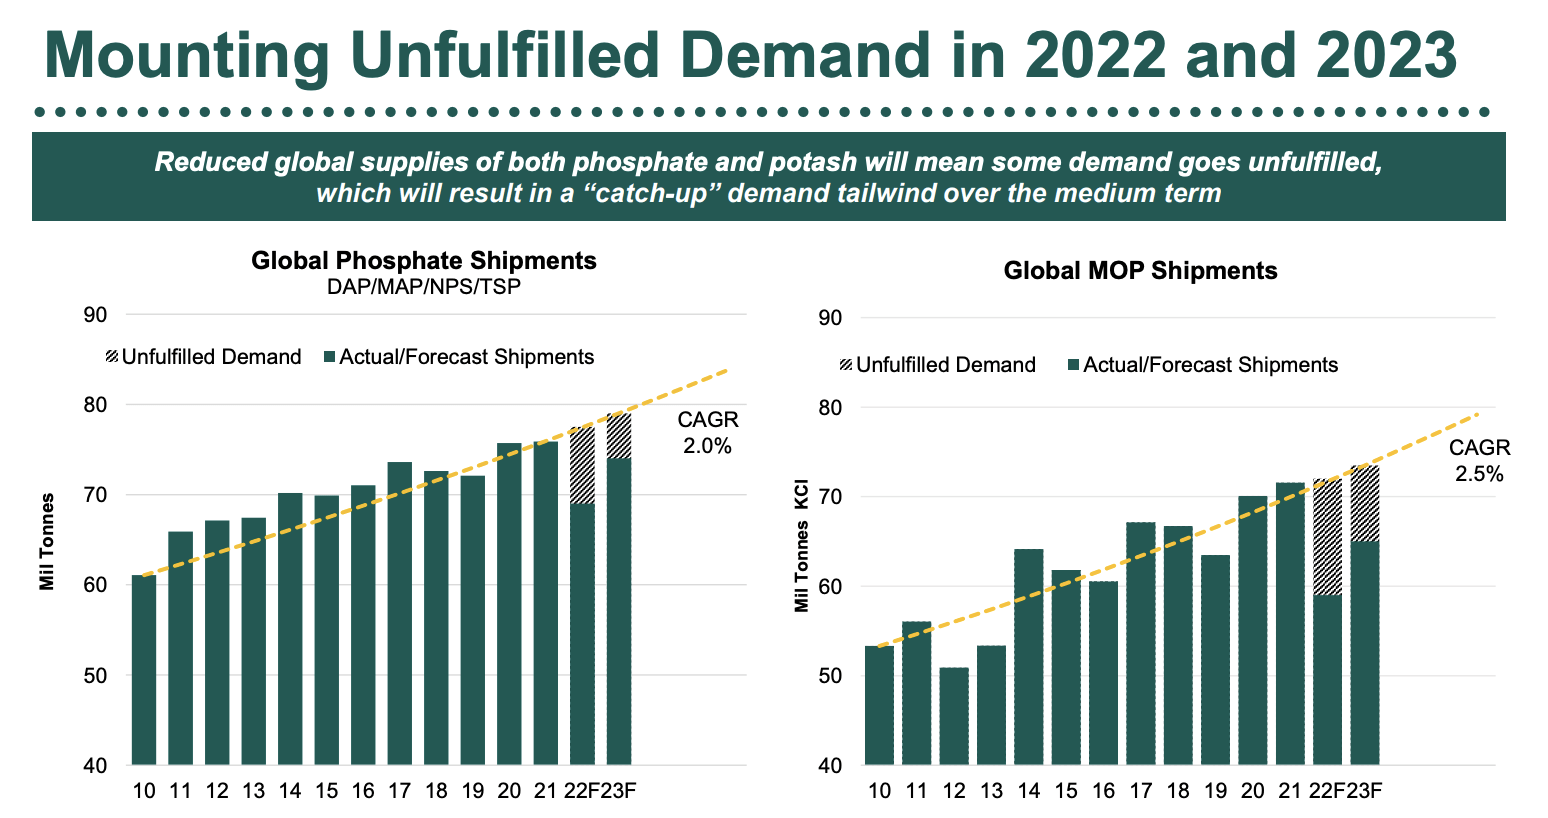
The company mentioned that “fundamentals remain quite strong” in both potash and phosphate fertilizer markets. According to its 2Q22 earnings call:
In potash, we continue to expect Belarusian exports to be down 8 million tonnes this year. Some of that will be mitigated by incremental supply from producers like Mosaic over the next 18 months. But that will not be enough to erase the deficit that we see lasting well into 2023 at least.
In phosphates, China has continued to restrict exports as it prioritizes domestic industrial and agricultural demand. We now believe full year phosphate exports from China could be down as much as 5 million tonnes from the prior year total of 11.5 million tonnes.
Shifting focus, we believe global fertilizer demand in the first half of 2022 was down about 10% from the same period last year, which aligns with the shortfall we’ve seen in supply. Grower sentiment has grown more cautious. But supply constraints are supporting global prices and margins well above historical levels, a situation we believe will continue at least through the rest of the year.
Mosaic also mentioned that North American and Brazilian producers (farmers) have been well-supplied. That’s what I also got from my own research, even if farmers need to pay way more for fertilizers. I expect this trend to continue where North American and South American farmers continue to be better off than farmers in other regions.
Now, a closer look at the numbers.
Mosaic Stock Remains Too Cheap
Between 2011 and the pandemic, commodity stocks (in general) were in a tough place. The long-term trend was deflationary and money was piled into tech and growth stocks. Mosaic had a leverage ratio of more than 3x EBITDA in many years and low margins.
That changed in 2021. In 2022, the company is on track to generate $3.6 billion in free cash flow.
TIKR.com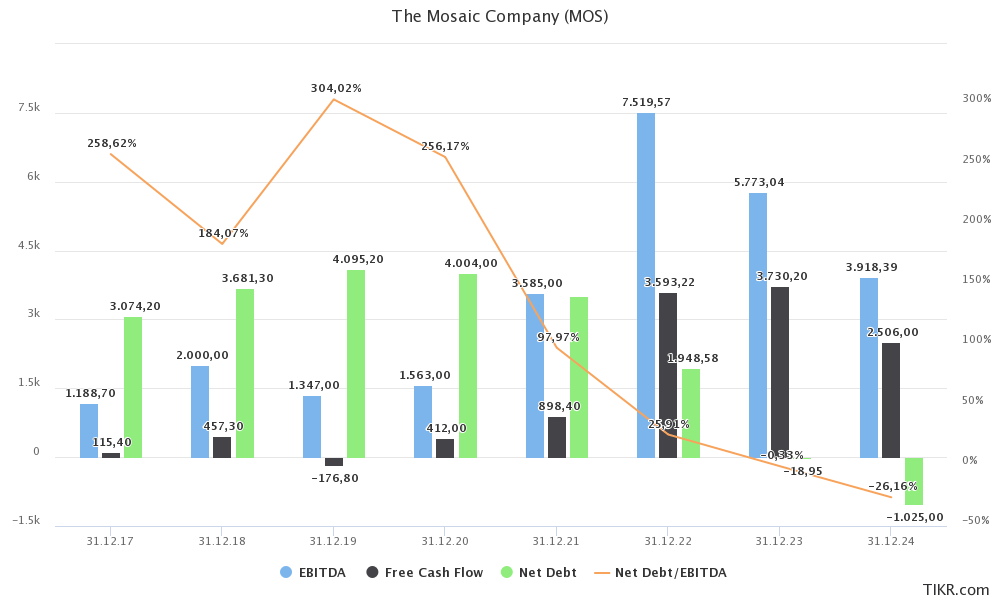
This is after investing $1.3 billion in higher production. This includes K3, one of the world’s most efficient potash mines. The company has boosted production to 5.5 million tons per year with the outlook to bump it up by another 1 million in 2023.
At Colonsay, we’ve begun the process of restarting the second mill, which should expand output to 2 million tonnes per year by the second half of 2023. In phosphates, we continue to benefit from our advantaged position in ammonia and we’re now seeing an improvement in sulfur costs that should begin to flow through to our production costs later this year.
On top of that, $1.0 billion will go towards debt reduction. The company does not have plans to lower its debt load beyond 2022. Yet, the chart above shows that net debt (gross debt minus cash) is expected to fall into negative territory. That’s simply based on the fact that high cash generation can lower net debt, even if the gross debt remains unchanged.
Analysts are not giving an outlook on share buybacks as these programs are often volatile and hard to predict.
Mosaic, however, has authorized a new $2.0 billion share buyback program and a $0.60 per share quarterly dividend. The company will also consider a special dividend to distribute its cash.
After all, $3.6 billion in free cash flow is 19% of the company’s $18.6 billion market cap. Even better, next year, free cash flow is expected to remain just as high. In other words, even *if* commodities implode after 2023, MOS is in a good position to have zero net debt. That’s a blessing for future downturns and bull markets as it allows the company to return more money to investors.
When adding the $18.6 billion market cap to $120 million in pension-related liabilities and $160 million in minority interest, we get an enterprise value of $18.9 billion. In 2023, the company is expected to have zero net debt. That’s down from $500 million in net cash as the company will buy back shares more aggressively.
This gives us a 3.3x EBITDA multiple using 2023 expectations and 4.8x EBITDA in 2024 when analysts expect the situation to normalize.
TIKR.com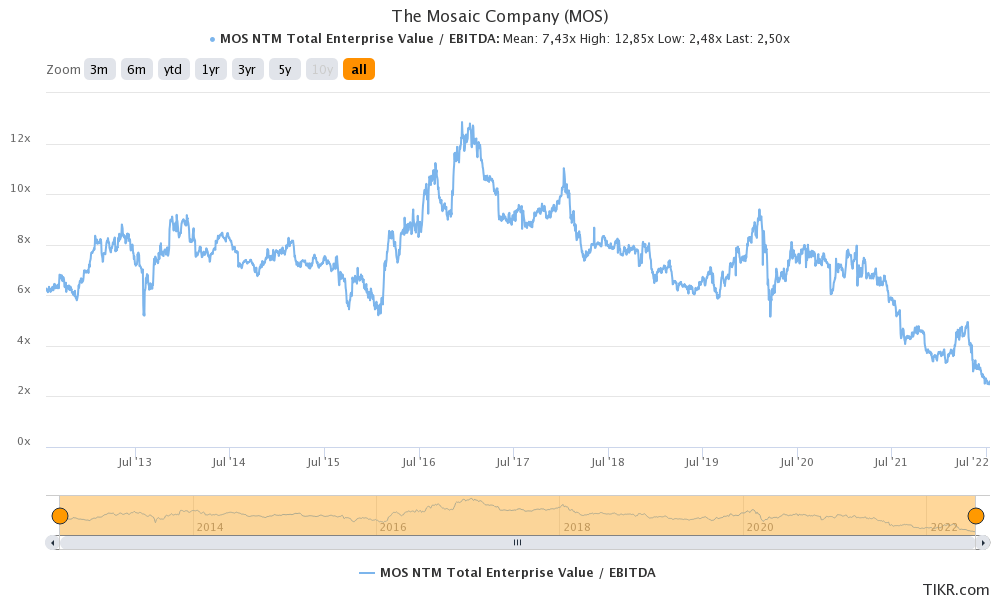
So, to quote my prior article:
This is way too cheap and it does not at all price in the risks (or in this case opportunities) facing the agriculture sector.
Hence, I believe that Mosaic should trade at least between $70 and $80, which could be achieved by the end of this year if the energy crisis in Europe worsens – to give you a trigger event.
If that doesn’t happen – and I think we all hope that this can be avoided – I believe it will be a more gradual uptrend towards these targets in early 2023.
Takeaway
The agriculture bull market has legs. Supply is expected to remain very tight. High energy prices, weather-related, and geopolitical developments are making things worse as we’re witnessing a renewed uptrend in energy and agriculture commodities.
Especially given the situation in energy markets, it is not unlikely that we’re indeed in a long-term commodity “super” cycle, which will keep agriculture supply tight.
Mosaic remains in a good spot as the company is boosting output while benefiting from longer-term fertilizer tightness. Given the current situation, the company is in a good spot to erase all of its net debt and pursue aggressive shareholder distributions backed by its quarterly dividend, special dividends, and buybacks.
Moreover, as energy prices continue their uptrend, I believe that the outlook for fertilizer companies will have to be adjusted to the upside, meaning MOS could become even cheaper than it already is.
So, needless to say, I remain bullish on Mosaic and the agricultural sector, in general.
(Dis)agree? Let me know in the comments!
Be the first to comment