

I’ve come up with what might be an unconventional way of forecasting inflation.
I begin with the per capita net growth in aggregate debt in the US as my baseline to work with.
From there, I use four factors that will prove to be either an inflationary force or a deflationary force. Depending on which forces win out will determine not just the overall rate of inflation, but whether or not your weekly earnings will be able to buy you more now vs. what it could a year ago.
The rate of inflation should also be a factor in determining the minimum rate of return on your investments you should demand.
To help picture this idea, I created this color coded array to summarize my forecasts:
I’ll begin with the net growth in credit per capita. The chart below compares the overall net debt growth per capita vs. the rate of inflation (red line).
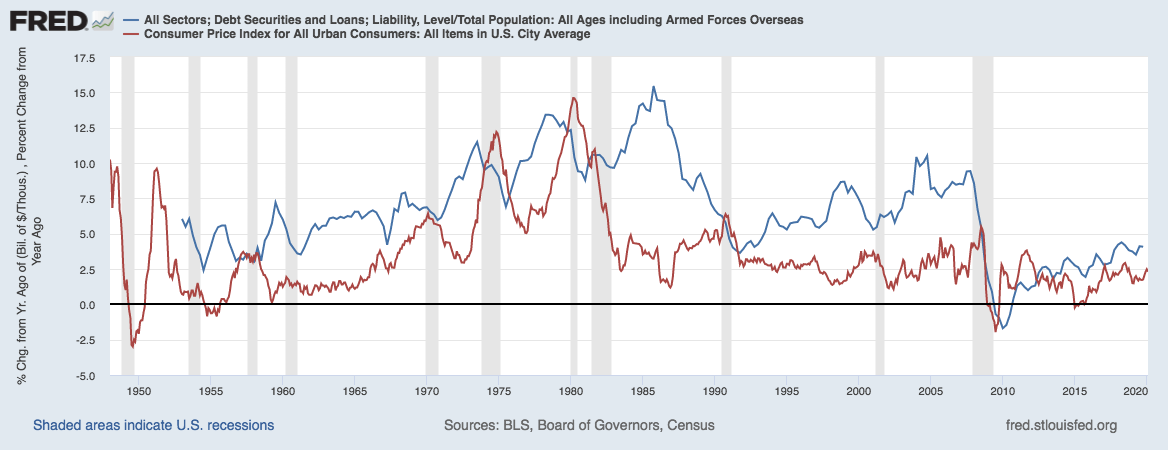 Credit growth is the first and foremost inflationary force. In the US, money is debt, so debt growth is synonymous with money growth.
Most of the time, there are enough deflationary forces that end up making the rate of inflation less than the rate of credit growth.
This additional credit growth is what then provides the additional money to purchase more things and thus improve your living standard.
The most recent rate of growth in net credit per capita was 4.08% year over year.
Given the state of demand destruction due to the shutdown of parts of the economy, there is going to be less demand for car loans, mortgages, new business loans, etc. At the same time, there will likely be defaults contributing to a lower level of “net” credit growth.
This is where the Federal Government, the borrower of last resort, must come in and use fiscal policy to add Treasury debt as a means to get the overall net credit growth to be positive.
If net credit growth were to be negative, we’d likely be in a deflationary depression. Hence why the Federal Government is stepping in and borrowing.
My forecast is the borrowing should be enough to get a 3% net credit growth. It could very well be less than that depending on how bad things get.
Now I’ll move on to the four factors that will prove either a deflationary force or an inflationary force.
Productivity
Productivity or output per hour is a measure of how much work can be done in one hour. It involves all of the input costs to make a product or provide a service.
Making something cost less is the goal and it’s most certainly a deflationary force.
The steel tycoon Charles Schwab would measure his success not by how much profit he could make, but by how much he could reduce the cost to produce a ton of steel at one of his steel mills.
For the past 40 years I’d argue, some of the gains in productivity have come from the importation of input costs from substantially cheaper foreign labor.
Here is a 40 year chart of the yearly rate of change in the output per hour:
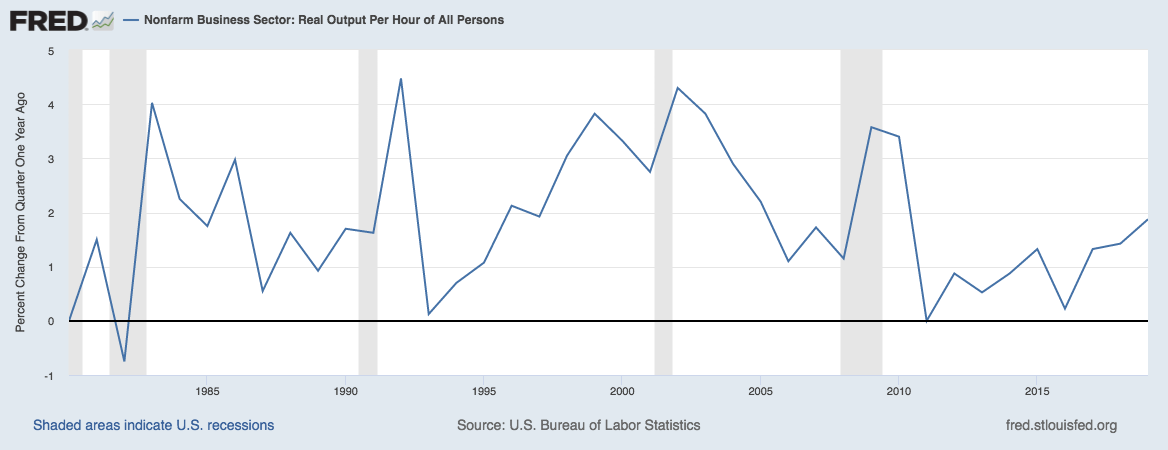 In recessions, the initial response to productivity is for it to rise year over year. This is likely due to reduced input costs like lower commodity prices and or a strong dollar that contributes to lower commodity prices and imports.
The very near-term forecast for productivity today is for it to be a strong deflationary force. A collapse in oil prices will be an input cost that is experiencing tremendous deflation.
Keep in mind, productivity is output per hour worked and with the current level of job losses, there are going to be less hours worked making the aggregate output lower.
Currency
The value of the dollar makes a big impact on the rate of force being inflationary or deflationary.
The stronger the dollar vs. a year ago, the more of a deflationary force it will be. If the dollar is weaker vs. a year ago, then likely, the cost of imports goes up and the cost of commodities in dollars could be higher as well.
Here is a long-term chart of the trade weighted dollar index:
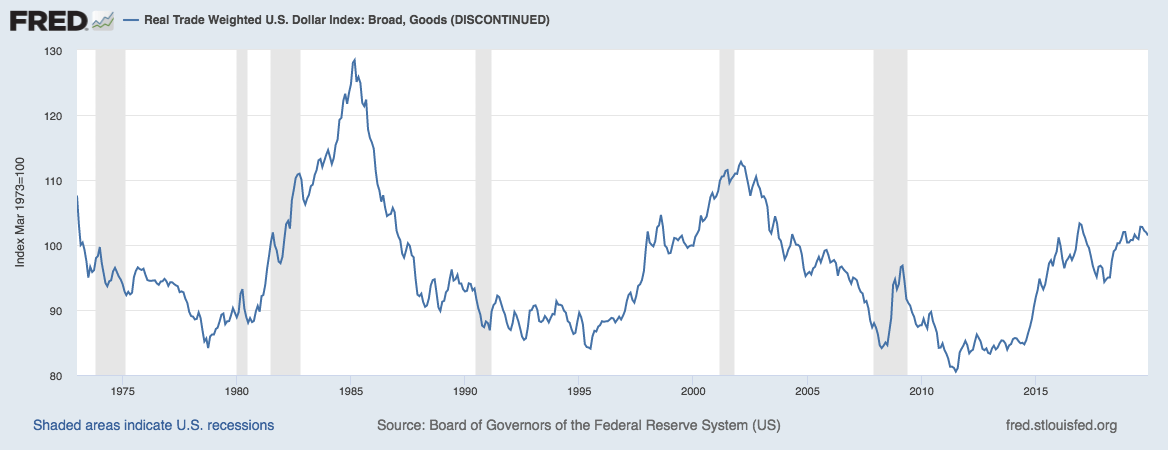
Note: This chart’s data has been discontinued since December 2019
This chart very much gives justice to the periods of a strong level of a deflationary force.
The dollar soared in value in the first half of the 1980s and that is what not only killed the inflation problem of the 1970s, but also helped to facilitate the massive amount of credit without having inflationary consequences.
Of late, from 2014, the dollar has been a strong deflationary force helping keep wage gains well above the rate of inflation.
Here is a more current chart of the dollar index:
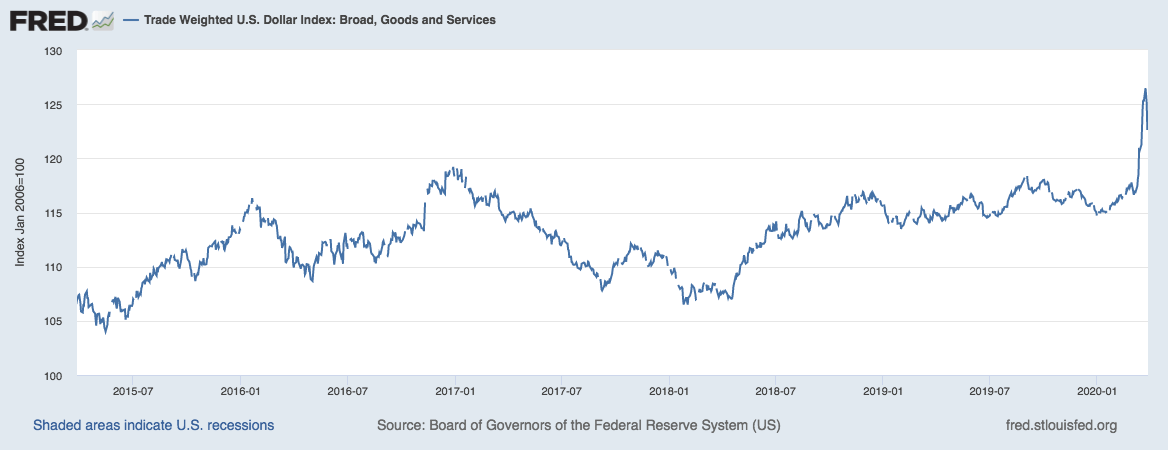 With the recent spike, the dollar was up 10% from a year ago.
In the 2009 recession, the dollar also rallied strong before resuming its decline.
The immediate forecast is for the dollar to remain strong and to remain a slightly deflationary force against the rate of credit growth.
Longer term, given how strong the dollar currently is, there is a risk the dollar losses value relative to our trading partners. This will contribute to an inflationary force and something to certainly look out for.
Imports
Imports for the most part are in and of themselves a deflationary force. The reason being is due to the strong dollar and lower labor costs vs. ours in the US. However, there are times when higher imports could prove inflationary like in the 1970s. In the 1970s, the US imported a lot of oil and oil prices rose a lot too. This was not a deflationary import.
But in the 1980s, with a strong dollar and more trading, imports proved a helping hand with being a deflationary force. NAFTA in 1991 gave way to imports from Mexico that would bring costs down. Then in 2000, when China joined the World Trade Organization, that unleashed a flood of cheaper parts and inputs.
Here is a chart showing imports of goods and services as a percent of our GDP:
 This chart represents “globalization” and globalization has peaked in 2009. Imports as a percent of GDP have been in a steady decline since 2012. This has resulted in being not as much of a deflationary force.
Appreciate that in 2000, the US produced 29% of the clothes we bought domestically. By 2013, the US produced just 2% of the clothes we bought domestically. There was nothing left to be a deflationary force for clothes except for which country we would import from.
If the US were to start making clothes again, at US labor costs, then the cost to produce a t-shirt will be much higher than say having it made in Bangladesh.
So what I look for is the trend in imports as a percent of GDP. The current trend is for us to be importing less and thus, we don’t have any deflationary force coming from imports like we did throughout the 1980s, 1990s and 2000s.
It’s a neutral force currently.
Commodities
The last factor is the cost of commodities. Supply and demand are one part of that equation. Currently, there is so much demand destruction, prices of commodities are in free fall.
I like to use the producer price index for commodities as my metric for measuring whether commodities will be an inflationary force or a deflationary force.
Here is a long-term chart showing the producer price index of commodities:
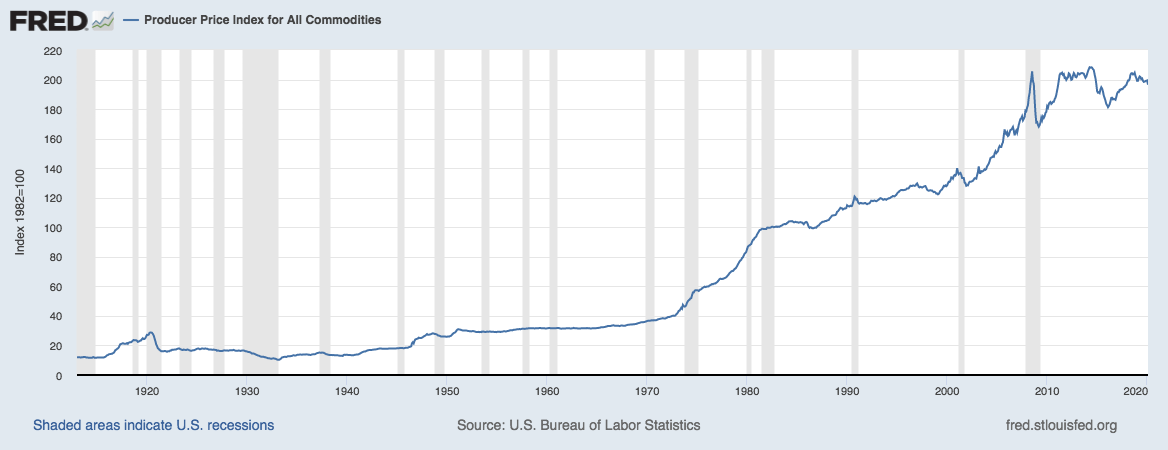 This chart helps to appreciate how when one factor can be very inflationary, there are other ones that act as a counter. So as you can see here, commodities rose substantially from 2000 to 2008. That was a fierce inflationary force. Yet, the deflationary force from importing goods from China counteracted this inflationary force allowing for still some real wage gains to be had.
Here is a shorter-term chart showing year-over-year percent change in the producer price index of commodities:
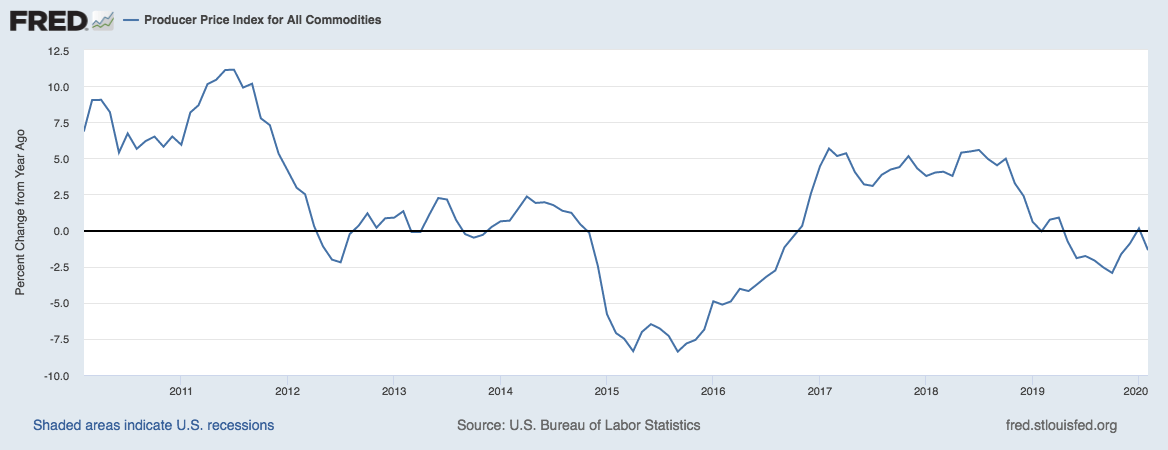 This chart goes out to February of 2020. Already, throughout much of 2019, the year-over-year change in this price index was negative and that was putting a deflationary force on inflation.
March will prove must lower commodity prices and will prove to be a very deflationary force.
Inflation Forecast
Adding this all up, we’re looking at a good deal of deflationary forces in the near term, 1-6 months out. Inflation will likely be negative, around -1.0% I forecast.
Looking at the latter part of the next 12 months out, I can see inflation picking up again to a low 0.50%.
Weekly Earnings
Weekly earnings are a measurement I like to see relative to inflation. In good times, the rate of growth in weekly earnings will be higher than the rate of inflation. This is your de-facto improving living standards.
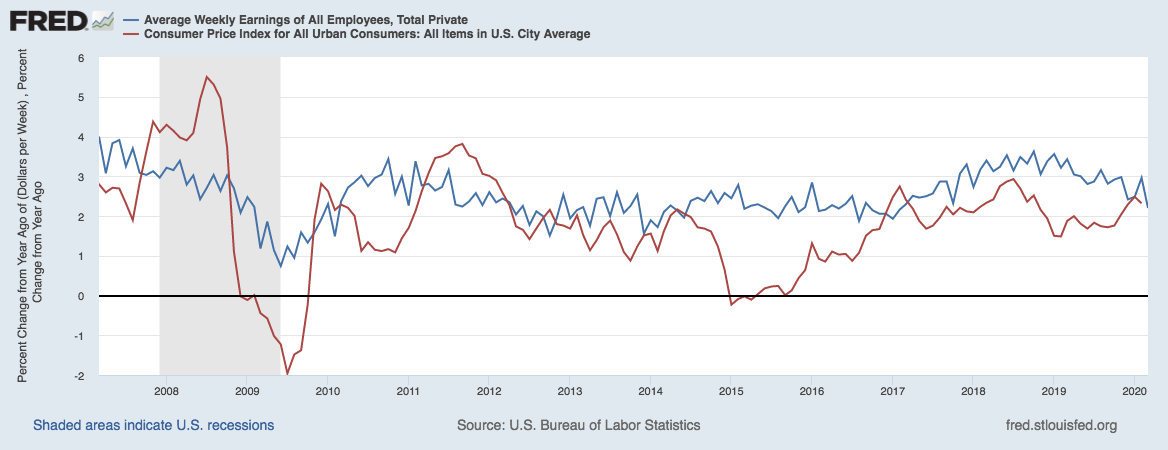 Because the rate of inflation will likely be down to as low as -1.0%, in the near term, anyone who has a job that won’t see a pay cut or a cut in hours worked is likely to benefit from the collapse in demand and lower inflation.
However, so many workers will see cuts to hours and see a reduction in weekly earnings.
Investor Implications
Investors should have low expectations for returns even as far as shooting to make 1% year over year as a means to preserve capital and preserve wealth.
The real goal is to beat the rate of inflation, so with inflation being low at the moment, even earning 1% should be ok and certainly better than losing 10%.
Longer Term
There is a risk that inflationary forces begin to run high when I look more than one year out.
How the government continues to respond with fiscal policy will play a major role in the rate of net credit growth per capita and that will help determine a baseline of what the rate of inflation could be.
However, what’s really at stake are the inflationary and deflationary forces.
All four factors have the potential to become inflationary forces against the rate of net credit growth per capita.
If the dollar trades weaker 1-2 years from where it trades today, that’ll make it become an inflationary force. Oil trades in the $20s today, but in two years’ time, it could come back up to $50 and that gain in price will prove to be an inflationary force.
Getting the news flash that we don’t even make critical medical supplies in America anymore should well get America to start making goods here in the States again. Of course, that should prove to be an inflationary force.
Stimulus money is not for investment, but rather simply to keep paying bills or payroll and putting food on the table.
This is debt that won’t have any impact on productivity gains that would normally be had from taking on debt for fixed investment.
So adding this all up, there is a very high risk that once we get over this deflationary episode, we’ll be heading toward inflation rates that will be higher than the increases in weekly paychecks and this will hinder economic growth.
The last time we had such a period like this was the 1970s. It’ll be all about “hedging” against inflation in such a case. Commodities will likely do very well in such an environment.
Corn prices (CORN) are at multi-year lows now due to demand destruction.
The current environment of a strong dollar and massive demand destruction is putting tremendous pressure on commodity prices. This could very well be setting us up for starting to build a portfolio of commodity-related investments.
The food, energy and metals sectors are where I’m looking now.
Disclosure: I/we have no positions in any stocks mentioned, and no plans to initiate any positions within the next 72 hours. I wrote this article myself, and it expresses my own opinions. I am not receiving compensation for it (other than from Seeking Alpha). I have no business relationship with any company whose stock is mentioned in this article.
Be the first to comment