

CRobertson/iStock Editorial via Getty Images
Investment thesis
Though close to its ATH, Academy Sports and Outdoors (NASDAQ:ASO) is still a very cheap stock compared to its value. In this article, I would like to outline why I recently initiated a position that I plan on building up over the next quarters.
Company overview
Academy Sports and Outdoors is a full-line sporting goods and outdoor recreation retailer in the United States. It was originally founded in 1938 as a family business in Texas, and it has now grown to 262 stores across 17 states. Academy’s product assortment focuses on key categories of outdoor, apparel, footwear and sports and recreation through both leading national brands and a portfolio of private label brands.
The average store size is approximately 70,000 square feet, positioning Academy as a large format sporting goods store. However, its extensive assortment differentiates it from its competitors and enables the company to take market share from other retailing categories such as mass general merchants, traditional sporting goods stores and specialty outdoor retailers.
The company has been publicly traded only for a couple of years since its IPO took place in October 2020.
Company outlook
New stores
One of the most interesting aspects of this company is its geographical footprint. As shown from the slide below, the company currently operates 259 stores in 16 states in the South and the Midwest. The main state is Texas, where the company was founded and from where it has expanded. As we can see, the company wants to highlight that almost a third of its stores find themselves in the top fastest-growing metropolitan statistical areas. Given this situation, the company expects its stores to deliver superior results compared to retailers that are in areas with slower demographics.
ASO Investor Presentation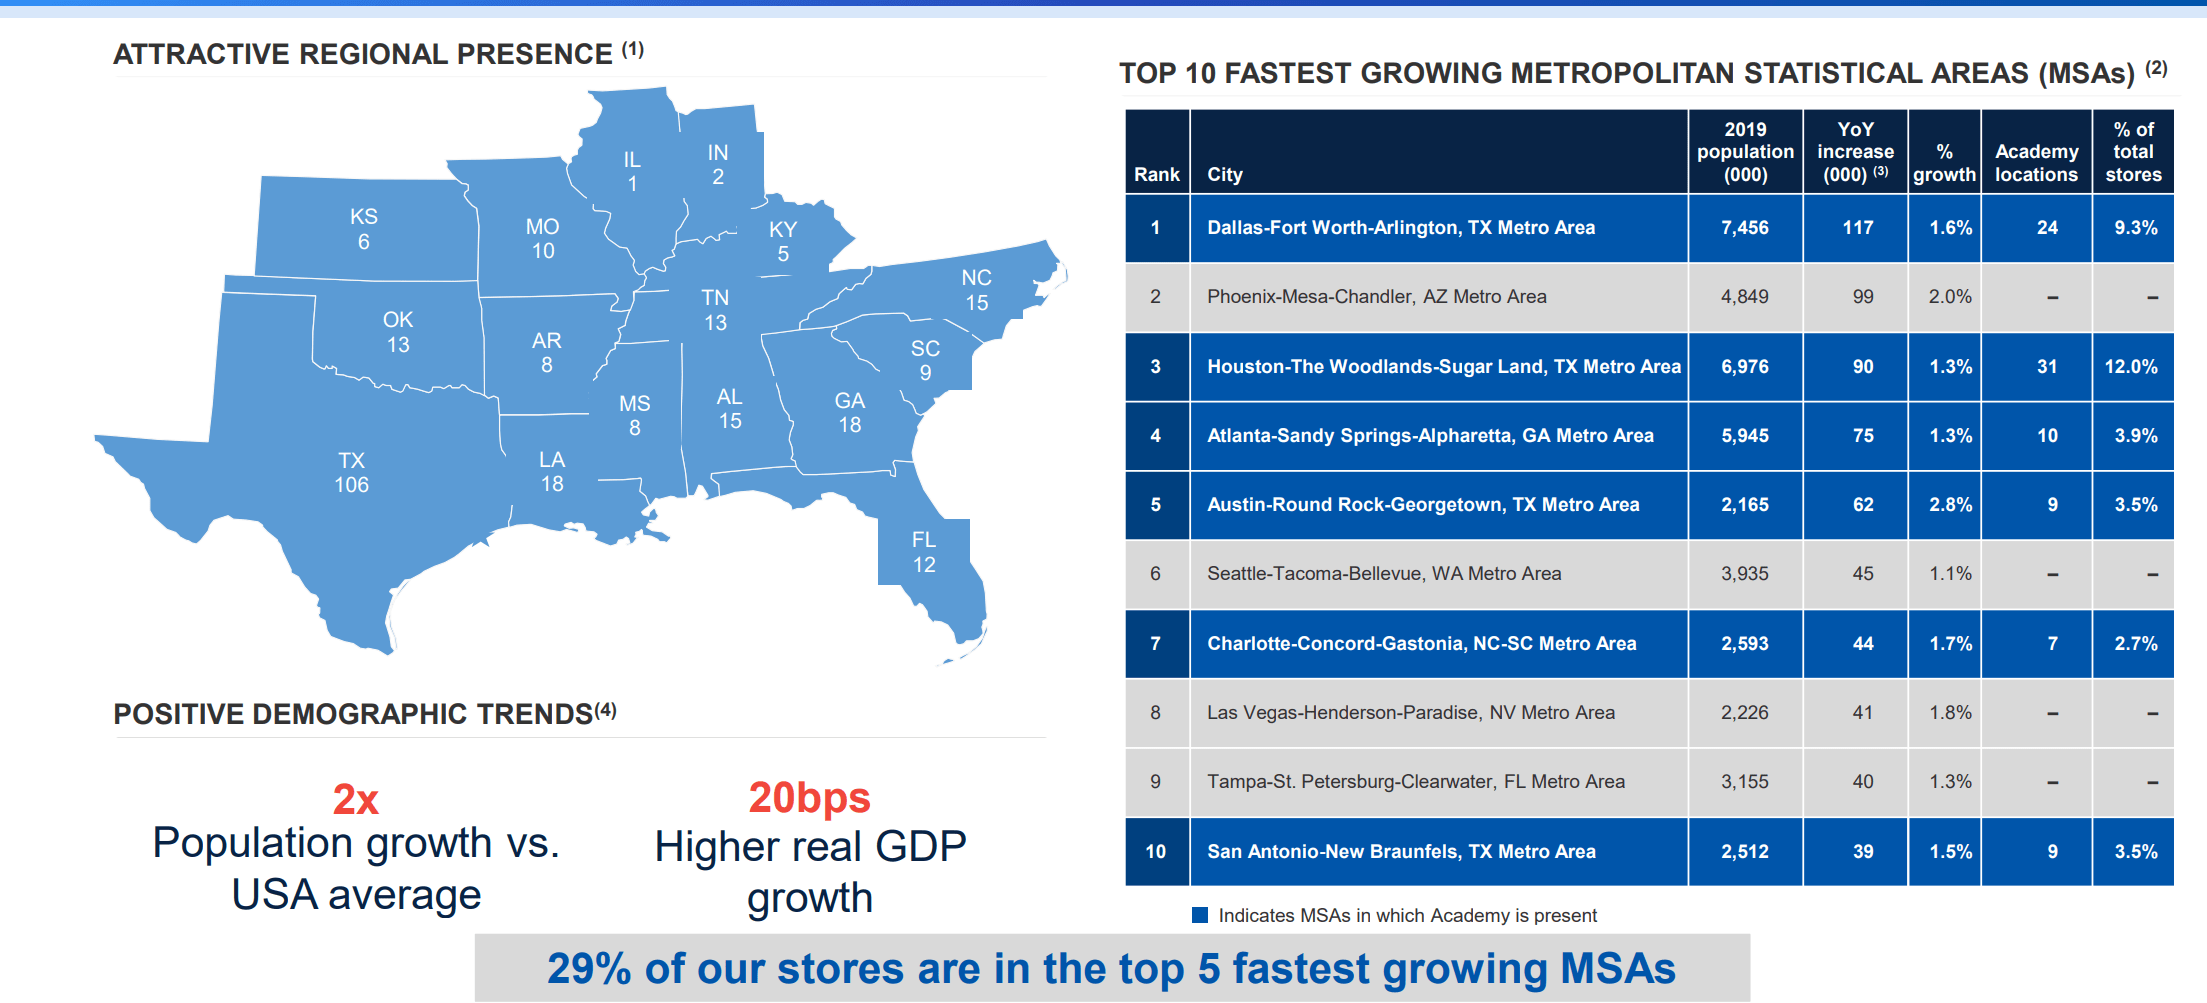
Another thing I really like about ASO’s geography is that it still has plenty of room to grow in the United States. It is clear that the only market that may seem saturated is Texas, although, as the company reported in its 2020 Annual Report, it is starting to develop a smaller store format. In fact, in 2019, the company opened the first small format store (approx. 40,000 square feet) in Dallas, TX. It experienced 28% higher sales per square foot and 37% higher inventory turns that the average store ($311 per sq. ft. and 3.89x inventory turns). From this experiment, the company decided that this will be the format to open new stores in urban and less dense areas. This will open up new possibilities already in Texas and will enable the company to penetrate more markets in different states.
To increase its store base is one of the main goals the company wants to pursue in order to grow and become the best sports and outdoors retailer in the country.
During the pandemic, ASO stopped new store openings, but, in 2022, the company is back on track and it will have 8 new openings. As Ken Hicks, ASO’s CEO, explained during the Q1 2022 earnings call, the company has a plan to grow in three different ways:
our current plan is to open at least eight new stores this fiscal year and 80 to 100 stores over the next five years. We view this growth in three distinct areas. First, is filling out existing markets to build scale like in Atlanta, where we just opened and plan to open another store later this summer. Second, expanding into adjacent markets like our planned opening in Lexington, Kentucky later this year. And third, opening in new markets. Our current store base is located in only 16 states and all states deserve academy stores. We will be opening our first stores in Virginia and West Virginia as we enter these two new states later this year. […] Each store is expected to have an average return on invested capital of at least 20%. The ramp to maturity is four to five years and the model forecast is stored to be EBITDA accretive creative after the first-year of being open.
I really like this strategy because I think the company is planning carefully its expansion without rushing into new markets before having full control and penetration of the existing ones. Meanwhile, it has worked out a model that enables it to build new stores whose profitability has an impact on the EBITDA after a year thus obtaining considerable and perceivable results in a rather short time.
How much does it cost to open a new store? As ASO stated in its 2021 Annual Report:
- We expect capital expenditures for fiscal year 2022 to be approximately $140.0 million.
- Investments in new stores and store relocations are expected to account for approximately 30% of the planned cash outflow.
- The result is simple: the company will spend around $42 million to open 8 new stores. This means that each store costs approximately $5.25 million.
Now, we have to compare this cost to the results a store can achieve. How much does a store earn? In 2020, net sales per store reached $22 million, with an average sales per square foot of $311 and an average EBITDA per store of $2.3 million (a 10% margin). In 2021, net sales per store reached $26.1 million and the average EBITDA per store was $3.9 million (a 15% margin). This means that the average sales per square foot reached $369.
In the Q1 Presentation, ASO gave its guidance for the fiscal year, claiming it should have net sales around $6.5 billion, a 3% decline YoY. This is due to very tough comparables and it actually is a strong guidance that plans on consolidating the outstanding pandemic-driven gains. In any case, assuming that ASO will open 8 new stores, we would have net sales per store at $24.3 million. We could take an EBITDA margin of 12.5% right in between the two from 2020 and 2021. This gives an average EBITDA per store of $3 million.
This means that the ratio capex/EBITDA per new store is under 2, which is nothing other than saying that it takes ASO less than 2 years of EBITDA to make up for the opening cost.
Net leverage
Before its IPO, ASO had very high debt. The graph below shows the path that the company followed before its IPO. We can see that from 2017 to 2019 the company had already managed to reduce its net debt/EBITDA ratio from 5.2x to 4.1x. However, it is in 2020 that this ratio improves quickly, coming down to 0.7x thanks to a debt reduction of $1 billion. What happened? Thanks to the IPO, the company raised enough cash to pay most of its debt and strengthen its financial position.
ASO Investor Presentation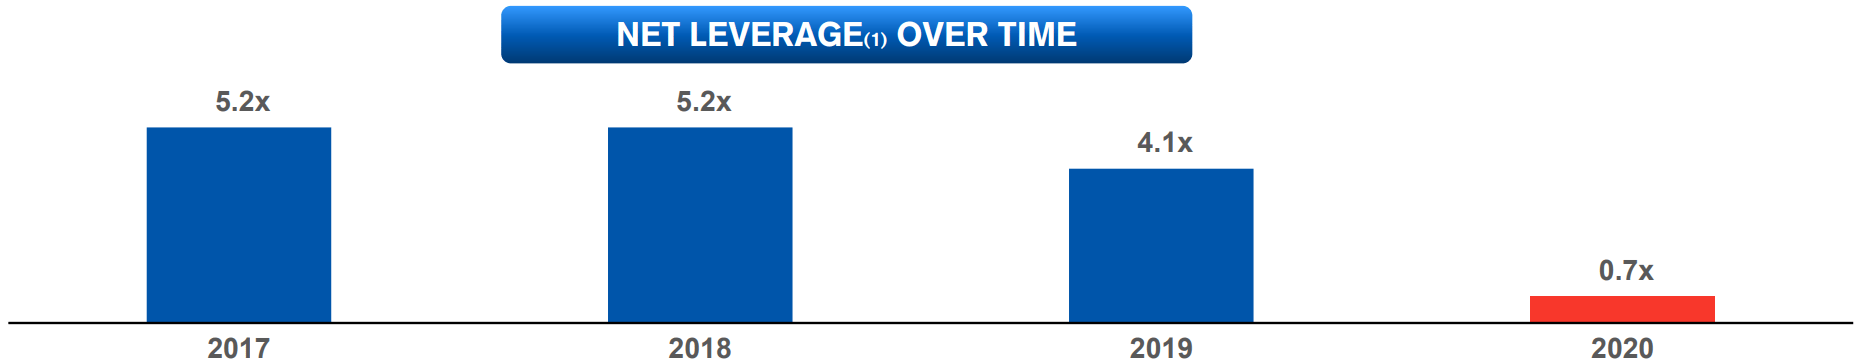
At the moment, the company has $1.3 billion in net debt. With a 2021 EBITDA of $1 billion, the ratio is still a very healthy 1.3x. Since I look for companies with a ratio below 3, I am completely fine with ASO’s financial position.
In its first annual report after the IPO, ASO wrote the following words about the results shown above and what the company’s aims will be for the future:
We also strengthened our balance sheet by reducing our long-term debt by $630 million and extending our remaining debt obligations through 2027.
This led to S&P Global Ratings upgrade of ASO’s debt ratings, bringing it up to BB- with the following explanation:
Academy has consistently reduced debt since its initial public offering in October 2020, deleveraging by about $800 million in debt. Leverage is now in the mid- to high-1x range recently compared with the low-4x area prior to the initial public offering. Looking ahead, we expect the company to continue to generate healthy cash flow, with meaningful free operating cash flow of more than $400 million. While we expect the company to use most of its excess cash flow for shareholder initiatives, noting the recently announced $500 million share buyback program, we also expect Academy to fund these initiatives using internally generated cash and maintain leverage in the 2x range.
In the past year, ASO continued to generate sustainable cash flow, which has allowed it to strengthen its balance sheet by reducing debt and reward its investors by repurchasing $411 million of common stock.
Brands and seasonality
Another aspect I really like about the company is that it is well diversified as per season exposure, brands sold, and goods categories.
As we can see below, no season accounts for more than 28% of annual sales, showing that the company’s merchandising creates a balanced sales mix. No category accounts for more than 32% of net sales and these are also evenly split apart between male and female customers.
ASO Investor Presentation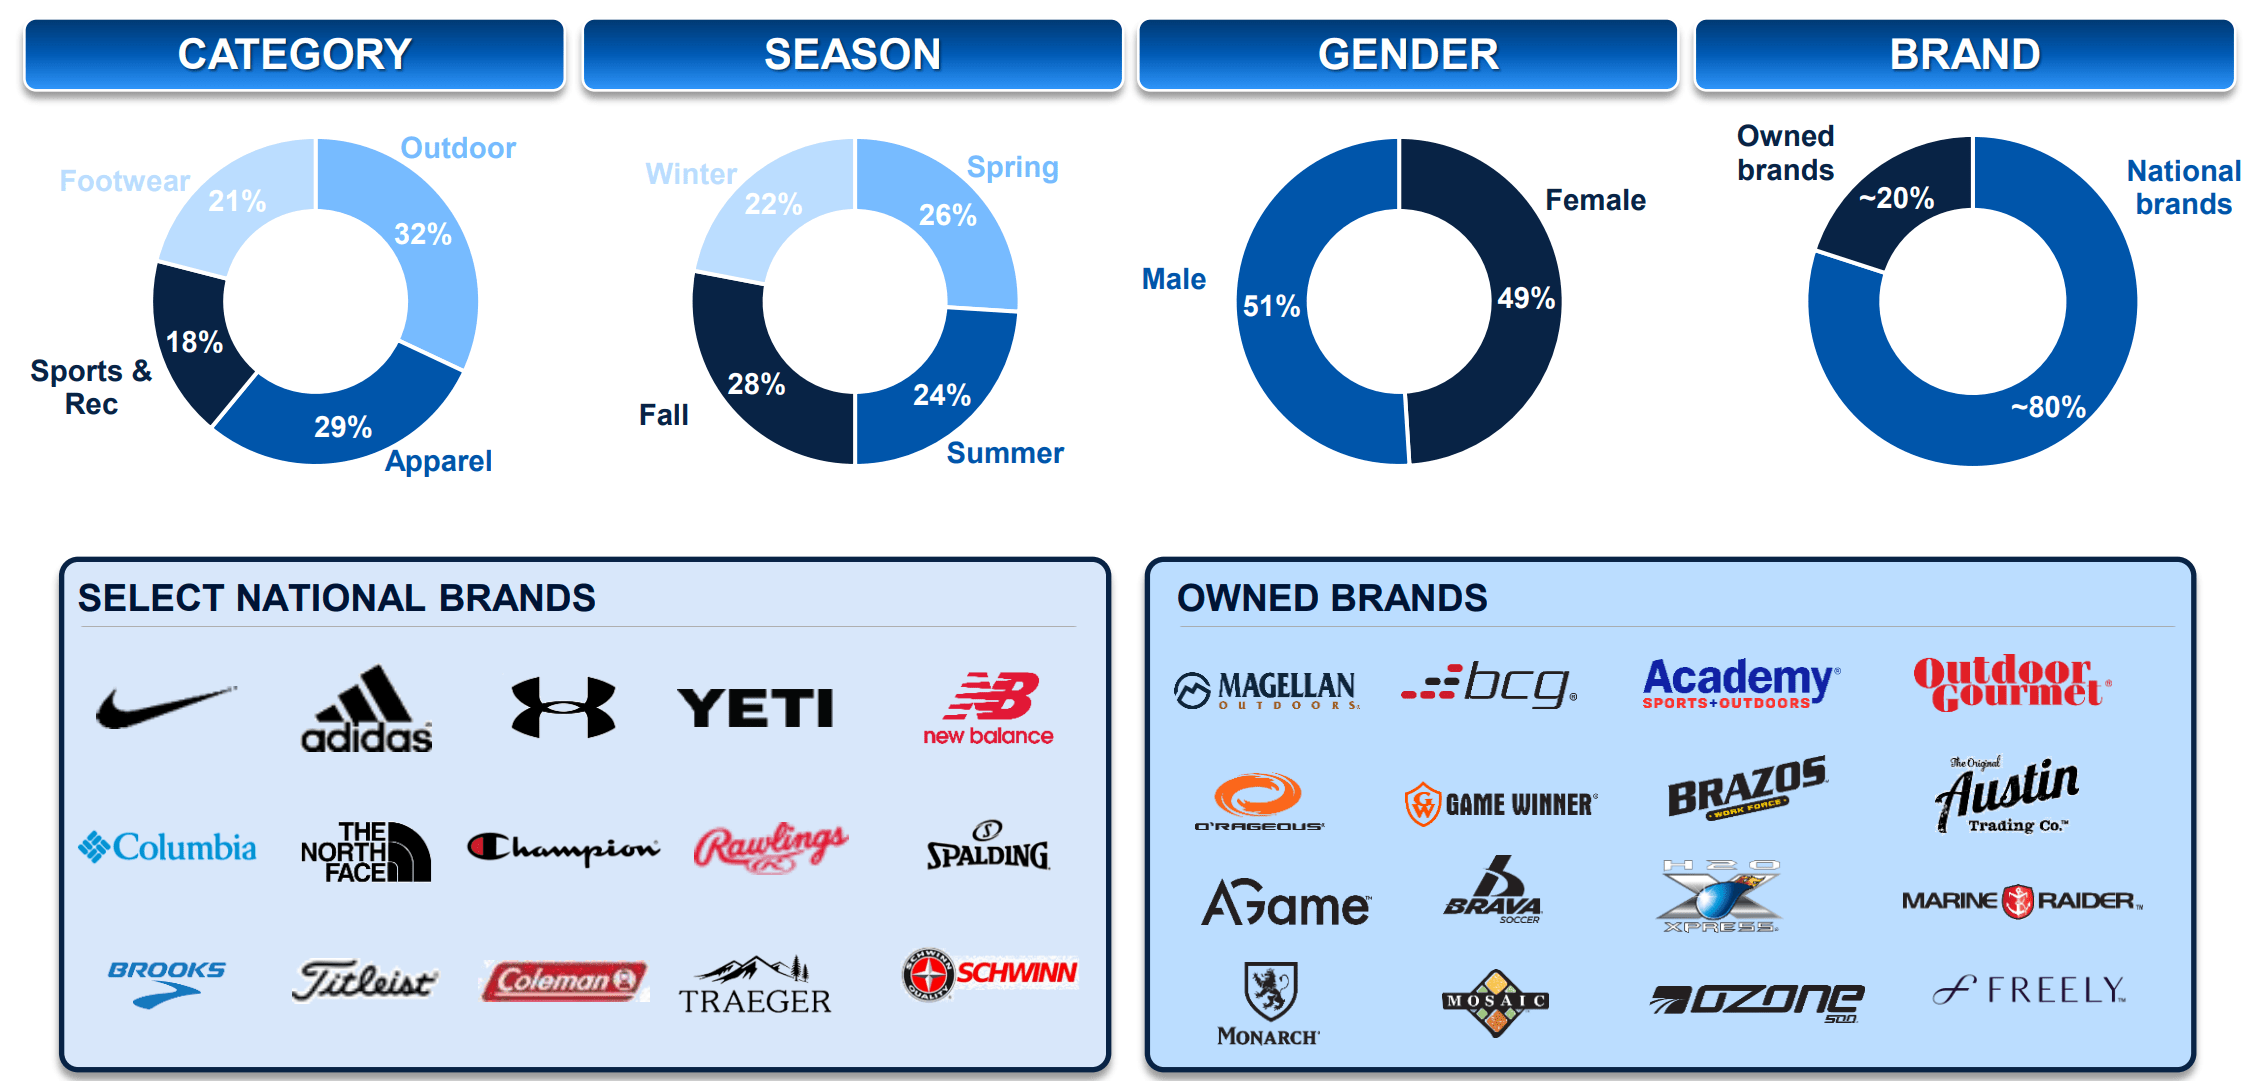
Regarding brand exposure, in its 2021 Annual Report, the company stated that sales of each of its top three largest national brands grew approximately 25%. Overall, sales of nine of its top 10 national brands grew by double digits, while no vendor accounted for more than 11% of sales. National brands account for 80% of annual sales, but the company controls directly 20% of its sales through owned brands such as Magellan.
E-commerce
During the pandemic, ASO saw its e-commerce grow significantly to the point that from the first quarter of 2019 to the last Q1 of 2022 sales are up 375%. Most importantly, the company knows that 39% of e-commerce sales in 2020 came from new households that became new customers who had never had any relationship with the company. This is one of the reasons why the company knows that it can indeed consolidate its outstanding results in the past two years without fear of seeing a bubble bursting. In Q1 2022, e-commerce sales were up 18% YoY, showing that the company is still growing even after the pandemic faded away. At the moment, 9.5% of the company’s sales come from this channel.
Shareholder return
In 2021, the company repurchased $411 million in common stock. In addition, during Q1 2022, the Board of Directors approved a three-year repurchase program of $600 million, bringing the total amount available for share repurchase programs to $700 million.
Moreover, ASO also declared for the first time a dividend of $0.075 per share which has been paid for two consecutive quarters. The forward yield is only 0.66%. However, the payout ratio is also very low at 2% and the free cash flow yield is extremely high since it is currently around 12.4%.
This means that the company has plenty of room to grow its dividend and I would be surprised in case ASO will not hike it by at least 10% within 2-3 quarters.
This is why I purchased the stock in my dividend growth portfolio since I expect the company’s growth to support a dividend that has just been initiated and that I expect to grow substantially in the next years.
Q1 Results and Q2 Forecast
In Q1 2022, ASO reported that net sales decreased YoY from $1.58 billion to $1.47 billion, a 7% decrease. However, gross margin was at 35.5%, very close to the 35.7% of the same quarter last year. EPS was 8.5% lower YoY from $1.89 to $1.73 and comparable sales decreased 7.5% YoY.
These results could be alarming. However, when we consider the very tough comparables and, most importantly, the results ASO was achieving in 2019, we see a company that is clearly growing. In fact, compared to Q1 2019, comparable sales are still up 36%. Since 2019, the gross margins have expanded by 600 bps.
Risks
The major risk I see for this investment is that the planned number of new stores will not be opened. However, the only event that so far has been able to stop this process has been the pandemic. Therefore, even in case of an economic slowdown, I don’t see Academy stopping its expansion.
Being a retailer, Academy could also be affected by an overall decline in the health of the economy and consumer discretionary spending. However, so far, consumer spending has been strong and even though we are in a technical recession, I still think it should be a mild one since the unemployment rate is at its lows and wages have increased. In any case, even though Academy may see a weaker consumer spending, its new openings should make up in terms of revenue for the sales per store lost during the recession. Furthermore, the need for sports and outdoors goods is supported by an overall trend that encourages people to live a healthy lifestyle.
Valuation
The stock trades currently at $46 per share, close to its ATH. However, if we look at the main metrics, the stock still appears very cheap. In fact, it trades at a fwd P/E of 6.5 and its fwd EV/EBITDA ratio is 5.5. Its fwd price/free cash flow ratio is 6, which is about 46% below the sector average.
Here is the discounted cash flow model I ran. I projected very low revenue growth into the future, with a 3% decrease for 2022 and then an upward 5% movement in 2023 that slows down to 3.5% revenue growth by 2031. Of course, if we consider the fact that Academy is planning to increase by 30% to 40% its stores, we could plug in more aggressive numbers.
My other assumption is that Academy will keep its EBITDA margin around 12.5% and its capex around 2.4% of revenue. I then used three possible exit multiples that are still in the conservative range.
Author, with data from Seeking Alpha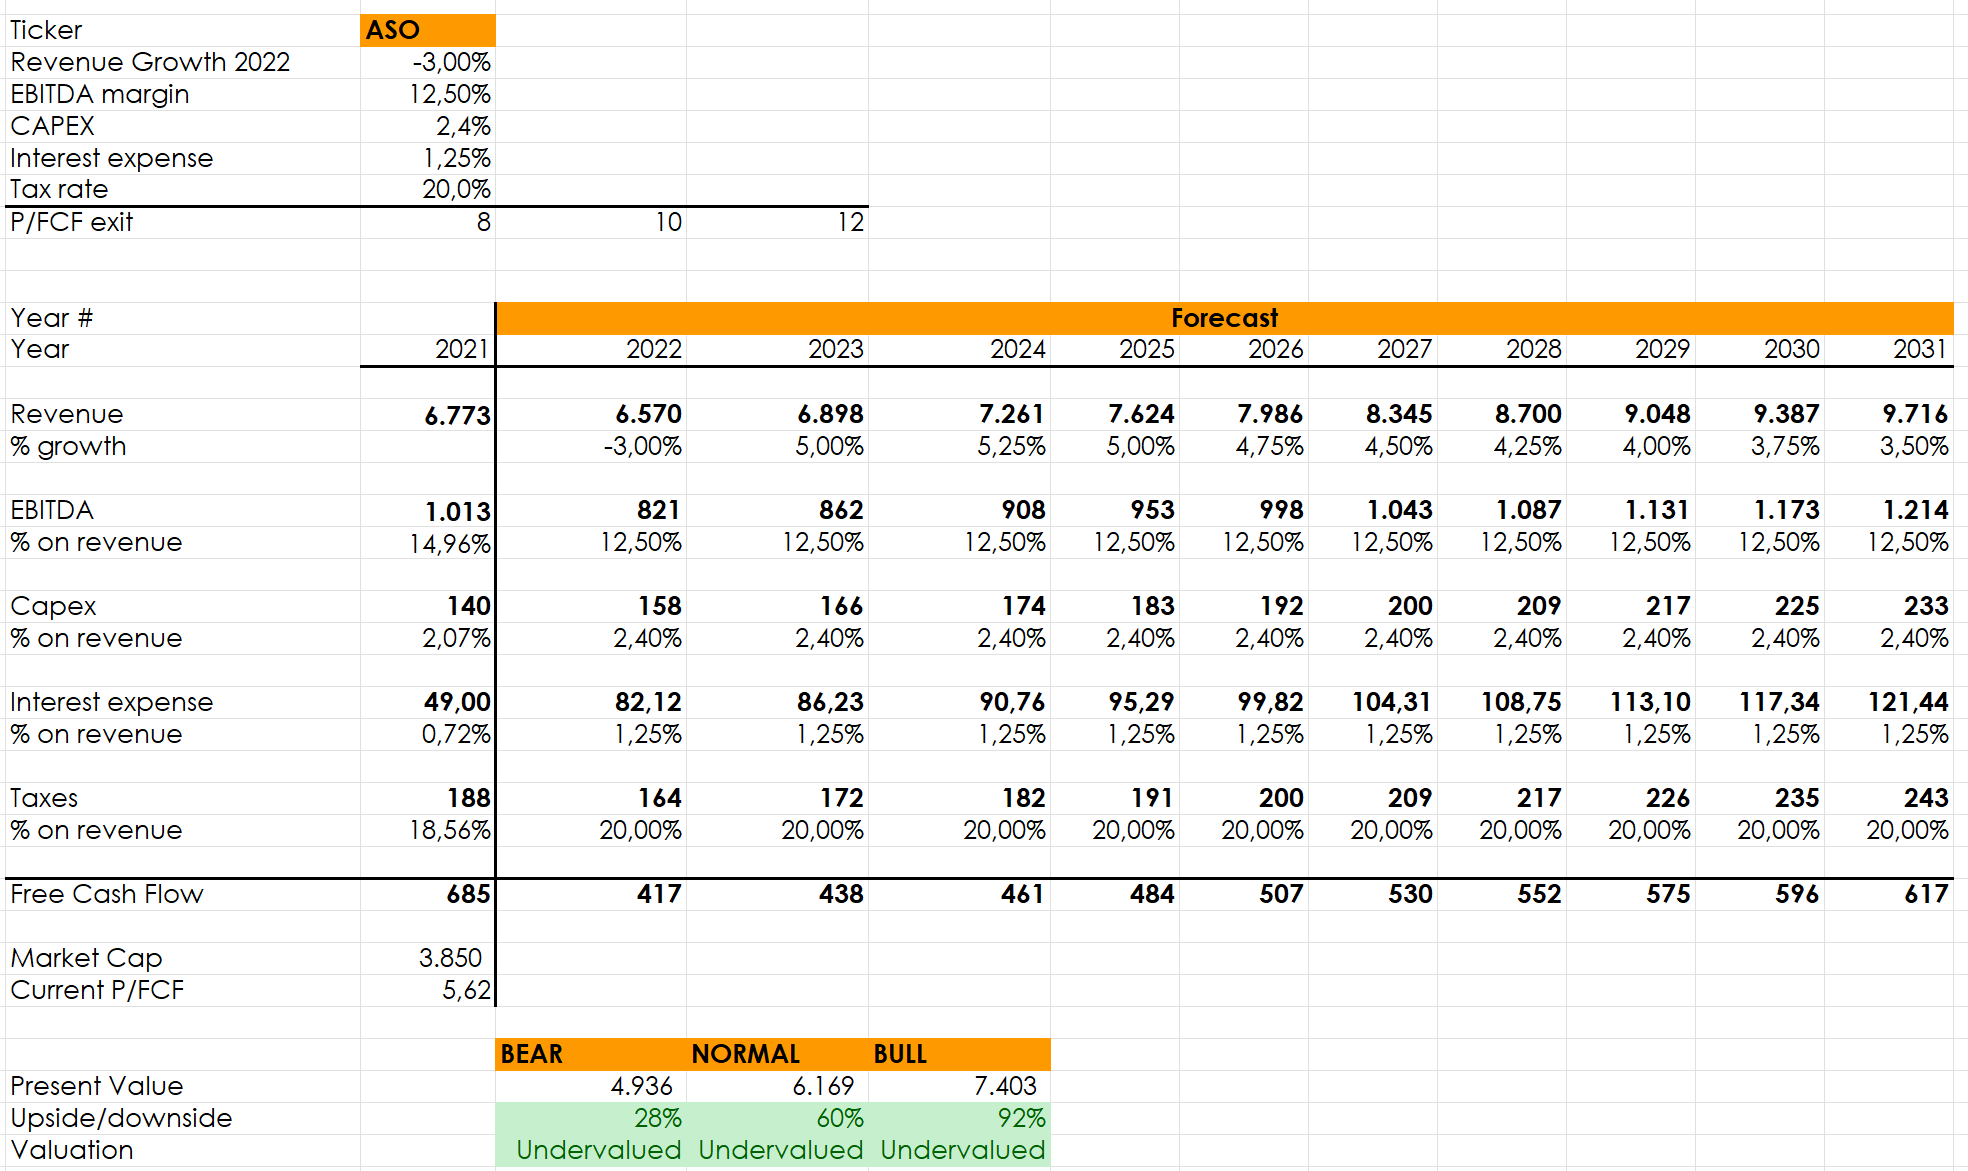
As we can see, Academy results undervalued in all three scenarios. In a bull case, it could actually come close to double the current valuation, which I actually consider a reasonable outcome given the company’s size and its future goals.
Conclusion
I tried to show the main aspects I like about Academy: room to grow, solid balance sheet, profitability, high free cash flow yield, shareholder return, and undervaluation. All these combined make me rate the company as a strong buy and made me start a long position that I plan to increase during the next few months.
Be the first to comment