

jetcityimage/iStock Editorial via Getty Images
Introduction
AmerisourceBergen Corp. (NYSE:ABC) is one of the largest global pharmaceutical sourcing and distribution services companies that specializes in the distribution of branded and generic pharmaceuticals and over-the-counter healthcare products. It is one of the “big three” – primary drug distributors in the U.S. – with McKesson Corp. (MCK) and Cardinal Health (CAH). The company also operates international businesses through its segments AmerisourceBergen Alliance Healthcare and Global Commercialization Services, but related revenues represent only about 5% of total 2021 revenues ($214 billion). ABC also distributes animal health-related products, but this segment is also comparatively small, with $4.7 billion in revenues in 2021 (2.2%). The company also offers marketing, merchandising, and administrative support services to smaller pharmacies and distributors.
ABC operates a – at first glance – commoditized middleman’s business. However, the transportation of highly-valued pharmaceuticals is heavily regulated and thus ABC, MCK and CAH can be seen as operating in a consolidated oligopoly. With TTM revenues of $214 billion, ABC is a bit smaller than MCK ($264 billion) but larger than CAH ($177 billion). The companies’ main value proposition is simplification of logistics. The “big three” can negotiate very effectively because of their bulk approach and their well-developed distribution networks. However, this means that the pharmaceutical distributors have to maintain significant working capital accounts which makes cashflow productivity a challenge.
In this article, I will discuss the company’s fundamentals, growth prospects and risks. I will detail, why I consider ABC the best-in-class pharmaceuticals distributor and outline its potential as a dividend growth stock at the current share price of $140. The article discusses financial data of at least the last decade and where applicable, I do take guidance or the most recent quarterly results into account.
Growth And Profitability
As a sourcing and distribution services company for pharmaceuticals, ABC is relatively uncorrelated with business cycles and typically grows revenues at a rate, in-line with pharmaceutical companies. ABC’s revenue compounded annual growth rate (CAGR) since 2010 is an astonishing 9.6%, and the growth rate did not slow in more recent years. Quite the contrary, taking into account guidance for fiscal 2022, also the three-year CAGR is almost 10%. Competitors McKesson and Cardinal Health have seen annual revenue growth of about 9% and 5%, respectively, over the past decade.
The stable revenue trajectory is an indicator that the sector in general – and AmerisourceBergen in particular – has pricing power due to the strong position as a highly regulated intermediary. However, the downstream positioning of the companies and the level of revenues already suggest that profit margins must be fairly thin. ABC’s 12-year average gross and adjusted operating margins are 2.9% and 1.0%, respectively. Competitors MCK and CAH exhibit very similar operating margins.
ABC’s gross margin remained very stable since at least 2010, but adjusted operating margin declined from around 1.5% to 1.0%, mostly due to employee severance payments. Note that I adjusted operating earnings for the litigation-related expense in 2020. In fiscal 2020 (ending September 30, 2020), the company reported a GAAP operating loss of $5.14 billion due to severance and litigation costs of $6.81 billion. This was a (at first) mostly non-cashflow-relevant charge because the settlement will be paid over the coming years. The litigation-related costs are related to the company’s opioid lawsuits, and the three distributors proposed to pay a combined $18 billion settlement. In recent years, the number of people dying from prescribed, opioid-based painkillers has gone up dramatically. A large number of lawsuits have targeted pharmaceutical companies, but also doctors and distributors. It might appear difficult to understand why the party that only transports the opioid painkillers is being sued, but it can be argued that ABC (as well as MCK and CAH) should have noted the higher prescription volumes in certain areas and acted accordingly. I am not in the position to judge whether the companies did not notice the problem or outright chose to ignore the problem for the sake of increased revenues.
Figure 1: ABC’s historical revenues (own work, based on the company’s 2010 to 2021 annual reports and the most recent earnings presentation)
The company’s free cashflow (FCF) is much more volatile than its top-line, in part due to the thin margin structure. Adjusting FCF for working capital movements (which can be significant for ABC, see above), stock-based compensations (which I assume to result in shareholder dilution or require buybacks to offset dilution) and recurring impairments, yields normalized free cashflow (nFCF). Note that the $6.2 billion charge due to the aforementioned settlements was not cashflow-relevant in 2020, but the liability was decreased by $237 million in fiscal 2021, thereby reducing cashflow from operations. Of course, I did not add this payment back when calculating nFCF, as the liability from the litigation will still be cashflow relevant for several years.
Nevertheless, ABC continues to generate strong nFCF, and taking guidance of $2.25 billion for fiscal 2022 into account, nFCF grew at a 12-year CAGR of 6.0%, a very respectable growth rate indeed. The fact that ABC’s nFCF margin trends very much in line with the company’s operating margin suggests that the cashflows are stable and the company does not suffer from operational problems. Compared to McKesson, AmerisourceBergen’s free cashflow margin is a tad weaker, which signals that the company has potential room for margin expansion.
Figure 2: ABC’s historical normalized free cashflow (own work, based on the company’s 2010 to 2021 annual reports and the most recent earnings presentation)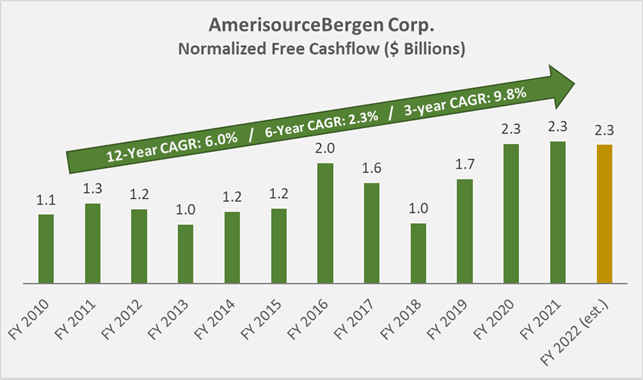
Focusing on the efficiency of working capital management, which is certainly a key component in assessing a pharmaceutical distributor’s positioning, I monitor inventory days (ID) and cash conversion cycle (CCC), a combination metric that takes into account ID, days sales outstanding (DSO) and days payables outstanding (DPO). A review of Figure 3 and Figure 4 clearly shows that ABC exhibits the best working capital management. All three companies improved their cash conversion cycle in recent years, and MCK is now performing almost on par with ABC. Nevertheless, even a slight lead is valuable in this sector due to the characteristically low profit margins. CAH continues to be the laggard and this is certainly also evident from its underperformance in terms of share price. The very similar IDs indicate how crucial it is to maintain optimal relationships with both suppliers and customers. In this context, it also seems worth mentioning that CAH appears to be in a comparatively less-favorable bargaining position, as is indicated by its shorter payables period of currently around 50 days, whereas ABC and MCK take 57 and 56 days to pay their suppliers, respectively.
Figure 3: ABC’s, MCK’s and CAH’s historical cash conversion cycles (own work, based on each company’s 2010 to 2021 annual reports and the most recent quarterly reports)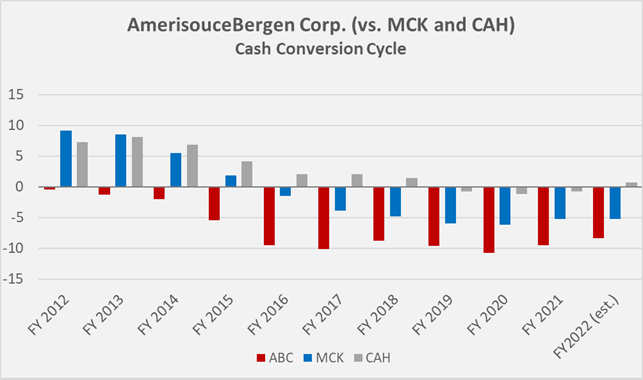
Figure 4: ABC’s, MCK’s and CAH’s historical inventory days (own work, based on each company’s 2010 to 2021 annual reports and the most recent quarterly reports)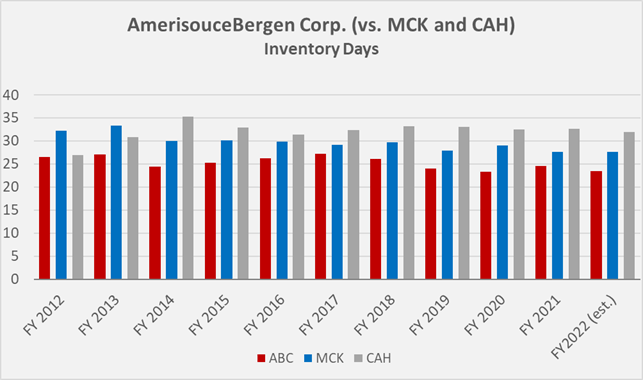
AmerisourceBergen’s excellent working capital management gives rise to a strong cash return on invested capital (CROIC), well above the company’s weighted average cost of capital (WACC). The metric takes nFCF instead of net operating profit after taxes into account. Figure 5 shows ABC’s historical ROIC and CROIC in comparison to the company’s WACC, which has been calculated using an equity risk premium of 5%. AmerisourceBergen typically generates a return far higher than its WACC, thereby creating shareholder value. However, the relatively stable performance should not be taken for granted, and potential operational inefficiencies will likely have a disproportionate effect on cashflows. Therefore, it is important to monitor the company’s operations closely.
Figure 5: ABC’s historical (cash) return on invested capital, compared to its weighted average cost of capital (own work, based on the company’s 2010 to 2021 annual reports and the 2Q 2022 quarterly report)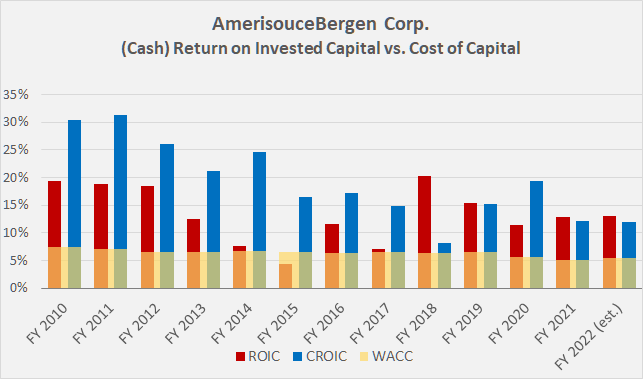
Balance Sheet Quality
As a non-cyclical, well-managed and highly-regulated business, it does not come as a surprise that ABC’s balance sheet is quite strong and the company’s long-term debt has been rated A- with a stable outlook by Fitch Ratings. Over the last decade, AmerisourceBergen’s net debt to nFCF has mostly been below 1x nFCF. In 2021, the leverage ratio increased to 2.4x nFCF, due to the acquisition of a majority of Walgreens Boots Alliance’s (WBA) Alliance Healthcare businesses.
ABC’s upcoming maturities appear concerning at first sight because most of the company’s debt is due in the next couple of years. However, the maturity ladder in Figure 6 should be seen in context with ABC’s cashflow and the overall relatively low amount of debt. The company’s weighted average interest rate is currently 2.67%, which is very low indeed. This is mainly attributable to the company’s $1.5 billion of 0.737% notes which are due already next year. It, therefore, appears reasonable to assume that ABC’s interest burden will increase. However, since its interest coverage ratio (Figure 7) is pretty conservative for such a resilient business, I would not overemphasize ABC’s interest rate risk in the current inflationary environment. Typically, the company spends only around 7% of its pre-interest nFCF on interest expenses.
Figure 6: ABC’s upcoming debt maturities (own work, based on the company’s 2021 annual report)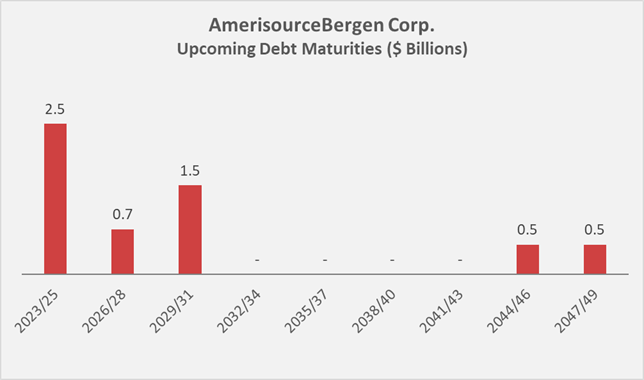
Figure 7: ABC’s historical interest coverage ratio (own work, based on the company’s 2010 to 2021 annual reports)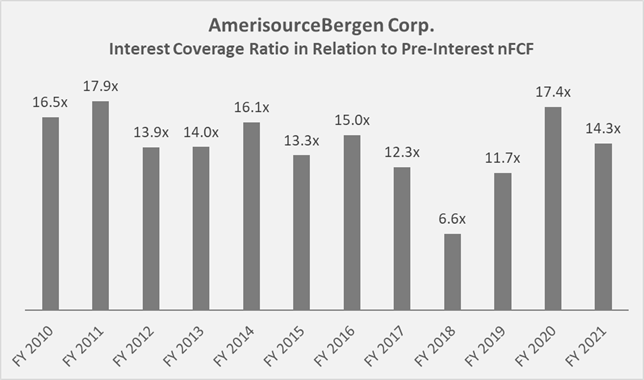
Shareholder Returns And ABC’s Potential As A Dividend Growth Stock
AmerisourceBergen began paying a dividend in 2001 and has increased its payout to shareholders for 18 consecutive years. It currently pays a quarterly dividend of $0.46, which translates to an annualized yield of 1.3% at a share price of $140. ABC has been growing its dividend much more aggressively in the past (Figure 8) and it appears that the company will continue to increase its distribution by $0.08 per year, as it has done since 2017. This would theoretically translate to an increase by 4.3% in 2022, 3.7% in 2026 and 3.0% in 2032. It appears reasonable to expect no more than a 2.0% yield on cost by 2032 – not a very compelling yield for a prospective dividend growth stock. The current yield of 1.4% is also below the company’s long-term average dividend yield of 1.6%, suggesting that the stock is overvalued in this context. Investors’ flight to value since the beginning of 2022 and the increasing clarity related to the opioid litigations have helped the stock appreciate in price, from around $120 in December 2021.
Figure 8: ABC’s historical dividend growth rate (own work, based on the company’s 2010 to 2021 annual reports and own estimates)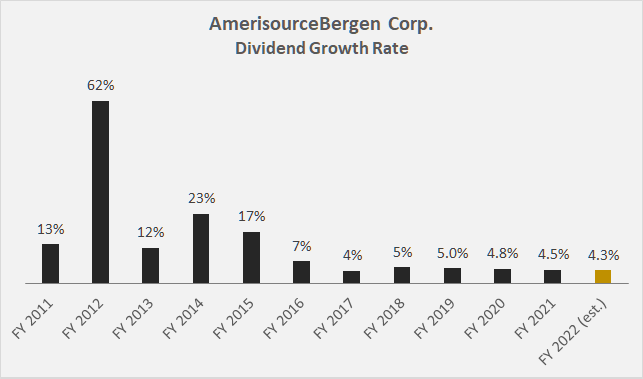
Besides the dividend, ABC also returns cash to shareholders via share repurchases that more than offset dilution due to stock-based compensations. Since 2010, the company, on average, retired 2.8% of its fully diluted shares outstanding per year, which translates to an overall boost to earnings per share by almost 38%. Critics might argue that this can be seen as a form of financial engineering and that the company is imitating earnings growth (on a per share basis) through debt-funded share repurchases. However, the company generated $17.8 billion in nFCF over the last twelve years and only spent $10 billion on buybacks and $3 billion on dividends, resulting in an excess nFCF of almost $5 billion. Clearly, the company did not increase its leverage to fund buybacks, which is another indicator of the company’s sound management culture. As shown above, the company also managed to grow its nFCF at a very healthy long-term growth rate of 6% per year.
Risks
Healthcare costs in the U.S. are high by any means and over the last decades, they increased much faster than consumer price inflation. In this context, the theoretical risk of a healthcare reform and the recently increased rate of inflation should be kept in mind. A healthcare reform will likely limit pharmaceutical companies to increase their prices at or near the rate of inflation (see my related article), and as a middleman’s business that operates downstream, ABC is in a weaker position. However, the company still possesses strong pricing power due to its economies of scale and will most likely continue to be able to pass on price increases to its customers. Nevertheless, even though ABC, MCK and CAH operate in an oligopoly with high barriers to entry, the commoditized connotation of the business of sourcing and distributing pharmaceuticals should be kept in mind. This is also underlined by the fact that ABC’s margins are already very thin and the company needs to ensure that it maintains its top position in terms of operational efficiency.
Valuation
As already noted, ABC appears slightly overvalued compared to its long-term average dividend yield of 1.6%. Other metrics, such as price-to-earnings and price-to-sales (based on current and forward earnings) as well as enterprise value to nFCF and EBITDA (Figure 9) indicate that the shares are approximately fairly valued. At a current P/E of around 17 and a forward P/E of 13 (partly due to buybacks), ABC is definitely not what I’d call expensive. However, it should not be forgotten that the historical valuation, even though it is based on data from 2010 to 2021, is a reflection of one of the strongest bull markets in modern history. Conversely, it could be argued that ABC’s stock price remained depressed for a significant period of time due to the uncertainties related to the opioid litigations, and that period of time is also factored into the valuation.
Figure 9: Relative historical valuation of ABC stock (own work, based on the company’s 2010 to 2021 annual reports and weekly closing share prices observed in the month the company released its full-year earnings)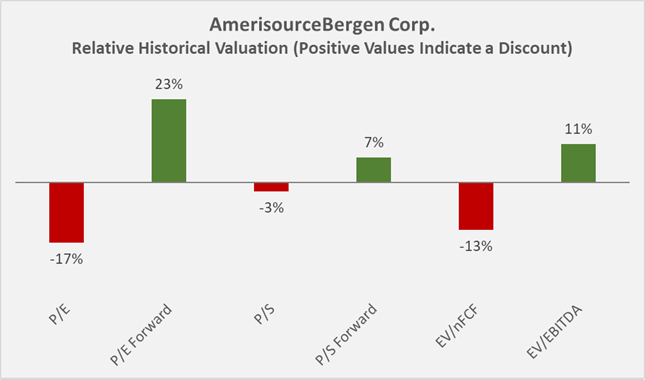
Figure 10 and Figure 11 serve as long-term graphical comparisons of ABC’s stock price and enterprise value (taking into account debt and lease obligations) to nFCF to facilitate understanding of the company’s current valuation relative to its cash earnings.
I think ABC is fairly valued at this point. In the long run, investors who open a position at this level will probably not do badly, but I personally prefer to buy at a discount, such as when the extent of the opioid trial was still uncertain. Sadly, I did not have ABC on my radar back then. However, I am happy to keep the company on my watch list and patiently wait to be able to add this high-quality distribution business to my portfolio upon any weaknesses, i.e., at a share price of $120 or less.
Figure 10: Overlay of ABC’s share price and normalized free cashflow per share (own work, based on the company’s fiscal 2010 to 2021 annual reports and the weekly closing share price of ABC)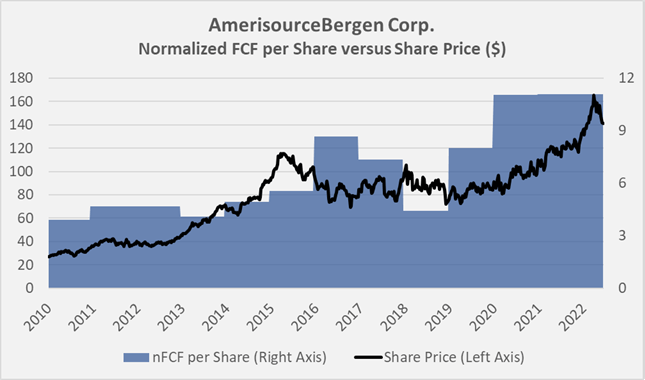
Figure 11: Overlay of ABC’s enterprise value and normalized free cashflow per share (own work, based on the company’s fiscal 2010 to 2021 annual reports and the weekly closing share price of ABC)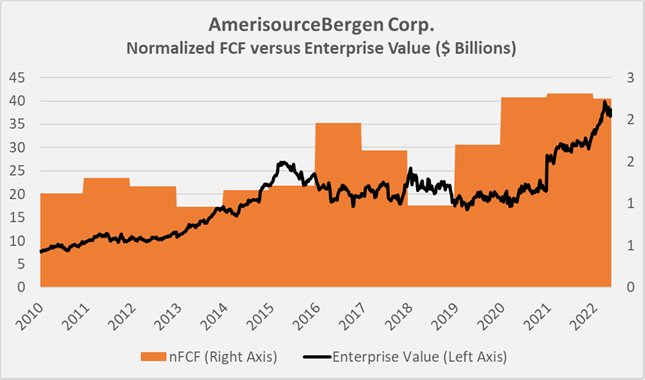
Concluding Remarks
AmerisourceBergen is a high-quality and well-managed distributor of pharmaceuticals in the United States. It operates in an oligopoly with MCK and CAH, and although barriers to entry are high, the business is still only that of an intermediary with the razor-thin margins that come with it. However, compared to its competitors, ABC exhibits the best working capital management, which is the foundation for the company’s comparatively high returns on invested capital. Going forward, it is likely that ABC, like its peers, may face slightly increased challenges due to the downstream location relative to pharmaceutical companies and the likely persistence of the current inflationary environment. Nevertheless, its economies of scale and the associated strong bargaining power give these companies an economic moat and I consider ABC, as the best-in-class drug distributor, a welcome diversification in a portfolio.
Management is shareholder-friendly, but the current relatively low dividend yield, combined with the single-digit dividend growth rate, makes the stock rather unattractive as a dividend growth candidate. Nevertheless, the company is a true sleep-at-night investment and is expected to maintain its prime position and continue to grow cashflow at a healthy pace. Therefore, I see ABC as a total return stock rather than a dividend growth stock. The fact that ABC is not really exposed to business cycles further adds to the conservative nature of this potential investment. Certainly, a prolonged bear market or an outright stock market crash will also weigh on the ABC share price, although probably far less than that of cyclical companies.
Clarity regarding the magnitude of the opioid lawsuits, as well as the increasing popularity of value stocks since the beginning of 2022, have helped the languishing share price quite a bit and I consider ABC fairly valued at $140. Therefore, I am happy to keep the company on my watch list and patiently wait to be able to add this high-quality distribution business to my portfolio upon any weaknesses, i.e., at a share price of $120 or less.
Thank you very much for taking the time to read my article. In case of any questions or comments, I’m very happy to read from you in the comments section below.
Be the first to comment