

Photon-Photos
Wheaton Precious Metals (NYSE:NYSE:WPM) recently reported its third-quarter earnings results, unveiling a mixed bag. Although the mining house reported a GAAP-adjusted earnings beat of 19 cents per share, it also unveiled a non-GAAP earnings-per-share miss of one cent per share and a revenue miss of $17.22 million.
Earnings Results (Seeking Alpha)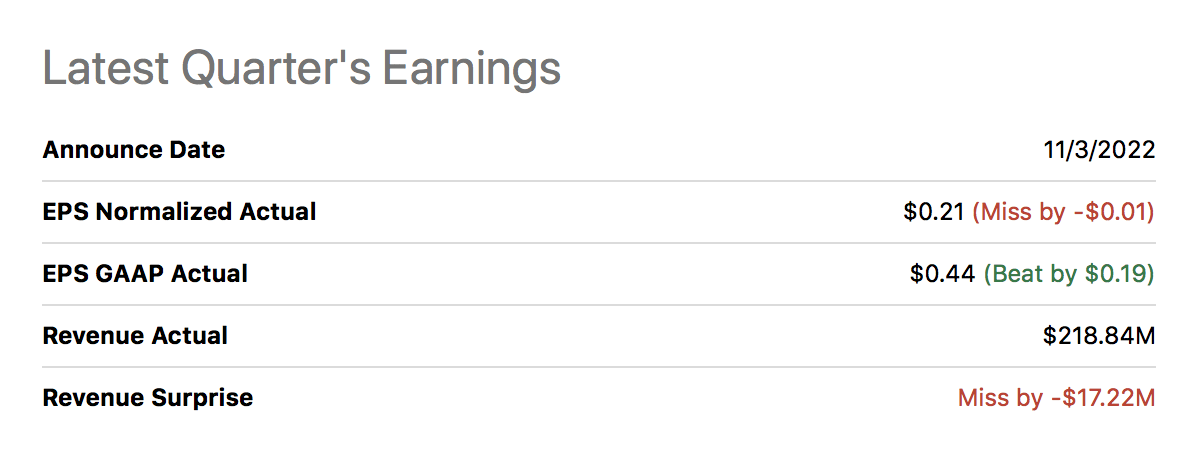
Investors and analysts alike are clearly in a tizzy. The stock spiked by more than 20% in the past months but remains down by nearly 10% for the year. Moreover, whether the stock’s recent recovery is due to a broad-based market recovery or idiosyncratic features remains uncertain.
Today’s analysis uncovers a few key talking points surrounding Wheaton’s third-quarter results and intertwines the results with the current market climate; here’s what we believe will happen to Wheaton’s stock in the coming quarters.
Wheaton Precious Metals Q3 Results – Main Talking Points
Operating Coverage
Wheaton’s third-quarter results contain numerous non-core events, such as the flood it experienced with its Stillwater mine that meant the site was defunct for four weeks. Production was impacted severely, with quarterly gold and silver production slipping by 38% and 37%, respectively. However, this shouldn’t be much of a concern as the material effects aren’t sustainable.
Furthermore, throughput from the Salobo asset was less than anticipated during the third quarter. Nevertheless, the expansion of the Salobo III asset is reportedly 98% complete, which could offset the quarterly shortfalls in the future.
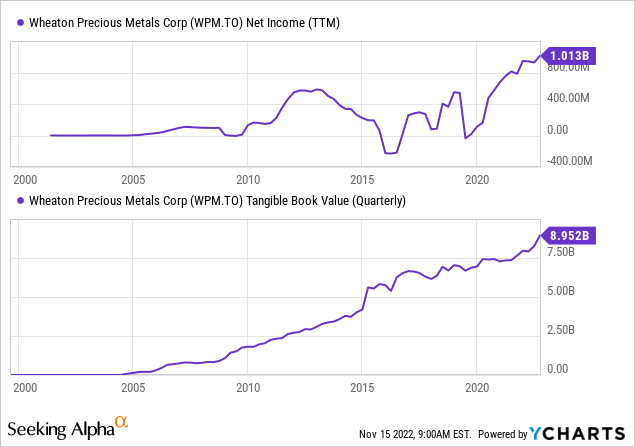
Wheaton’s 88.92% year-over-year increase in CapEx growth is split between expansionary features such as Salobo III and maintenance issues. For example, apart from the Stillwater maintenance cost, Wheaton’s plant maintenance continued during the quarter with a focus on improving reliability. Keep in mind that Wheaton’s residual income and value reached multi-year highs, meaning it can afford to gear up CapEx spending.
Lastly, the company’s Constancia mine experienced quarterly production increases of 8% in silver but a 16% drop in gold. The increase in silver was due to better throughput, whereas the decrease in gold was due to lower material grades from the Pampacancha pit.
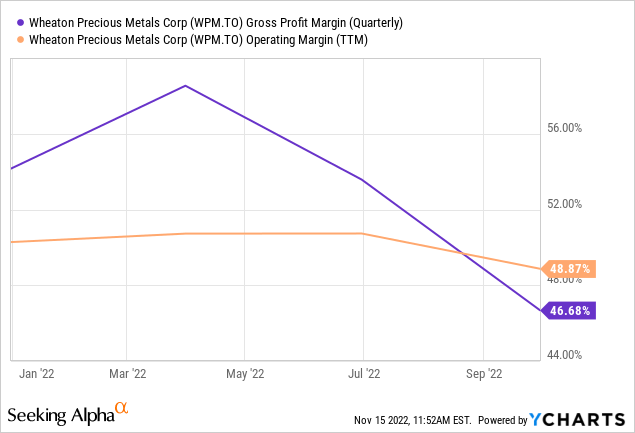
Wheaton Precious Metals
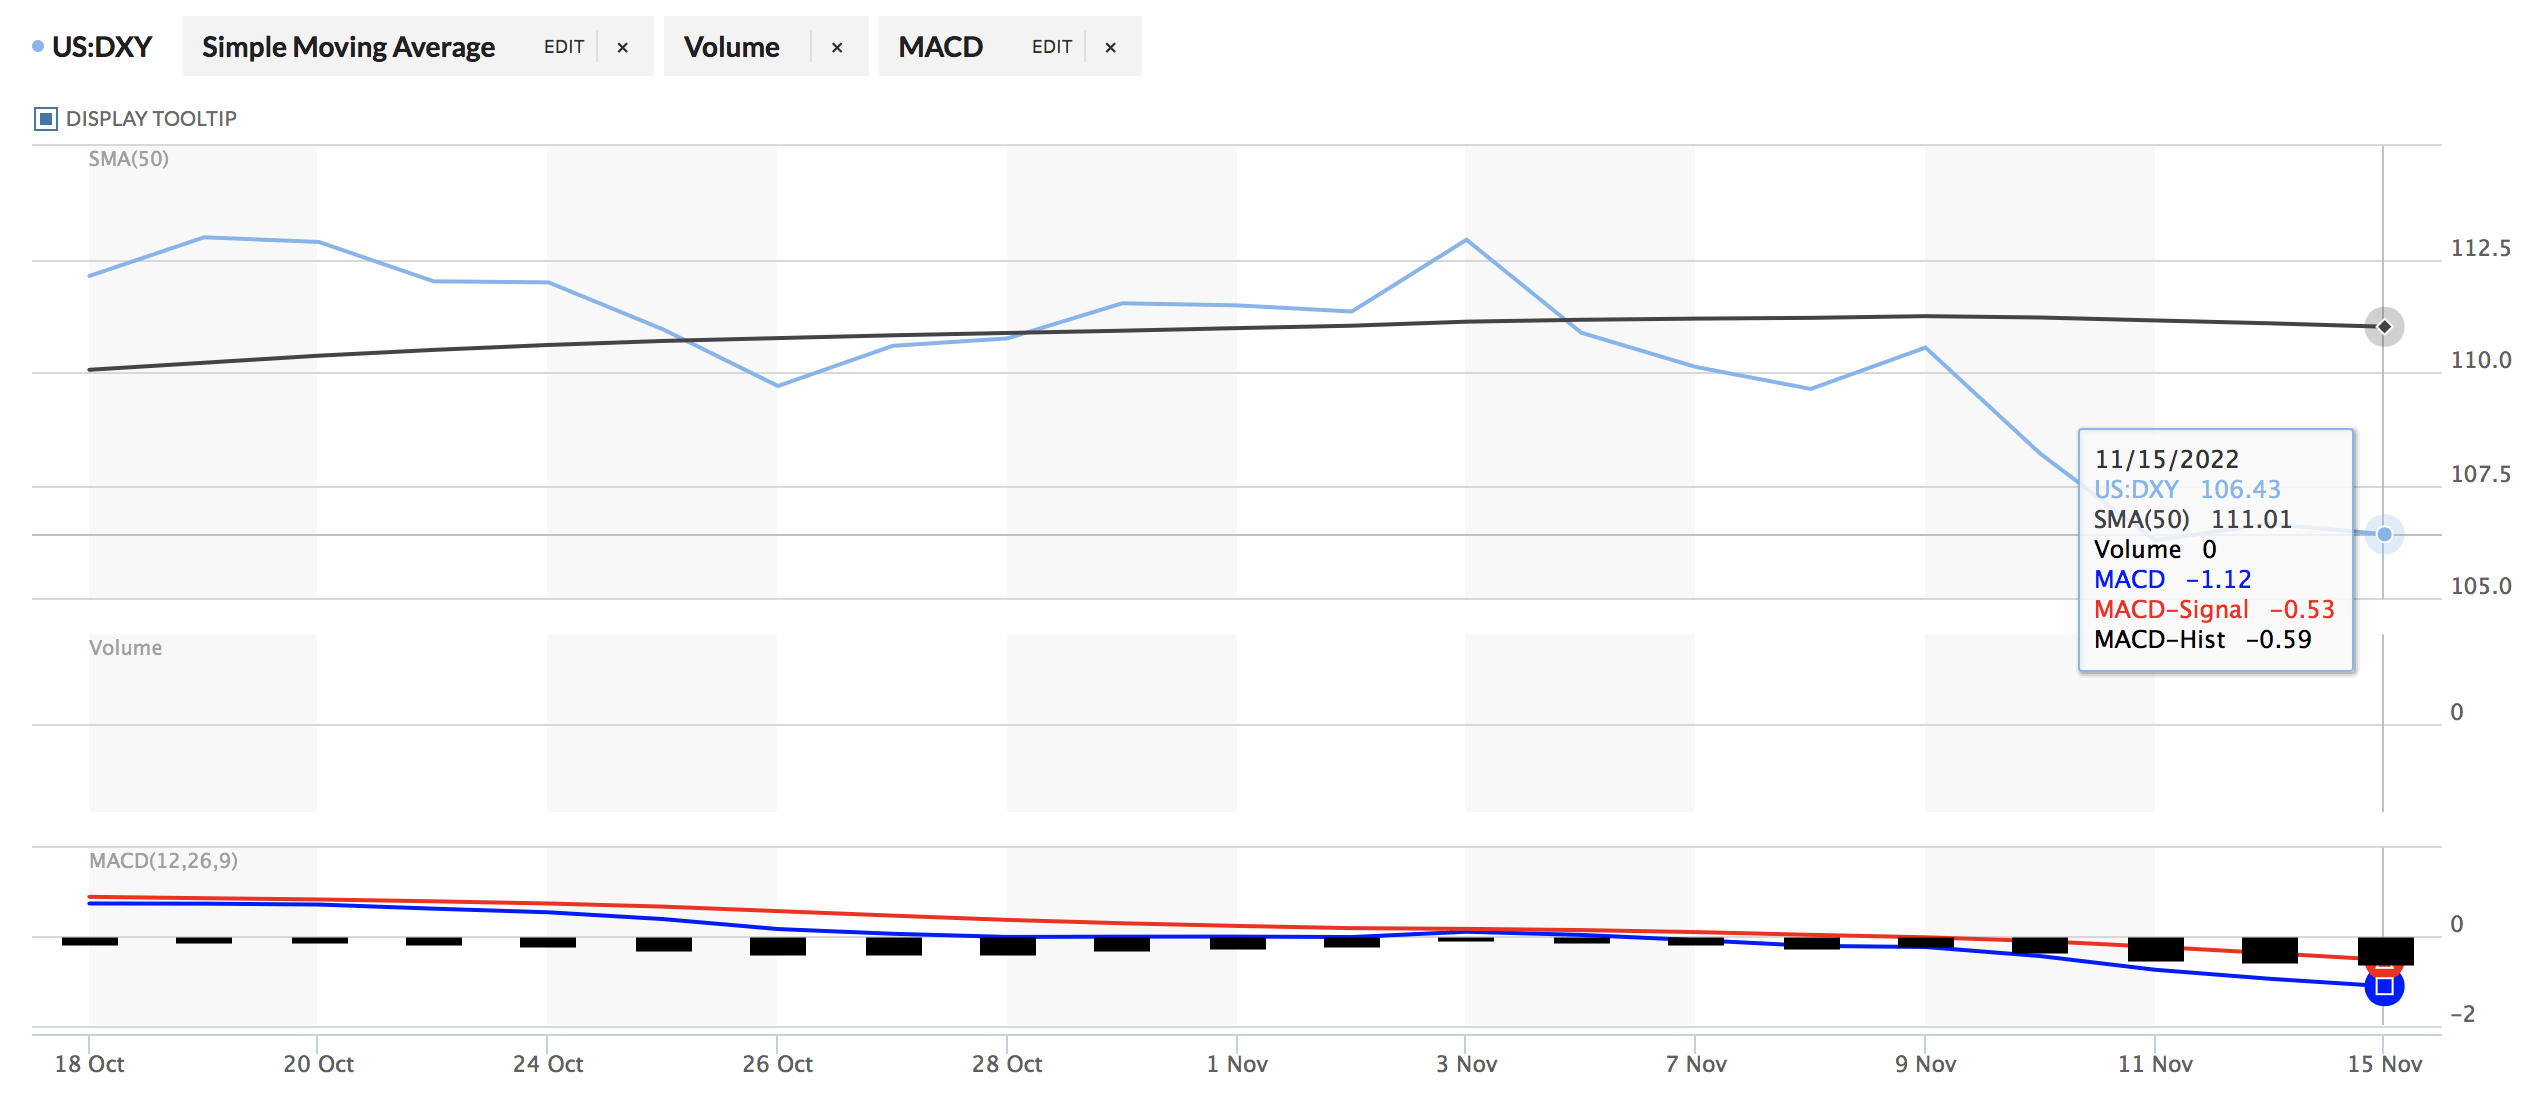
Collectively, Wheaton has recently struggled with receding metal prices, which has dented its operating cash flow. Many market participants believe gold prices could rise given a slowdown in inflation as well as the U.S. Dollar. However, the danger for Wheaton is that softening demand is likely. I say this because inflation is still well beyond the acceptable realms of 2% to 3%, and it could be quite some time before we experience expansionary monetary policies. Thus, fading demand could offset any positives from dollar-induced rising price hikes.
USD Index (MarketWatch)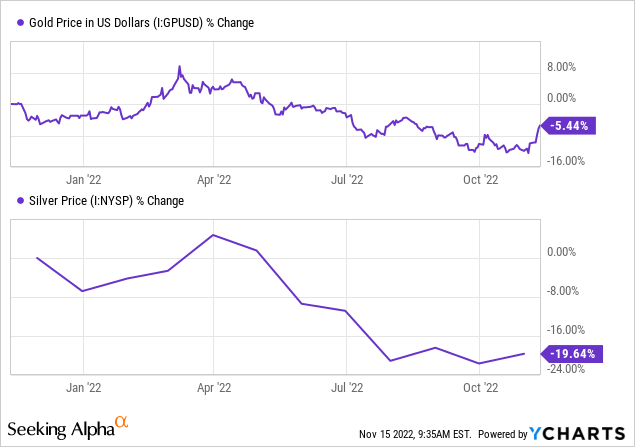
A final operating consideration would be potential input cost trimming. Core inflation, including wages and service costs in North America, could recede significantly with rising interest rates. Thus, allowing Wheaton to potentially ease off some of the margin pressure it’s recently faced. Remember that Wheaton is a vertically integrated company, and low production cost is the business’s cornerstone.
Accounting Recognition
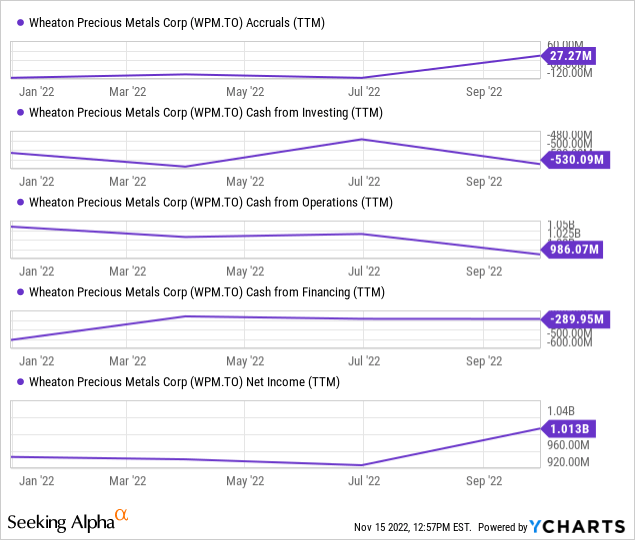
For those that are unaware, earnings get recognized on an accrual basis, meaning they’re not always a true representation of periodic cash movements. Furthermore, cash flows also need to get dissected as they could mislead investors of implied residual value.
Wheaton’s Beneish M-Score of -2.19 means it’s an unlikely earnings manipulator, as its accounting practices seem rather conservative. However, the firm has a fair bit of accruals on its financial statements, meaning its cash flow from investing and operations lag behind its net income. Thus, implying the firm’s net income might be a flimsy representation of its current cash-generating abilities.
Wheaton is offloading two of its streaming projects in its third quarter, namely Keno Hill and Yauliyacu stream. Cash reporting of any disposition gains should be tracked closely by investors, and unless the proceeds are recorded as investing inflows (or financing inflows), investors should consider backing the proceeds out of their analysis.
WPM Stock Valuation & Dividends
Relative Valuation
A relative valuation analysis implies that Wheaton is undervalued on a cyclical basis, meaning its price multiples remain below their 5-year cyclical averages. Despite being below cyclical averages, the stock’s price-to-book ratio is arguably elevated, and its earnings and cash flow metrics are also in questionable territory.
| Metric | TTM | 5Y Avg. |
| Price-to-Earnings | 31.94 | 41.80 |
| Price-to-Book | 2.61 | 3.14 |
| Price-to-Cash Flow | 22.31 | 27.86 |
Source: Seeking Alpha
Absolute Valuation
Absolute valuation metrics intend to utilize price multiples to derive a parsimonious price target. The methods behind deriving fair price targets are simplistic; however, they’re effective.
I derived Wheaton’s price target by multiplying its 5-year average PE ratio with its forecasted EPS ratio for December 2023 (this is known as a forward PE price target). The reason I chose a 5-year average was to account for cyclicality.
The price target from the forward PE price target model is $49.72, which is well beyond the stock’s current traded price. However, investors must consider that dividend distributions would likely provide a tradeoff and phase out some of the value.
| Cyclical Price-to-Earnings | 41.80 |
| Earnings-per-share Forecast Dec 2023 | 1.19 |
| Price Target | $49.72 |
Source: Seeking Alpha
Dividend Analysis
Wheaton’s 1.59% dividend yield doesn’t exactly get us off our seats. In addition, there’s little hope that dividend payouts might increase as the company’s current payout ratio is in line with its moving average and its dividend coverage ratio of 2.02 is borderline secure.
The company has a 30% dividend per common share payout policy; however, hard data suggests we’d skip this stock if we were dividend stock seeking.
| Dividend Yield | 1.59% |
| Dividend Coverage Ratio | 2.02 |
| Dividend Payout Ratio | 50.76% |
Source: Seeking Alpha
Concluding Thoughts – We’d Hold Off For A Bit
Wheaton’s third-quarter earnings results were mixed as uncontrollable events such as the Stillwater flood dented its top line. Moreover, lower throughput in some of its mines resulted in subdued gold production; however, much-needed facility maintenance and mine expansion progress was made during the quarter.
Prospectively, this mining stock remains a risk. It’s undervalued on a cyclical basis but has potential demand destruction to contend with as the broader core economy is at risk of entering a contractionary cycle. Furthermore, the stock’s dividend isn’t all that appealing, largely due to receding operating cash flow.
We’ve chosen to stay put for now as we don’t believe Wheaton’s risk-return prospects are favorably aligned.
Be the first to comment