

Liudmila Chernetska/iStock via Getty Images
This morning I got up early to get in my daily exercise, and while on my 3-mile walk I decided to bust open some of my favorite iTunes. Around 30 minutes into it, I began listening to a Doobie Brothers classic called “What a Fool Believes” and it goes something like this,
He came from somewhere back in her long ago.
The sentimental fool don’t see.
Tryin’ hard to recreate.
What had yet to be created once in her life.
If you’re familiar with the song, I’m sure you recognize that the lead singer, Michael McDonald, was somewhat ambiguous in what he was trying to say, but I think he was trying to recount a lovesick relationship – a fantasy of sorts.
Like many songs in the ’70s era, McDonald was likely using his lyrics to tell the world that he was once madly in love with a girl who never existed. In other words, he was very possibly insinuating that he was chasing a mirage and that only a fool would believe such a thing.
Then as I continued to listen to the song, I began to think about my upcoming article on net lease REITs, and the fact that Mr. Market has also been fantasizing that Net Lease REITs were bonds. While they (net lease REITs) look like bonds – because of their long-term contractual obligations – they are quite different in many respects.
As many readers know, I was once a net lease developer in which I built dozens of free-standing properties for chains such as Advance Auto (AAP), O’Reilly Auto Parts (ORLY), CVS (CVS), Walgreens (WBA), Dollar General (DG), and a host of others.
Over the past few months, as I drive around town, I look out the window and see many free-standing stores leased to chains like Starbucks (SBUX), Tractor Supply (TSCO), and Panera Bread, and I don’t see their values dropping as much as 20% year-to-date.
Yet, that’s exactly how Mr. Market is pricing the Net Lease REITs:
iREIT on Alpha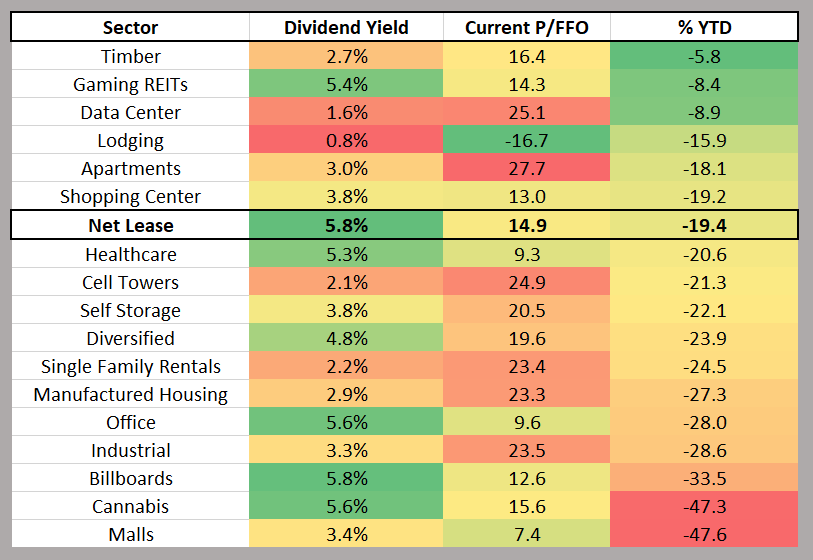
Most realize that net lease properties offer investors highly defensive income in which the performance is highly predictable. These assets provide high income and require little to no management.
The cash flow is dependable because the leases are structured in a manner that reduces risk of lease-up. The transaction volume in the net lease sector is exceptionally strong, largely due to the continued demand from 1031 investors as well as the growing acceptance within the net lease REIT sector.
As you can see below, what used to be one of the smallest property sectors in REIT-dom, net lease REITs (including gaming REITs) is now the 5th largest property sector.
iREIT on Alpha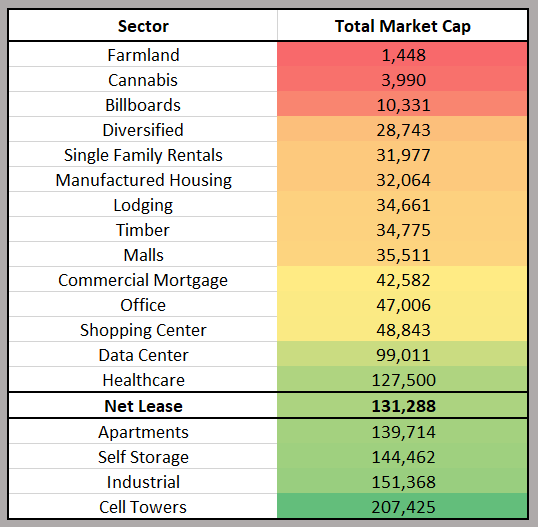
As you can see below, the Net Lease REIT sector offers investors a variety of options, ranging from 3.9% dividend yields up to over 11% (did you say “sucker yield”?).
iREIT on Alpha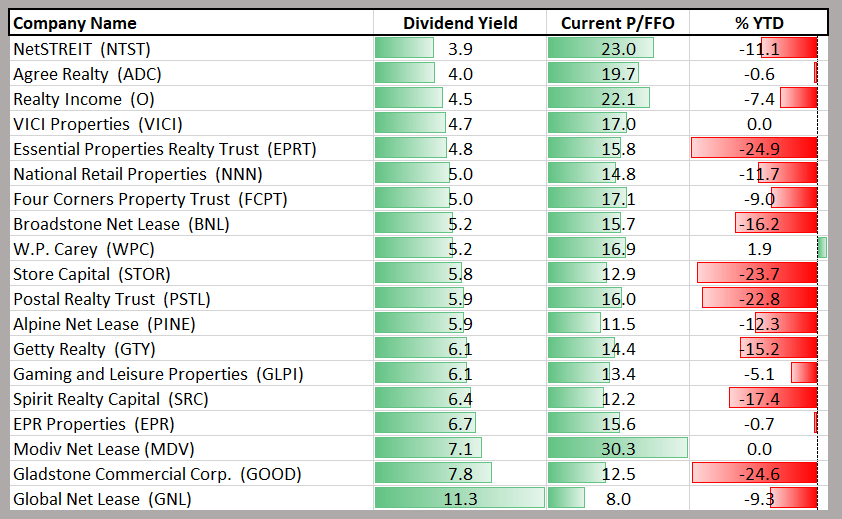
Of course, it’s important that I point out at this stage in my article that not all net lease REITs should be painted by the same brush. Just like Baskin Robins, there are many flavors to consider, and in this article, I would like to highlight what I consider the primary differentiators and reasons to invest in the sector.
To begin, I would like to cite a few sentences from one of the best resources on the subject of valuation and that is the book by the same name, Valuation: Measuring And Managing The Value Of Companies by Tim Koller, Marc Goedhart, and David Wessels.
“Companies thrive when they create real economic value for their shareholders. Companies create value by investing capital at rates of return that exceed their cost of capital.”
The key words are as follows…
“…investing capital at rates of return that exceed their cost of capital.”
This is perhaps one of the most important reasons to invest in stocks, because in order for a company to create value it MUST earn a return on invested capital (“ROIC”) greater than the opportunity cost of capital. And if the ROIC is at or below its cost of capital, growth simply does not occur, and value is not created.
Thus, as the co-authors explain,
“…the amount of value they create is the difference between cash inflows and the cost of the investments made.”
Breaking It Down…
So, as you all know, we’re now in a new cycle in which cost of capital has increased for all real estate investors. Mr. Market is spooked because the 10-year has spiked to 3.49%.
YCharts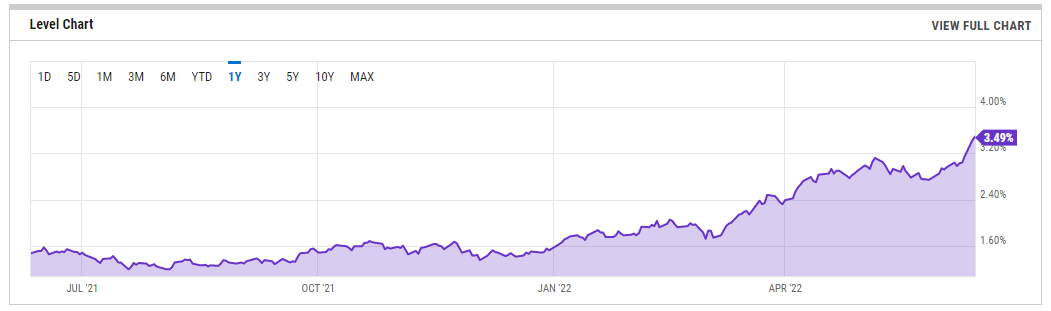
This means that the cost of debt has increase from 1.63% in January 2022 to 3.49% yesterday, or almost double, and this clearly has an impact.
While at REITWeek last week I discussed this with many REIT CEOs, and they all said that they still have healthy access to multiple sources of capital. It appears that cap rates are also nudging up by around 25 to 50 basis points, depending on the property sector.
For certain property sectors with shorter duration lease contracts (i.e. self storage, hotels, and apartments) there is not as much fear, because they have enhanced pricing power.
Alternatively, net lease REITs are disadvantaged in that regard because their investment spreads are locked in. Recognizing there is no free lunch when it comes to investing – predictability vs pricing power.
However, there’s actually a benefit worth pointing out, with regard to net lease REITs in that the tenant pays for all of the expenses.
Unlike a self-storage owner or hotel landlord who must adjust their rental rates due to rising inflation, the net lease landlord does not have to worry about any of the 3 T’s (toilets, trash, or taxes). And that’s what makes them seem like bonds…
But, as the title to my article suggests, that’s what a fool believes.
Be the Low-Cost Provider
For starters, let’s discuss a capitalization rate – more commonly shortened to “cap rate” – that is the expected rate of return from a piece or pieces of property. Here’s how define it:
Net Operating Income ÷ Current Market Value of the Asset = Capitalization Rate
But wait!
What good is it to understand cap rates if you don’t understand the company’s fuel – or cost of capital – to scale the business?
Whether it’s Walmart (WMT), Coca-Cola (KO), or Realty Income (O), a company’s overall cost of capital is essential to success.
That’s the “secret sauce” in question.
It’s utterly essential to understand the way REITs grow their earnings and dividends. Cost advantage is key for any business. It allows them to provide goods or services that undercut their rivals on price, helping them sell more.
In simple terms, being a low-cost provider generally allows the company to achieve fatter profit margins. So here’s the secret formula:
Cap Rate – Cost of Capital = Spread/Profit
Or, played out in an example: Let’s say that REIT ABC – a triple-net REIT – acquires a stand-alone building at a 7% cap rate with a 5% cost of capital. Subtracting the cost of capital, the spread becomes 2.0%, or 200 basis points (bps).
That spread right there is the profit margin.
With that explained, let’s take a closer look at the Weighted Average Cost of Capital (‘WACC’) for the Net Lease REITs, starting with the cost of equity, or equity yield:
iREIT on Alpha
Now, as I mentioned earlier, debt costs have essentially doubled since January 2022, so in order to provide an apples-to-apples comparison I decided to model each REIT based on their underlying credit rating and/or access to European sources.
For example, Realty Income has recently accessed European (U.K.) debt, 40 bps cheaper than the US and Euro financing that’s around 80 bps cheaper (than the US). My pricing model starts at 1.8% (4.2% x 33%) for Realty Income (only A-rated constituent) and then I added 40 bps for BBB paper, and another 40 bps for non-investment grade paper (BB+) and then 60 bps for non-rated names.
iREIT on Alpha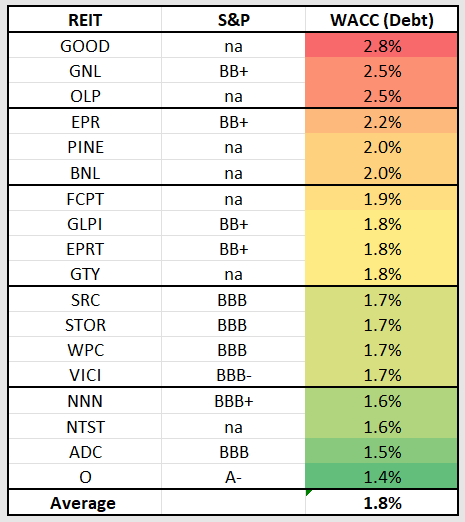
Keep in mind that many of the investment grade rated REITs have much lower leverage, and I have created 5 tiers (as shown above) to demonstrate the debt costs for each of these REITs.
Now, the combination of equity cost and debt cost equals the cost of capital. Keep in mind that higher levered REITs, like Gladstone Commercial (GOOD) and Global Net Lease (GNL) have a much higher cost of capital that forces them to invest in riskier opportunities to derive similar invest spreads.
iREIT on Alpha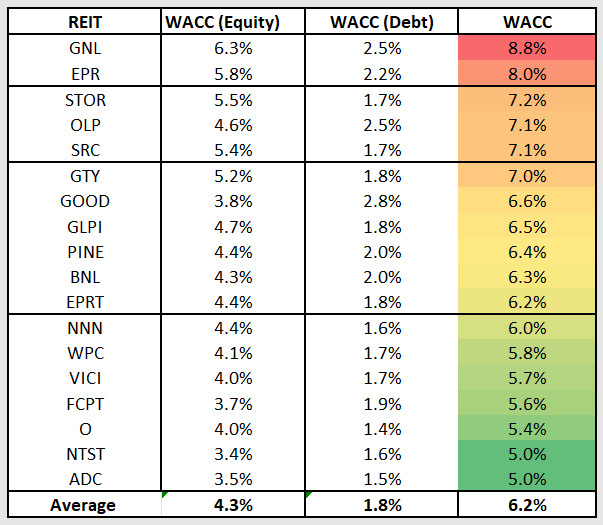
Now that we have created this WACC calculator let’s put it to work by examining each REIT and their investment spreads.
Realty Income Corporation (O)
In Q1-22. approximately $1.6 billion of acquisitions (half from international investments, bringing total international portfolio to approximately $5 billion of invested capital). Average initial cash cap rate for the quarter was 5.6% with weighted average remaining lease term of 12.3 years. Total acquisition guidance for 2022 is $5.0 billion.
With a WACC of 5.4%, O will clearly need to acquire at higher cap rates, and of course the recently announced Wynn Encore casino in Boston is a good example (cap rate of 5.7%). Also, O is able to source debt in Europe that’s one competitive advantage.
W.P. Carey Inc. (WPC)
Closed around $300 million through Q1-22, and another $400 million recently announced with about $100 million of build to suits or expansion projects expected to complete in Q2-22, and more expansion projects throughout the year. Similar to O, WPC can use European debt to keep costs down.
STORE Capital Corporation (STOR)
Acquired $513 million in acquisitions in Q1-22 at an initial cap rate of 7.1% with weighted average annual lease escalations of 1.8%. Investment spreads for the quarter were robust at approximately 340 basis points above recent debt issuance. Once more, STOR’s WACC remains elevated, and the company will need to seek acquisitions in the 7.5% range.
The company also raised its 2022 annual real estate acquisition volume guidance, net of projected property sales, from a range of $1.1 billion to $1.3 billion, to a range of $1.3 billion to $1.5 billion.
Spirit Realty Capital, Inc. (SRC)
During the quarter SRC deployed $511.4 million in investment capital at a weighted average cash capitalization rate of 6.42%, including the acquisition of 41 properties across 29 transactions. SRC continues to increase industrial exposure, which accounted for 37% of Q1-22 volume with a mix of 66% distribution, 29% manufacturing and 5% flex. Industrial exposure now stands at 19.8%, a 120 basis point increase over Q4-21. SRC also increased its acquisition guidance to approximately $1.5 billion.
National Retail Properties, Inc. (NNN)
SRC acquired 59 new properties in Q1-22 for approximately $210 million at an initial cap rate of 6.2%, and with an average lease duration of 17 years, almost all acquisition of this past quarter were sale leaseback transactions. Management said on the recent earnings call,
“…we expect a little more pressure on the cap rates for 2022 and 2021. As we now sit here at the beginning of May it feels like cap rates have bottomed out and private competition has dissipated a little. This is result NNN feeling that cap rate compression for the moment is behind us.”
NNN is targeting to acquire $550 million to $650 million in 2022 (closed just over $200 million in Q1-22).
Gladstone Commercial Corporation (GOOD)
GOOD closed two transactions for a total of $13.3 million (one was a GAAP cap rate of 6.54% and the other was a GAAP cap rate there 6.65%). Subsequent to the end of Q1-22 GOOD closed two industrial facilities at a GAAP cap rate was 6.69%.
Four Corners Property Trust, Inc. (FCPT)
FCPT acquired 18 properties in Q1-22 for a combined price of $42 million and an initial cash yield of 6.7%. In March, Fitch announced an upgrade of FCPTs debt rating to BBB flat with a stable outlook.
Essential Properties Realty Trust, Inc. (EPRT)
EPRT invested $238 million in Q1-22 at a weighted average cash yield of 7.0%. The weighted average lease term of investments this quarter was 15 years and the weighted average annual rent escalation was 1.4%. The weighted average unit level coverage was 3.3x and the average investment per property was $2.2 million.
Agree Realty Corporation (ADC)
ADC invested approximately $430 million and 124 high quality retail net lease properties across our three external growth platforms. 106 of these properties were originated through the acquisition platform, representing acquisition volume of just over $407 million. The total properties acquired had a weighted average cap rate of 6.0% and a weighted average lease term of 9.2 years.
Excluding the 55 property portfolio the properties acquired during the quarter had a weighted average cap rate of 6.2% Given ADC’s significant acquisition activity in Q1-22 the company increased its full year 2022 acquisition guidance to a range of $1.4 billion to $1.6 billion, representing a 25% increase at the midpoint.
Global Net Lease, Inc. (GNL)
GNL’s forward acquisitions pipeline totals $111.9 million and includes 1 industrial property in the U.S. for $13.4 million, which closed on April 19, 2022, and 1 office and 3 industrial properties for $98.5 million, subject to LOIs. Combined, these acquisitions have a weighted average cap rate of 7.5% and with over 14.5 years of lease term remaining.
EPR Properties (EPR)
In Q1-22 EPR acquired a movement climbing, yoga and fitness in Lincoln Park in Chicago for $19.9 million and a site for a new Topgolf in King of Prussia, Pennsylvania and a build-to-suit project, which will commence construction later in 2022.
EPR also announced that it is acquiring the Village Vacances Valcartier resort and hotel in Quebec City, Quebec, and the Calypso Waterpark in Ottawa, Ontario for aggregate consideration of approximately $142 million USD (approximately $179 million CAD). Cap rates remain in the 7% to 8% range and the company said it is maintaining its 2022 investment spending guidance range of $500 million to $700 million.
Alpine Income Property Trust, Inc. (PINE)
In Q1-22 PINE acquired 16 properties for just $65 million, and weighted average cap rate of 6.9%. The company said that it sold its last remaining office property in Hillsboro, Oregon. PINR expects to acquire between $215 million and $250 million of retail net leased properties during 2022, which is a 7.5% increase to the bottom end of the range.
Broadstone Net Lease, Inc. (BNL)
InQ1-22 BNL invested $210 million in 27 properties and a weighted average initial cash cap rate of 5.7%. The leases include a weighted average lease term of 19.3 years, and 1.5% annual rent escalations, translating into a GAAP cap rate of 6.4%. Acquisitions were more heavily weighted towards restaurants and retail at 50% and 37%, respectively, while industrial accounted for the remaining 13%. Acquisition volume between $700 million and $800 million dollars remains unchanged.
NETSTREIT Corp. (NTST)
NTST acquired 34 properties for $90 million at an initial cash capitalization rate of 6.3% and a weighted average lease term of 8.2 years. In addition, rent commenced on two development projects that had total cost of $7.6 million and had a weighted average investment yield of 7.6%. NTST said that increased investment activity, including acquisitions, developments where rent commenced, mortgage loan receivables, and net of dispositions, of at least $500.0 million in 2022.
Getty Realty Corp. (GTY)
Year-to-date GTY has invested approximately $53 million, including the acquisition of 2 convenience stores for $7 million; the acquisition of 10 car washes and 1 convenience store for $43 million subsequent to quarter-end; and approximately $3 million of total development funding year-to-date across 4 projects, including both new-to-industry convenience stores and car washes. The weighted average lease term of the properties acquired year-to-date was 14.8 years, and the aggregate initial cash yield on our year-to-date investment was just north of 6.5%.
Spreads Getting Squeezed
As you can see below, investment spreads are getting squeezed from both ends (debt and equity) and this has created an environment in which investment spreads have narrowed.
iREIT on Alpha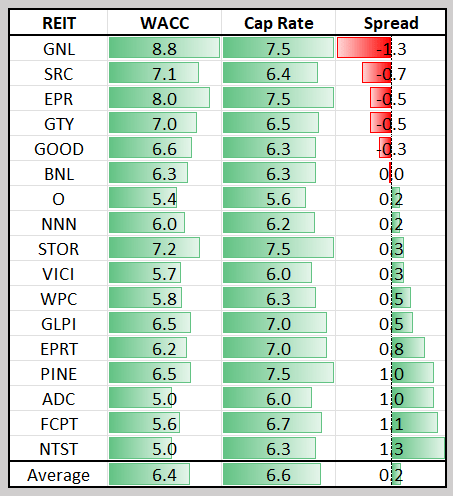
And this leads me back to the title to my article, “what a fool believes” in which Mr. Market has panicked forcing these net lease REITs to become cheaper by the day…
Not so fast…
We all know that Mr. Market has his good days and bad, and we all know that it’s not as much about interest rates, but more so about the direction of rates.
Also, we know that net lease REITs are not bonds, because the lease contracts increase and most expenses are paid by the tenant.
Thus, eventually equity will get cheaper and investment spreads will widen, as Joey Agree told me at REITWeek last week,
“It’s not about the debt cost, but the equity multiple is the driver.”
In this environment several net lease REITs offer low-hanging fruit, and what I mean by that is that they generate attractive dividend yields, low payout ratios, and solid internal growth drivers.
As the same co-authors cited above explain,
“One of the durable tenets of academic finance concerns the effect of diversification on the cost of capital. If diversification reduces risk to investors and it is not only to diversify, then investors will not demand a higher return for any risks than can be eliminated through diversification. If you can achieve lower volatility than your peers’, your cost of capital will be slightly lower.”
In other words, we consider Realty Income (O), Agree Realty (ADC), VICI Properties (VICI), Essential Properties (EPRT), NETSTREIT (NTST) and STORE Capital (STOR) bargains right now.
iREIT on Alpha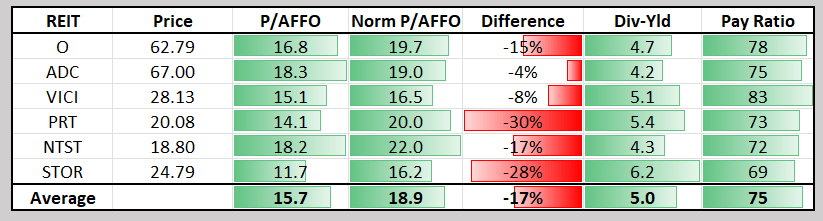
As you can see, the average dividend yield for these six REITs is 5.0% with an average payout ratio of just 75% (based on AFFO). We know that during a recession, rates tend to decline and currently the dividend yield is safe for all six of these REITs.
While the cost of equity is elevated, we recognize that the underlying fundamentals are solid and that investors can essentially get paid to wait.
Moreso, because of the huge multiple delta, I consider it an opportunistic time for REITs like Realty Income to seek out peers like Spirit Realty (SRC) for possible M&A (that is low hanging fruit for O).
As I see it, now is a perfect time to be adding Net Lease exposure to your portfolio, recognizing that Mr. Market is seemingly confused at this stage in the cycle.
And given the fact that the Net Lease REITs are now a dominant part of the investment landscape (globally), I see massive opportunity in continued consolidation that will provide these stalwarts with lower volatility and eventually a lower cost of capital.
As I like to explain frequently here on Seeking Alpha, “the cream always rises to the top”.
Be the first to comment