

nespix/iStock via Getty Images
1. Invasion Risk: The developing situation with regards to the extensive Russian military mobilization surrounding Ukraine was initially ignored by the market (similar to how Covid was also initially ignored in early 2020).
n.b. 2014 (Crimea annexation) as most will point out, didn’t really matter to the S&P 500 — but it is worth reflecting that S&P 500 valuations are about 60%+ higher vs then and the Fed is about to start hiking rates. The other aspect is if it goes ahead it will be on an entirely different scale, and would likely have major impact on commodity markets: extending the cost-push inflation that has taken hold.
Topdown Charts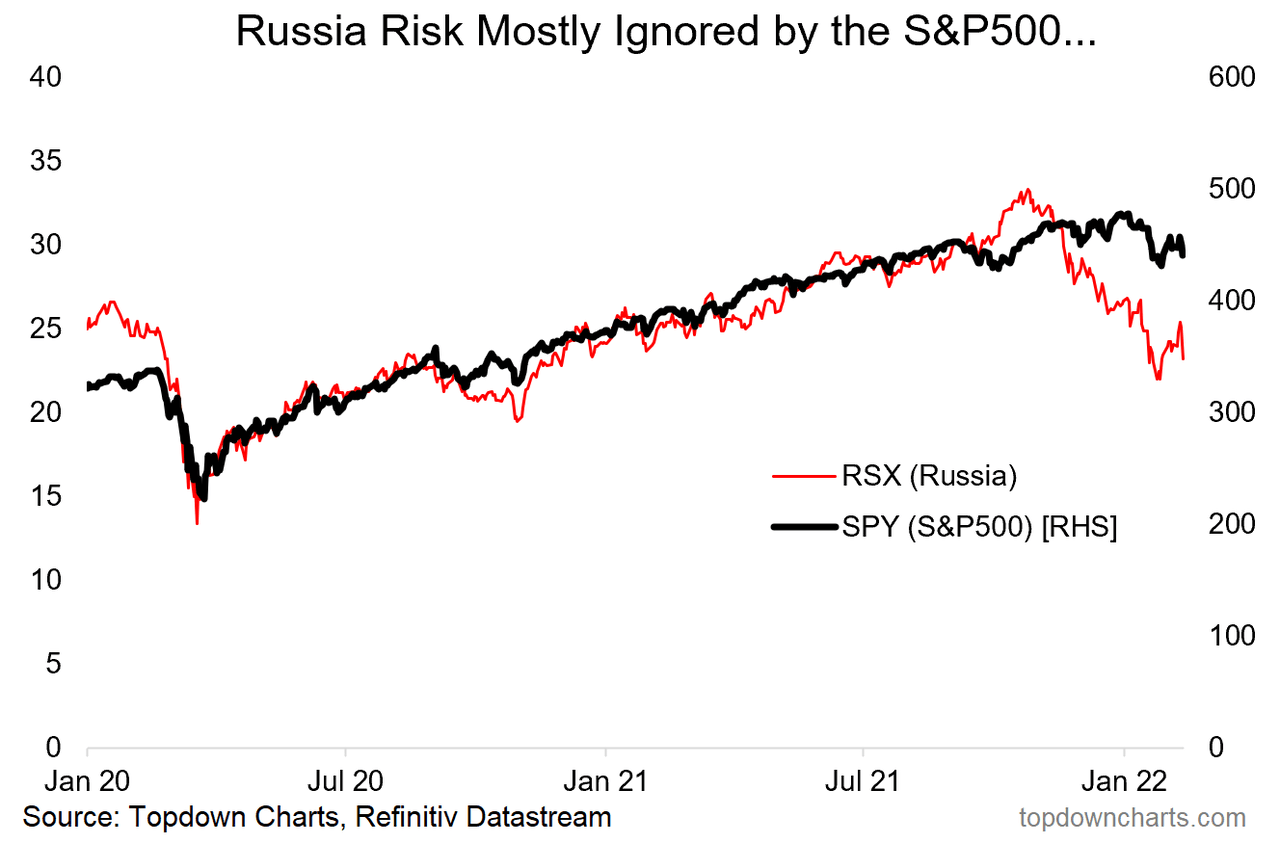
2. Geopolitical Even Risk Reaction: That said, here’s a useful selection of past geopolitical events and the S&P 500 reaction. Again though it’s difficult to find a direct comparison, and to also factor in the wider background context (valuations/policy etc!)…
LPL Research, Ryan Detrick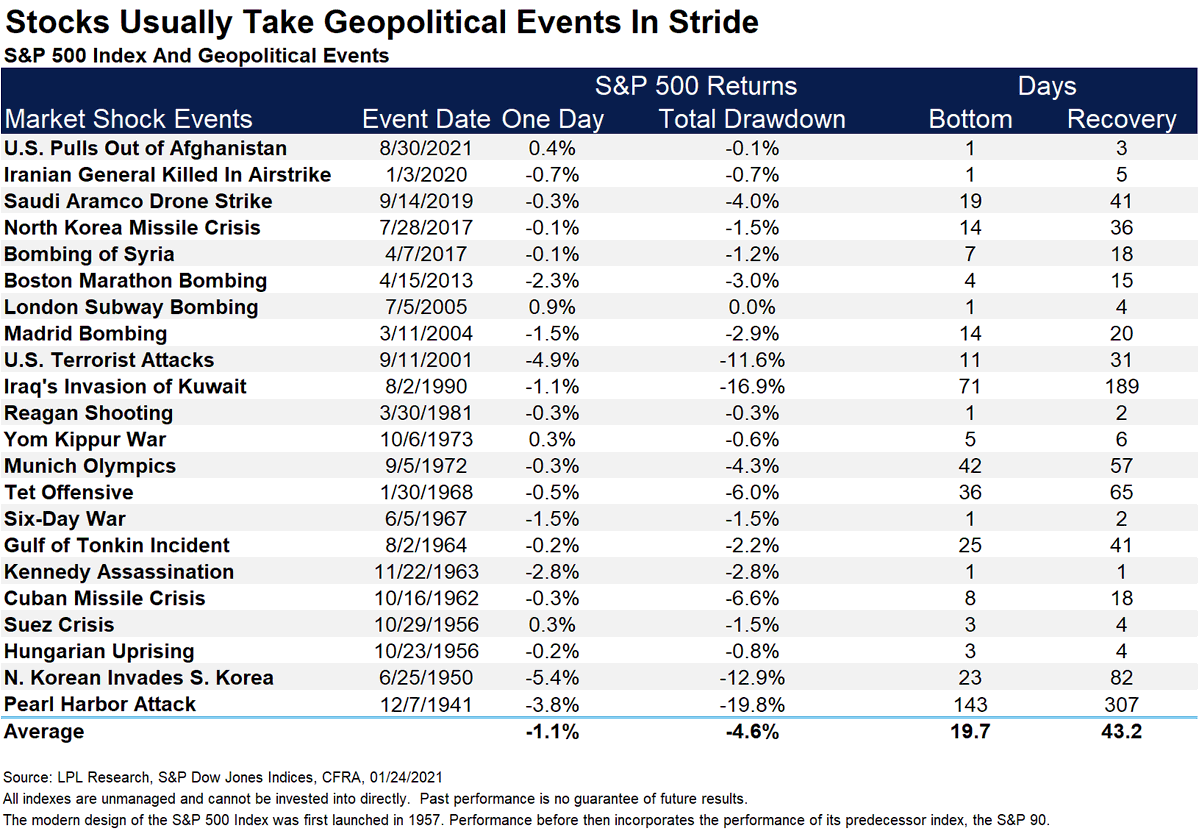
3. “Defensive” Stocks: Aerospace & Defense equities are stirring…
(albeit one issue with this chart is the ailing airliner business – hit hard by Covid and issues with Boeing (NYSE:BA) – one of the largest stocks in this)
Topdown Charts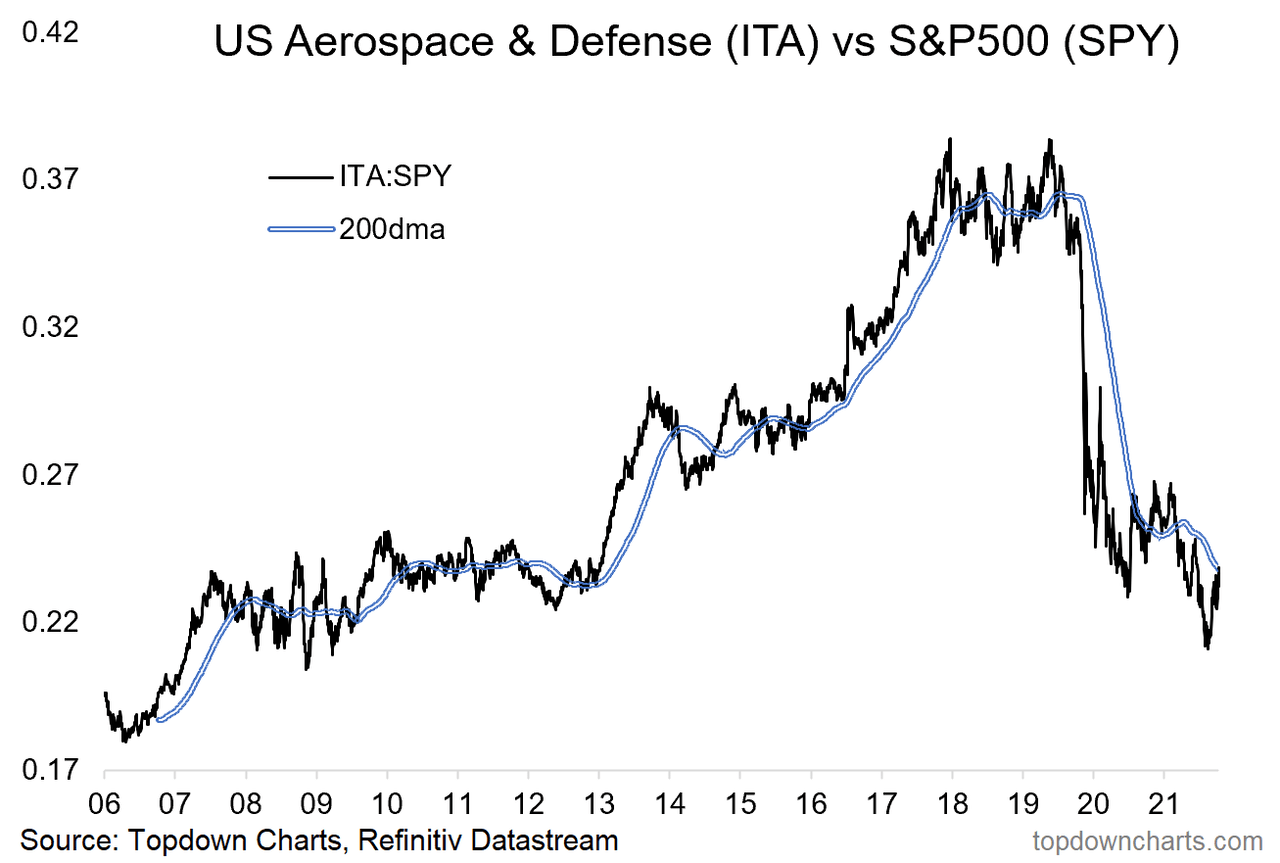
4. Invasion Risk Hedge? Russia is a major oil producer, most expect energy prices would soar on a significant escalation – meanwhile stocks probably stumble…
= potential for more upside in this chart
Bloomberg, LizAnne Sonders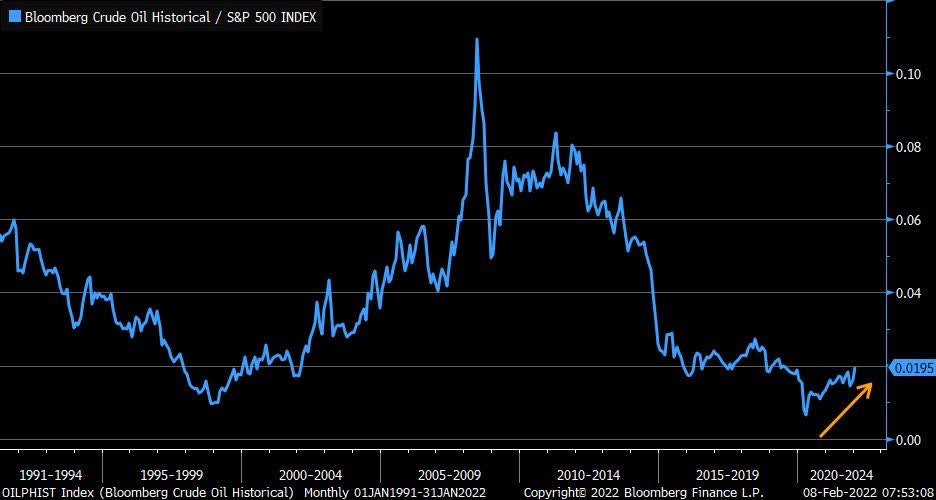
5. Gold vs Stocks: Similarly, gold likely rallies on invasion (especially relative to stocks), so again, another one to keep an eye on…
Bloomberg, Tavi Costa
6. Foreign Buying of US Equities: This is one of those things you tend to see later in the cycle (and further reinforcing the widening valuation gap between US vs Global equities). Time to go against the crowd?
Elliott Wave International, MFHoz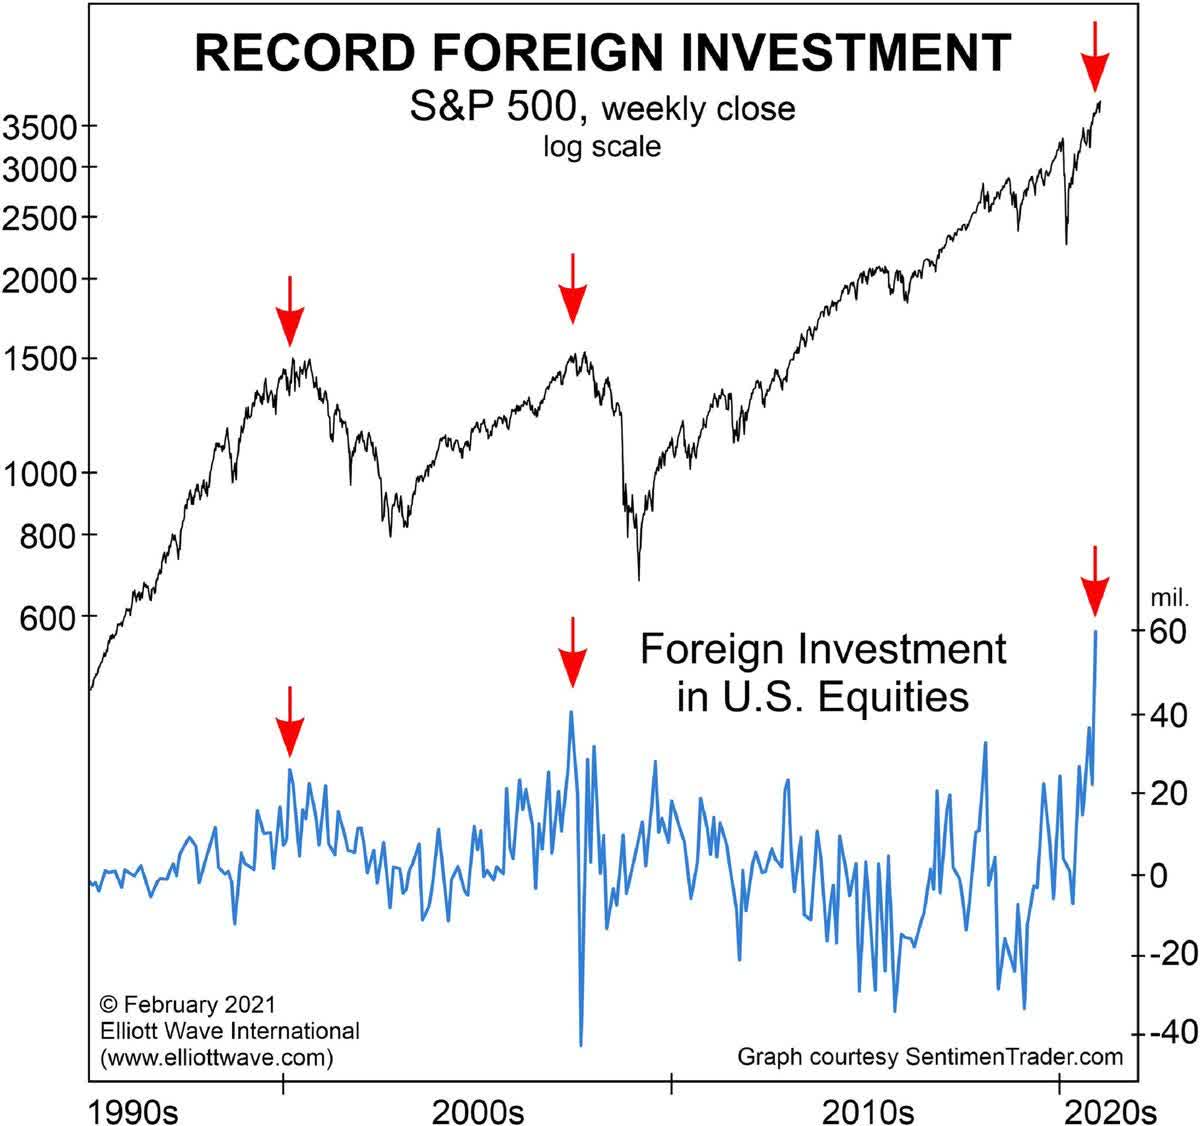
7. Peak Put Panic? With a looming wall of worry, investors have been frantically buying up put options to protect against perceived downside risks.
Macro Charts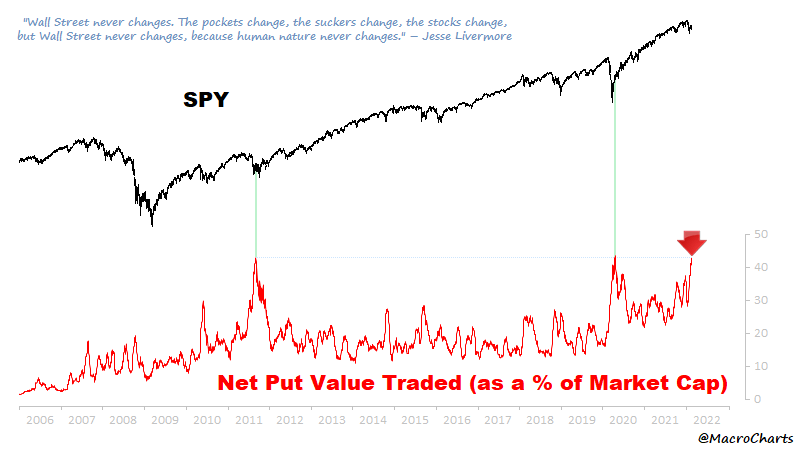
8. Stock Splits: Split… UP
Stock splits seem kind of stupid especially in the age of fractional share ownership.
But history tells us stock splits make stocks go up…
¯_(ツ)_/¯
Bank of America, CNBC, YunLi626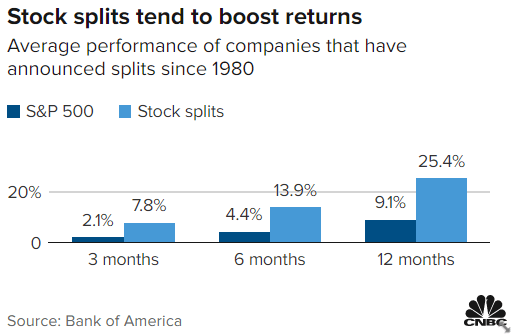
9. Unicorn Boom. 1000 and counting…
CBinsights via IndiaER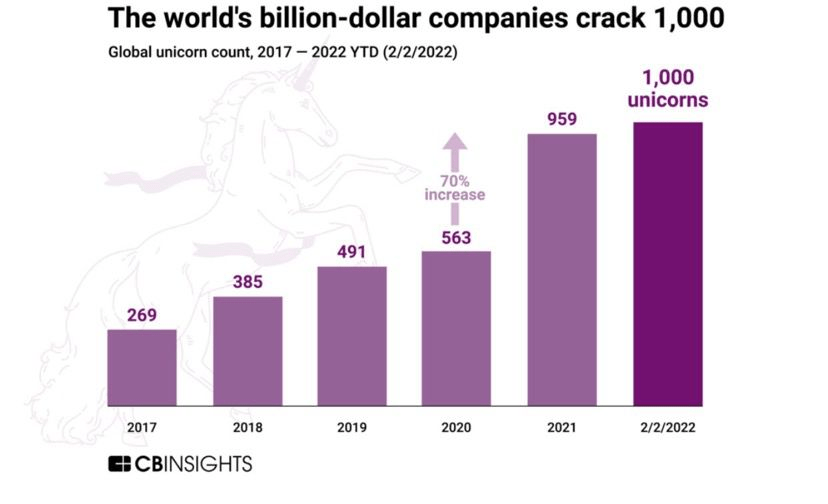
10. Value Creation (Compounding): “96% of the value is created after year-10”
(aka compounding, also $ vs %, but still: important reminder)
…albeit, you do have to survive long enough for that, as the article notes.
Studios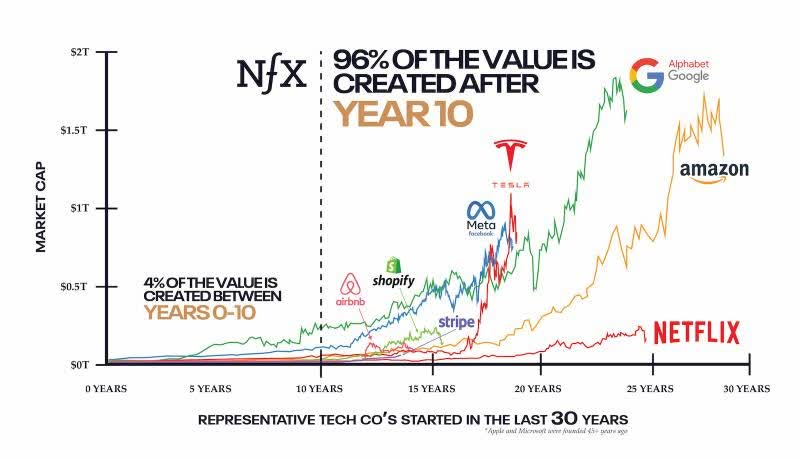
oh… that’s right, almost forgot!
BONUS CHART >>
IPO Withdrawal: January saw a new record set in the number of IPOs pulled.
With a total of 22 Initial Public Offerings withdrawn, the majority of which being SPACs, January set a new record. The pivot in policy by the Fed, wall of worry, and clear change in market mood have made capital raising a bit trickier.
Topdown Charts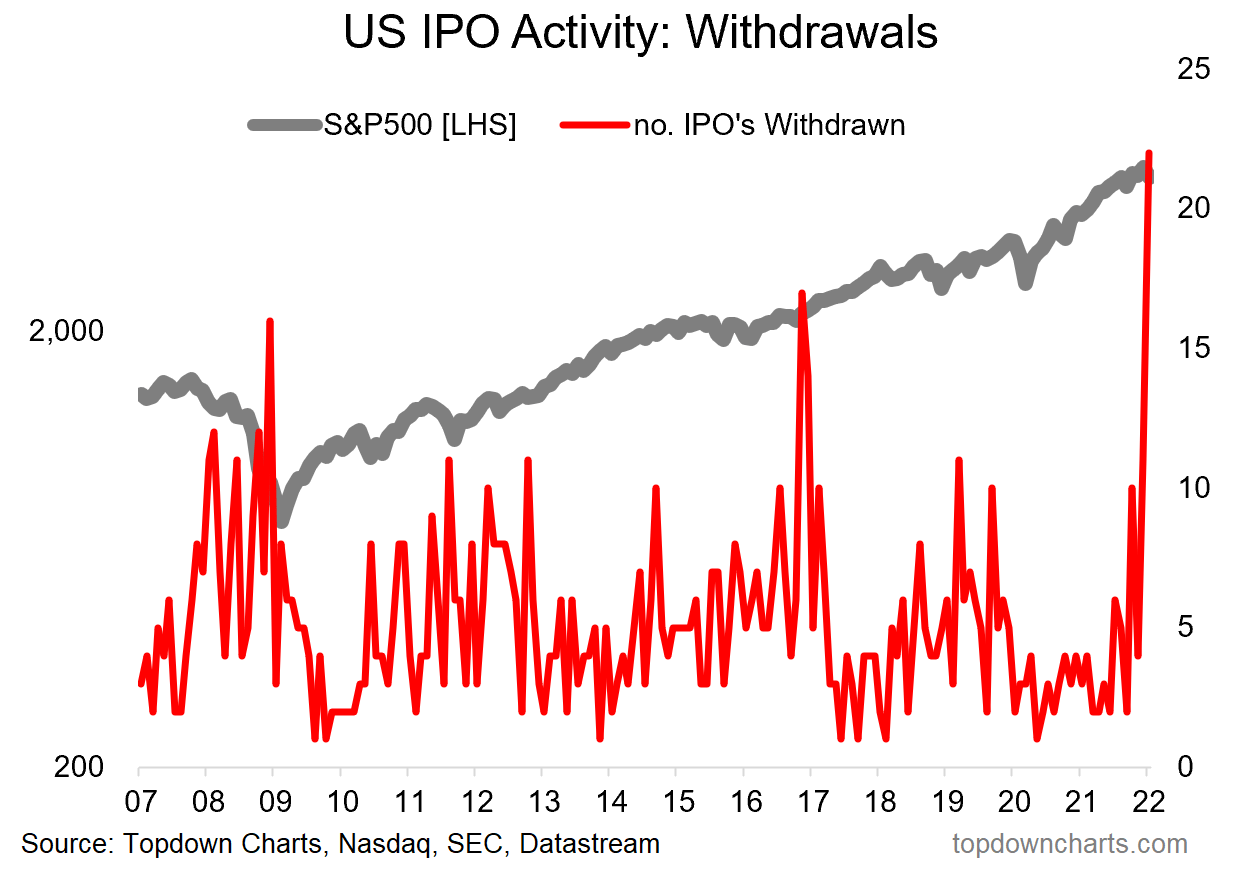
Pricings and Filings also fell to 20-month lows, so it’s fair to say there has been a clear shift in prospects for capital markets.
I like to keep track of IPO activity because it can serve as a sort of barometer of sentiment and liquidity (not to mention the impact on supply of stocks/equity – after all, it’s all supply & demand in the end). In that respect things are clearly changing.
But aside from the surge in withdrawals, it’s equally informative to reflect on just how violently extreme the past year was in capital raisings. Last year also set a record for the number of capital raisings conducted in a year, thanks to the boom in SPACs (but equally also a very large number of IPOs).
Topdown Charts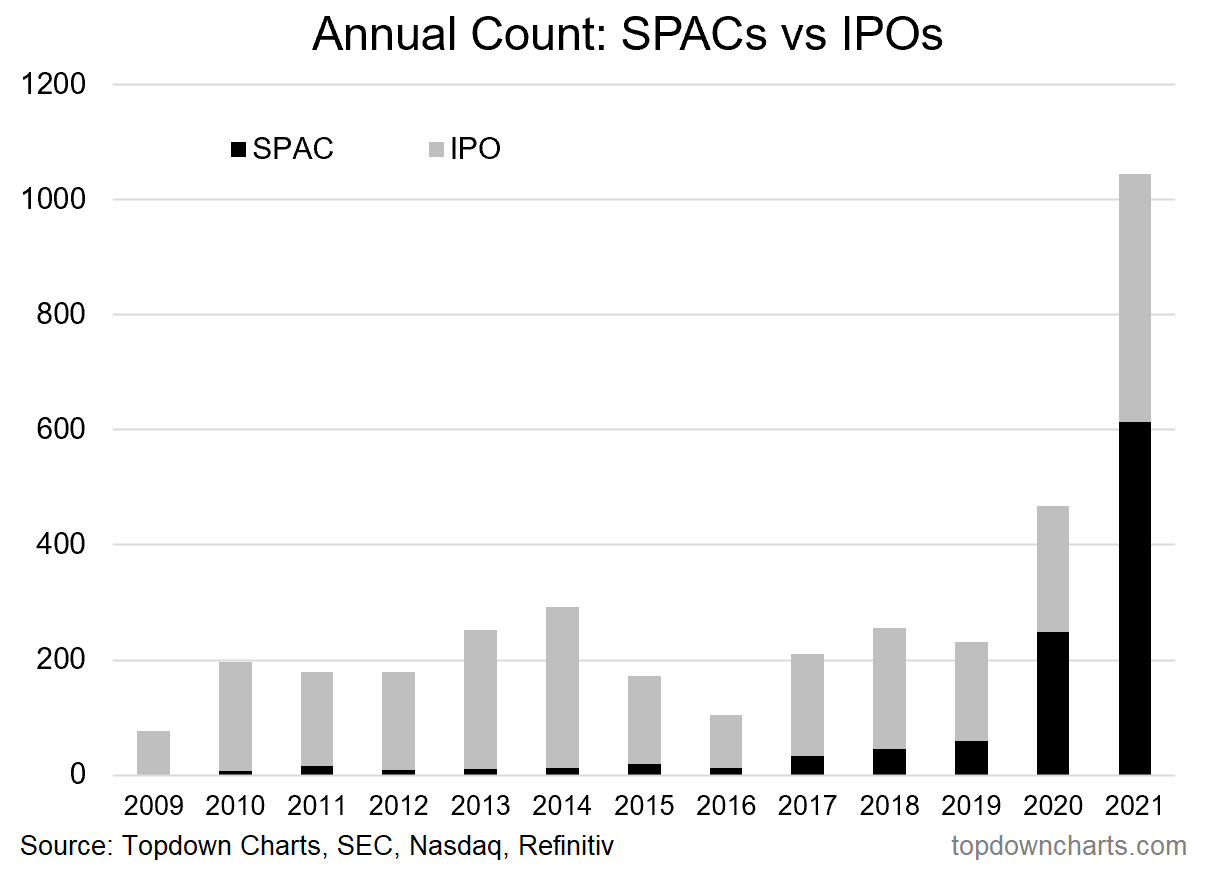
You actually have to go all the way back to 1986 to find the next highest annual count of capital raisings (and we know what happened the following year!).
Hence my comments around looking to the IPO market for sentiment and liquidity signals and gathering a sense for the state of capital markets.
And while we’re only 1 month in, so far 2022 looks like the bust to 2021’s boom.
Be the first to comment