

Introduction
The Weekly Breakout Forecast continues my doctoral research analysis on MDA breakout selections over more than 5 years. This subset of the different portfolios I regularly analyze has now reached 148 weeks of public selections as part of this ongoing live forward-testing.
In 2017 the sample size began with 12 stocks, then 8 stocks in 2018, and at members’ request into 2020, I now generate 4 selections each week, 2 Dow 30 picks, and a separate article for Growth & Dividend MDA breakout stocks. I now provide 6 different ways to beat the S&P 500 since my trading studies were made public.
Remarkably, the frequency streak of 10% gainers within a 4- or 5-day trading week remains at highly statistically significant levels above 80% not counting frequent multiple 10% gainers in a single week. More than 200 stocks have gained over 10% in a 5 day trading week since this MDA testing began in 2017.
2020 YTD Breakout Portfolio Returns
The Breakout Picks are up +14.16% worst case, buy/hold, do nothing, equal weighted returns through Week 12 compared to the S&P 500 -28.66% over the same period. These breakout picks skew highly positive for high frequency short-term gains in less than 5 days as documented over the past 3 years. I have removed the best case (High YTD +132.65%) gains from the chart below as it begins to distort the chart between the worst case gains and the S&P 500 returns.
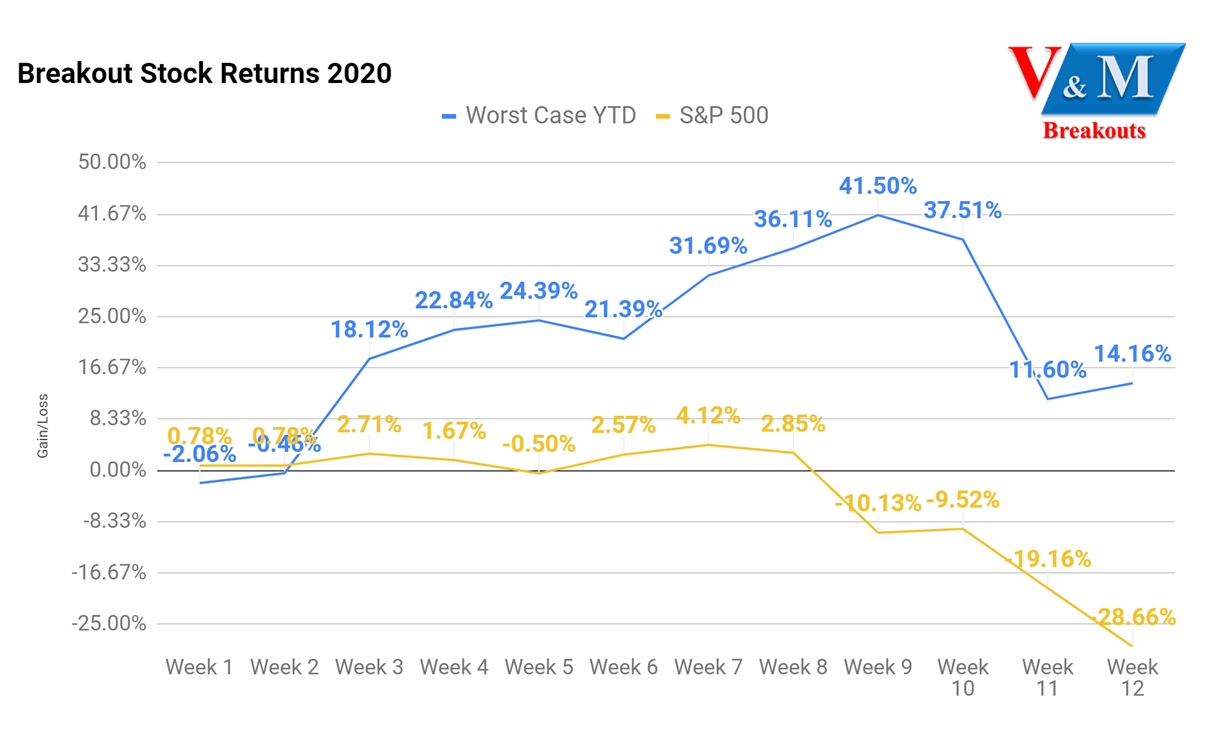
(Source: Value & Momentum Breakouts)
The best case average weekly return is +11.05% and worst case +1.18% YTD as shown below. These returns include trading during the Negative Momentum Gauge signal weeks which increases risk of declines. Week 12 closed with an average gain of +2.56% compared to a loss of -17.62% for the S&P 500.
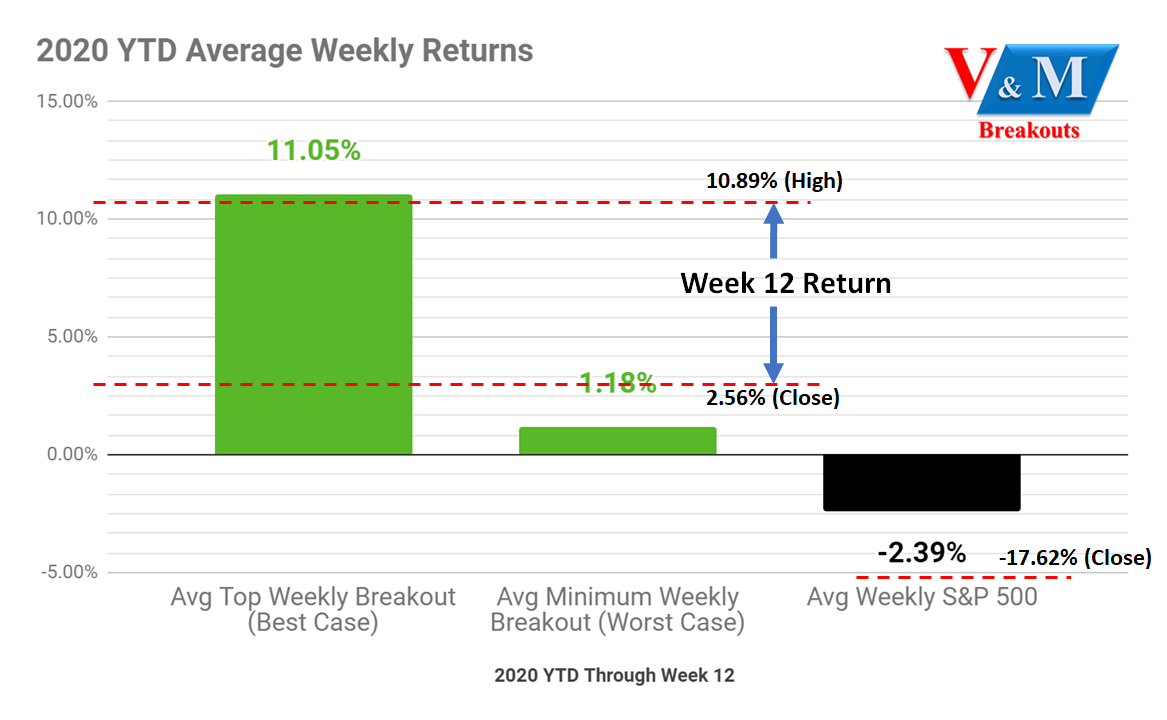
(Source: Value & Momentum Breakouts)
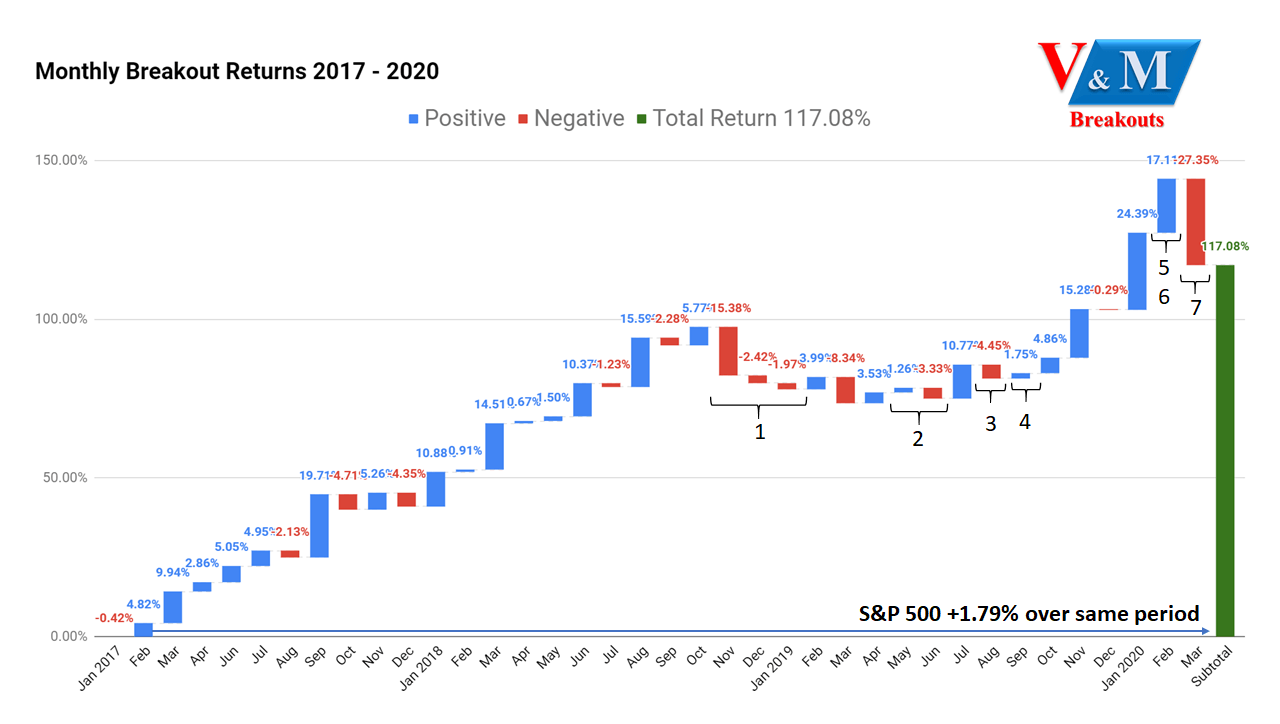
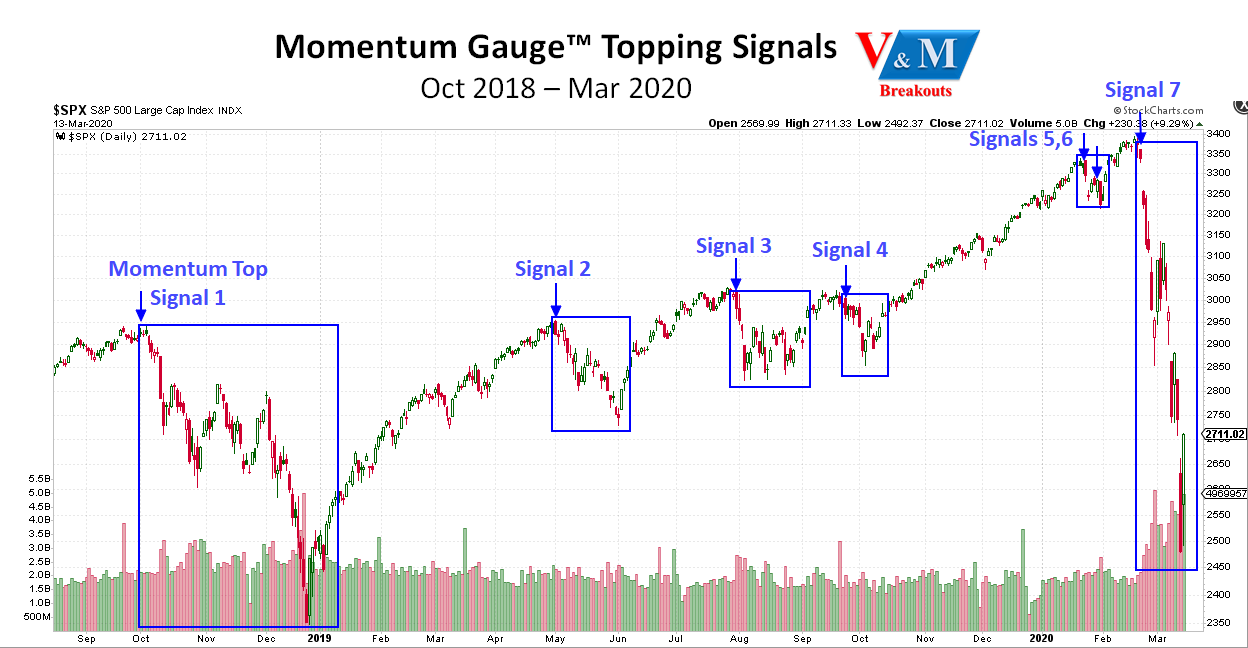
The Breakout Returns are up +117.08% since inception including the negative Momentum Gauge warning event periods. The buy/hold S&P 500 return is +1.79% over the same period from 2017. Avoiding trades during the weeks when the Momentum Gauge signals turned negative as shown across the 7 topping signals warned in advance to members would increase total returns to over 160% since inception.
 (Source: Value & Momentum Breakouts)
You can see how each of the 7 prior events numbered above relate to the Momentum Gauge topping signals shown below. These forecasted market tops are detailed in the following article:
Over the years, the evidence is clear that timing your investments during the most positive momentum periods greatly enhances your weekly returns. We are currently still in negative event 7 since the Feb. 24th signal with the highest levels of negative momentum scores ever recorded by this model.
(Value & Momentum Breakouts)
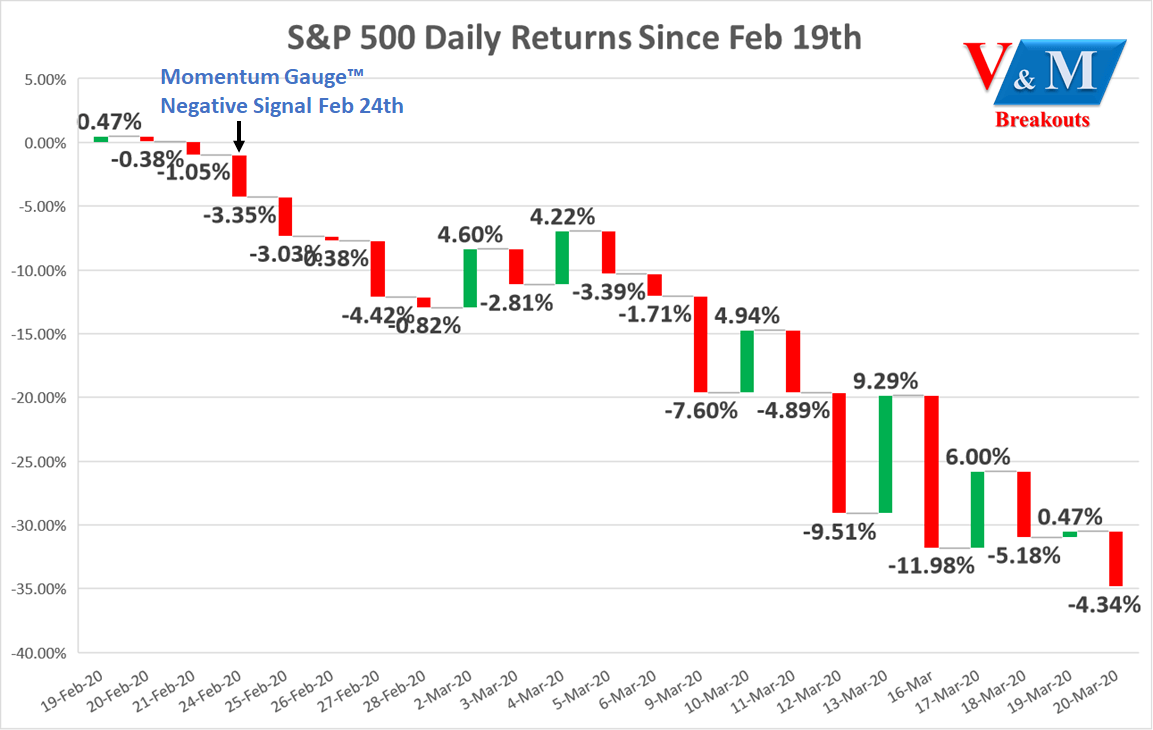
Momentum Gauge Signal 7 – February 24th
The Momentum Gauge signals are also the basis for the bull/bear ETF combinations used to hedge or leverage market conditions for maximum returns.
Strongest Market Timing Signals To Enhance Bull/Bear ETF Returns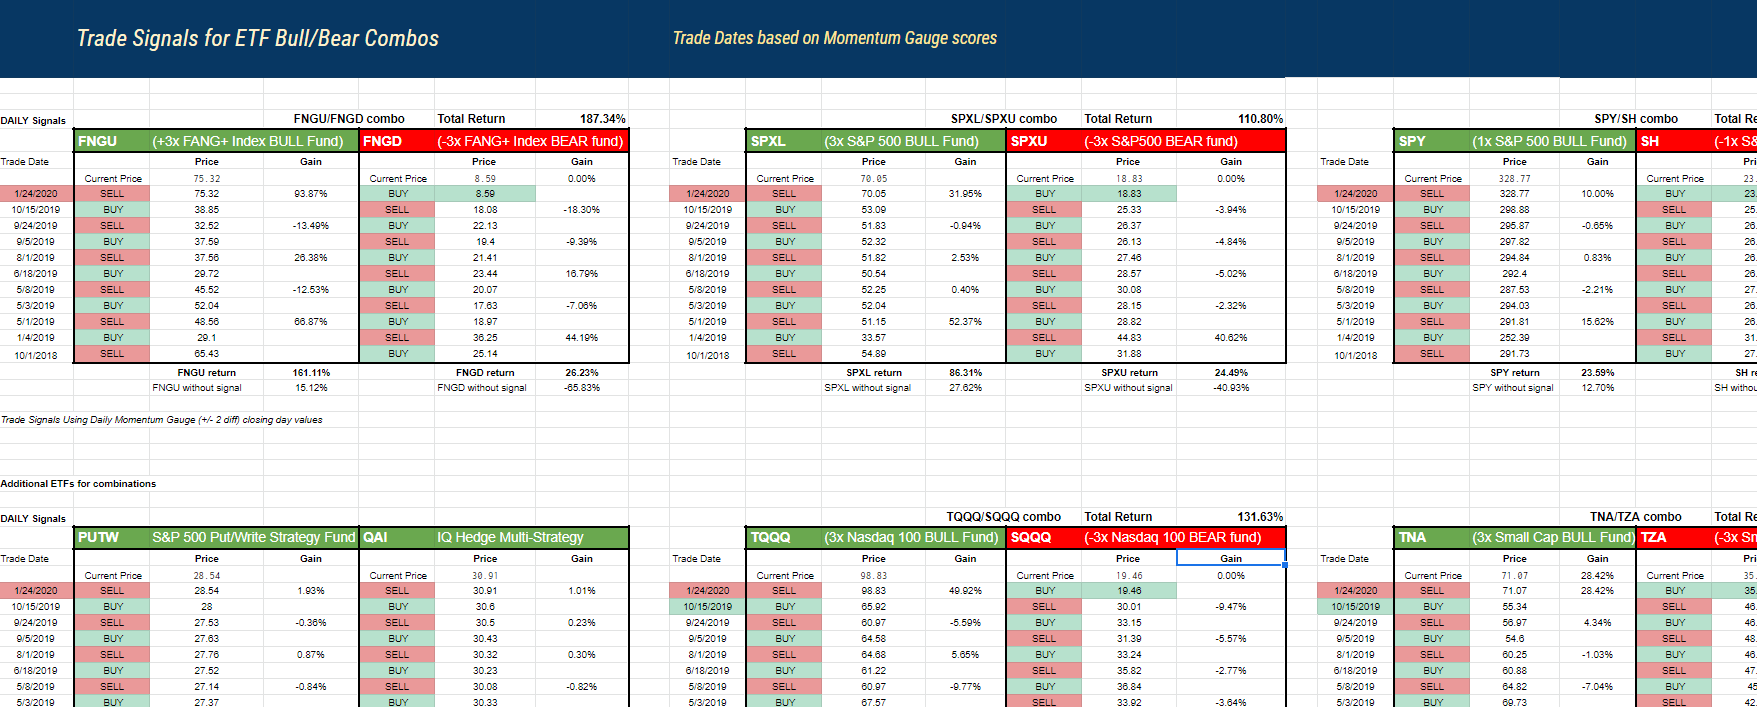 (Value & Momentum Breakouts)
The bull/bear ETF trading signal turned negative on Feb. 24th for the 7th major event in the past 18 months as illustrated above. Trading on this signal has produced the following returns for members, while we still remain in a very negative momentum signal through the close Friday. I am long FNGD, ERY, SPXU, SPXS, and FAZ following the signal from Feb. 24th with these current returns:
- MicroSeotors FANG+ 3x Index bull/bear (FNGU)/(FNGD) +78.06%
- Direxion Daily S&P 500 3x bull/bear (SPXL)/(SPXU) +94.08%
- SPDR S&P 500 (SPY)/ ProShares Short S&P 500 (SH) +32.26%
- Alpha Architect Intl Momentum (IMOM)/Dorsey Wright Short (DWSH) +61.12%
- ProShares UltraPro Nasdaq 3x bull/bear (TQQQ)/(SQQQ) +51.06%
- Direxion Daily 3x Small Cap bull/bear (TNA)/(TZA) +158.63%
- Direxion Daily 3x Biotech bull/bear (LABU)/(LABD) +71.00%
- Direxion Daily 3x Energy bull/bear (ERX)/(ERY) +298.95%
- MSCI 3x Emerging Market Index bull/bear (EDC)/(EDZ) +71.60%
- VIX Index 1.5x bull/bear (SVXY)/(UVXY) +479.58%
- Direxion Daily 3x Financial bull/bear (FAS)/(FAZ) +114.81%
- Direxion Daily 3x Oil & Gas bull/bear (GUSH)/(DRIP) +131.63%
Market Conditions into Week 13
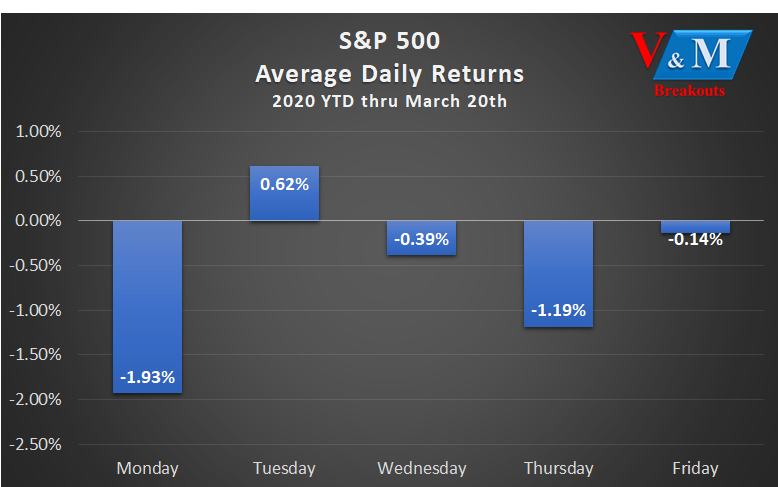
The biggest one-day drop since 1987 occurred on Monday and Thursday briefly held that record from Week 12. Tuesday is returning to the historical patterns well documented in research as the best day of the week especially ahead of FOMC meetings. We can expect these unusually large volatility swings to continue.
Strong 2020 MDA breakout stocks
There are very few stocks with any confirmed positive accelerating momentum this week. I would prefer that readers remain cautious in cash or inverse funds until the Momentum Gauges show any signs of positive conditions.
In addition to record stimulus around $4.2 trillion now pledged from central banks, we can now confirm more record Fed easing for Week 12 over $111.8 billion. In Week 11, there was an intervention of +20 billion, this brings the total easing to $418.3 billion in liquidity just the past 21 weeks. Fed easing was a very positive condition for the markets between 2009-2017, it has only returned in since July 31, 2019 and is accelerating to fight the economic impact of the virus.
System Open Market Account Holdings – FEDERAL RESERVE BANK of NEW YORK
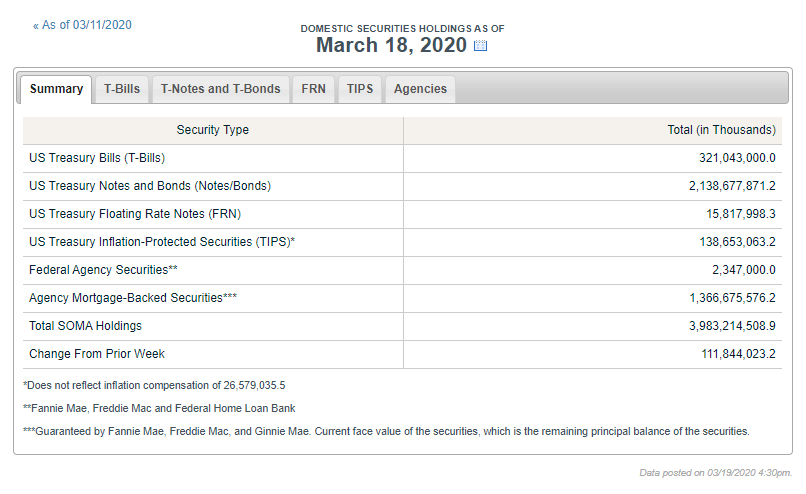
The Weekly Momentum Gauge chart below shows the Fed’s actual balance sheet action in dark blue over the original Fed scheduled QT (light blue). The huge Fed intervention this week was $111.8 billion. The Weekly Momentum Gauge chart turned to a negative signal back in Week 9 with confirmation shown as the red line crosses above the green line on the chart.
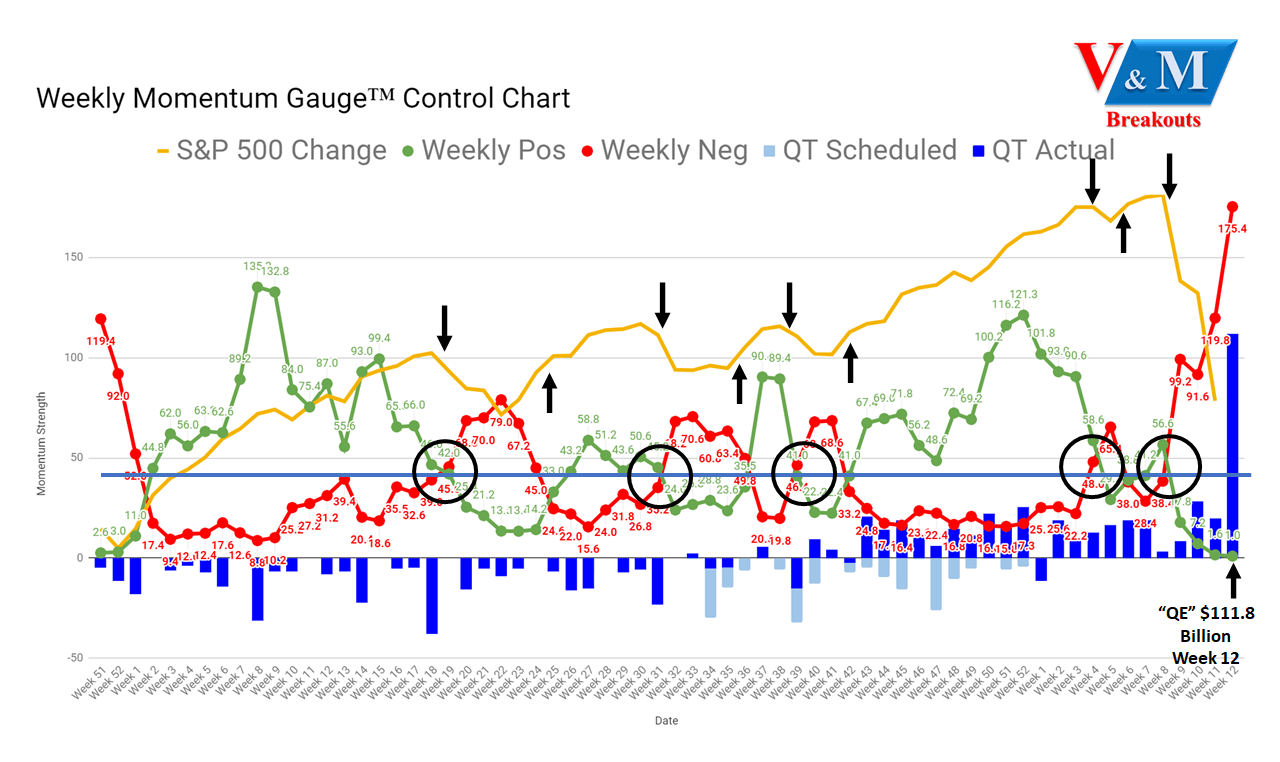
(Value & Momentum Breakouts)
The more detailed Daily Momentum Gauge chart below is reserved for members and reflects the last 6 months. The Momentum Gauges closed Friday after hours near the record at Negative 173 and Positive 2.
The MDA momentum gauges have correctly called every major market direction change since they began. These movements and signals were updated in more detail through the Daily Update articles this past week:
- V&M Breakout Morning Update – Mar 20: Quad Witching Friday, Markets, Oil Rebounding Over +2% Premarket, Fed Eased $111.8 Billion Wednesday, Global Banks Pledge $4.2 Trillion In Stimulus
- V&M Breakout Morning Update – Mar 19: Markets Lower With DJIA Below 19,600, S&P Below 2370, Oil Rebounding To $23.11/Bbl.
- V&M Breakout Morning Update – Mar 18: Markets Lower With DJIA Near 20,000, S&P Below 2400, Oil Crashing To 2003 Levels.
- V&M Breakout Morning Update – Mar 17: Markets Positive To Start St. Patrick’s Day, Momentum Gauges Closed Record Negative 173 Yesterday.
- V&M Breakout Morning Update – Mar 16: Markets Limit Down And WTI Below $30/Bbl With Momentum Gauges At Record Negative 131 On Friday 13th.
Two conditional signals that are very important to watch:
- Avoid/Minimize trading when the Negative score is higher than the Positive momentum score.
- Avoid/Minimize trading when the Negative score is above 70 on the gauge.
The Week 13 – 2020 Breakout Stocks for next week are:
The Week 13 stocks consist of two Services, one Healthcare and one Technology sector stock. These stocks are always released in advance to members early Friday and were hit hard with strong negative momentum conditions on Friday. Continue to use caution with the current negative Momentum Gauge conditions to see if an opportunity for entry emerges later in the week.
- Luminex Corporation (LMNX) – Healthcare / Medical Instruments
- Vipshop Holdings Ltd. (VIPS) – Services / Catalog & Mail Order
Luminex Corporation – Healthcare / Medical Instruments
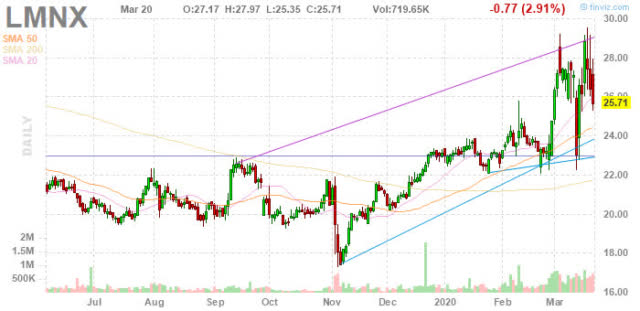
(Source: FinViz)
Luminex Corporation develops, manufactures, and sells proprietary biological testing technologies and products for the diagnostics, pharmaceutical, and research industries worldwide. Its products include Luminex 100/200 that integrates fluidics, optics, and digital signal processing; FLEXMAP 3D system for use as a general laboratory instrument; MAGPIX system, a multiplexing analyzer for qualitative and quantitative analysis of proteins and nucleic acids; ARIES system, a sample to answer real-time PCR platform; ARIES M1 system, a single-module version of the ARIES System; and VERIGENE system, a semi-automated, multiplex, molecular analysis system for the clinical diagnostics market.
Vipshop Holdings Ltd. – Services / Catalog & Mail Order
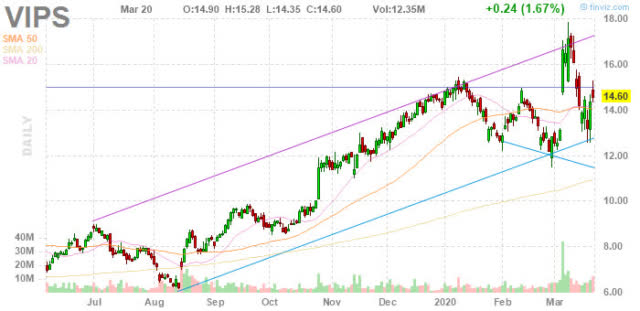
(Source: FinViz)
Vipshop Holdings Limited operates as an online discount retailer for various brands in the People’s Republic of China. It operates in two segments, Vip.com and Internet Finance Business. The company offers women’s apparel, such as casual wear, jeans, dresses, outerwear, swimsuits, lingerie, pajamas, and maternity clothes; men’s apparel comprising casual and smart-casual T-shirts, polo shirts, jackets, pants, and underwear; women and men casual and formal shoes; and accessories that include belts, jewelry, watches, and glasses for women and men.
Background on Momentum Breakout Stocks
As I have documented before from my research over the years, these MDA breakout picks were designed as high frequency gainers.
The point to be made is that the Momentum Breakout model was designed to increase the frequency, i.e. the rate over time, for selecting stocks that make greater than 10% moves. I know that when using the arbitrary period of 1 week (4 or 5 trading days) this model is consistently outperforming the market at more than 4 times the expected market frequency. So what if I take a look at longer momentum survivors? Can we see decay in performance among the top stock selections? ~ Value & Momentum Breakouts 2017
The frequency percentages remain very similar to returns documented here on Seeking Alpha since 2017 and at rates that greatly exceed the gains of market returns by 2x and as much as 5x in the case of 5% gains.
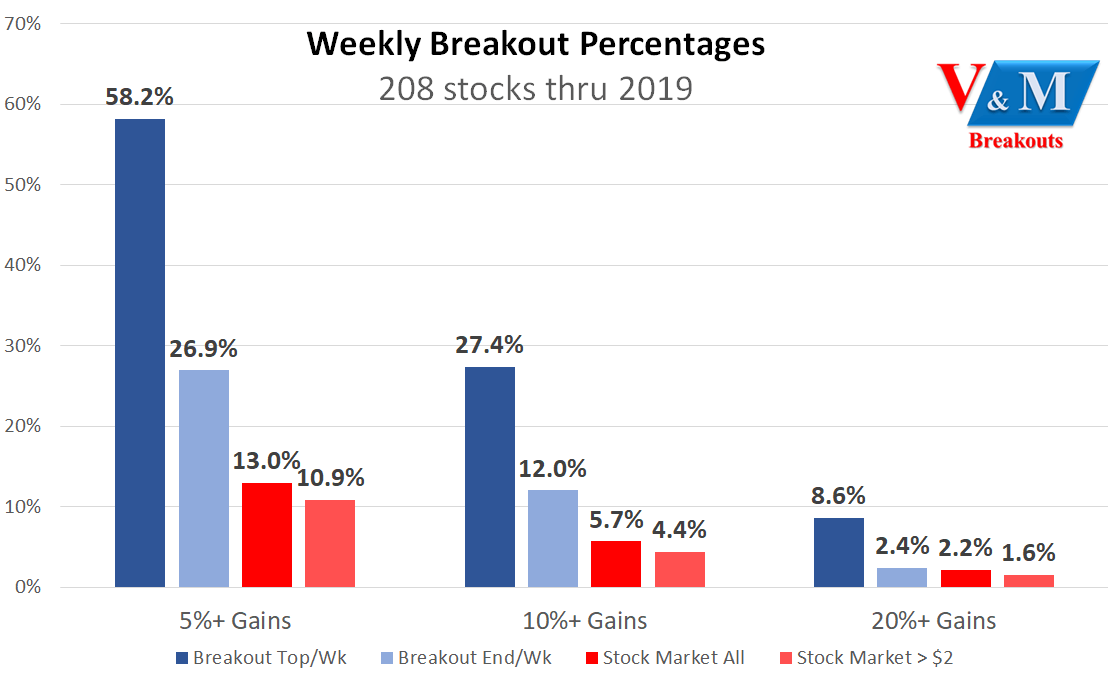
(Value & Momentum Breakouts)
These percentages reflect the results from 208 MDA breakout selections through 2019 across 52 weeks with 4 stocks selected each week. MDA selections are restricted to stocks above $2/share, $100M market cap, and greater than 100k avg daily volume. An additional Stock Market column was added to compare similar groups that exclude high volatility penny-stocks below $2/share.
Conclusion
These stocks continue the live forward-testing of the breakout selection algorithms from my doctoral research with continuous enhancements over prior years. These Weekly Breakout picks consist of the shortest duration picks of seven quantitative models I publish from top financial research that include one-year buy/hold value stocks.
My recent thoughts on the Coronavirus impact can be found among the contributions to the SA Roundtable series:
The latest MDA breakout Growth & Dividend stocks for March were released at the start of the month and are led by gains in Kroger (KR) +12.94%, Clorox Company (CLX) +11.28%, and Gilead Sciences (GILD) +5.62%
All the very best to you and have a great week of trading!
JD Henning, PhD, MBA, CFE, CAMS
 If you are looking for a great community to apply proven financial models with picks ranging from short term breakouts to long term value and forensic selections, please consider joining our 500+ outstanding members at Value & Momentum Breakouts
Disclosure: I am/we are long ERY, FNGD, FAZ, SPXU, SPXS, UVXY. I wrote this article myself, and it expresses my own opinions. I am not receiving compensation for it (other than from Seeking Alpha). I have no business relationship with any company whose stock is mentioned in this article.
Be the first to comment