

Justin Sullivan
Walgreens Boots Alliance, Inc. (NASDAQ:WBA) operates as an integrated healthcare, pharmacy, and retailer in the United States (U.S.), the United Kingdom, Germany, and internationally.
The firm had a rough 2022. Its stock price has sunk as much as 25%, substantially underperforming the broader market, despite the recent rally in October-November.
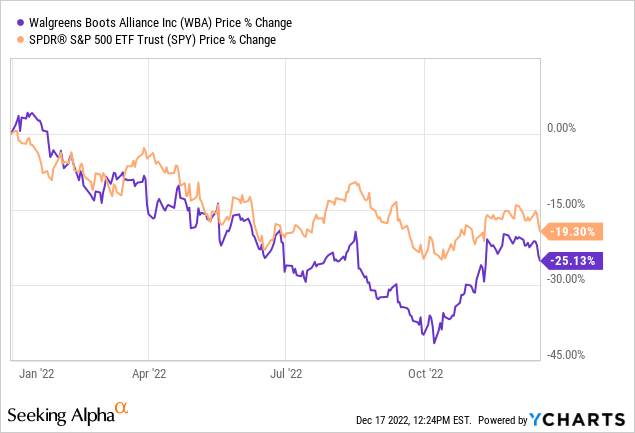
At the same time, the firm has kept on paying its quarterly dividends of $0.48 per share, which has led to an annual yield of as much as 4.9%. With this relatively high yield, naturally the stock is getting much attention from dividend and dividend growth investors. In today’s article, we are going to take a look at WBA, and give our opinion, whether the firm’s stock could be an attractive investment from a dividend point of view. To conduct our analysis, we will be using a simple dividend discount model, namely the Gordon Growth Model.
Evaluating the value of dividends
Dividend history
WBA has been returning value to its shareholders in the form of dividends each year for the past 30 years.
Dividend history (Seeking Alpha)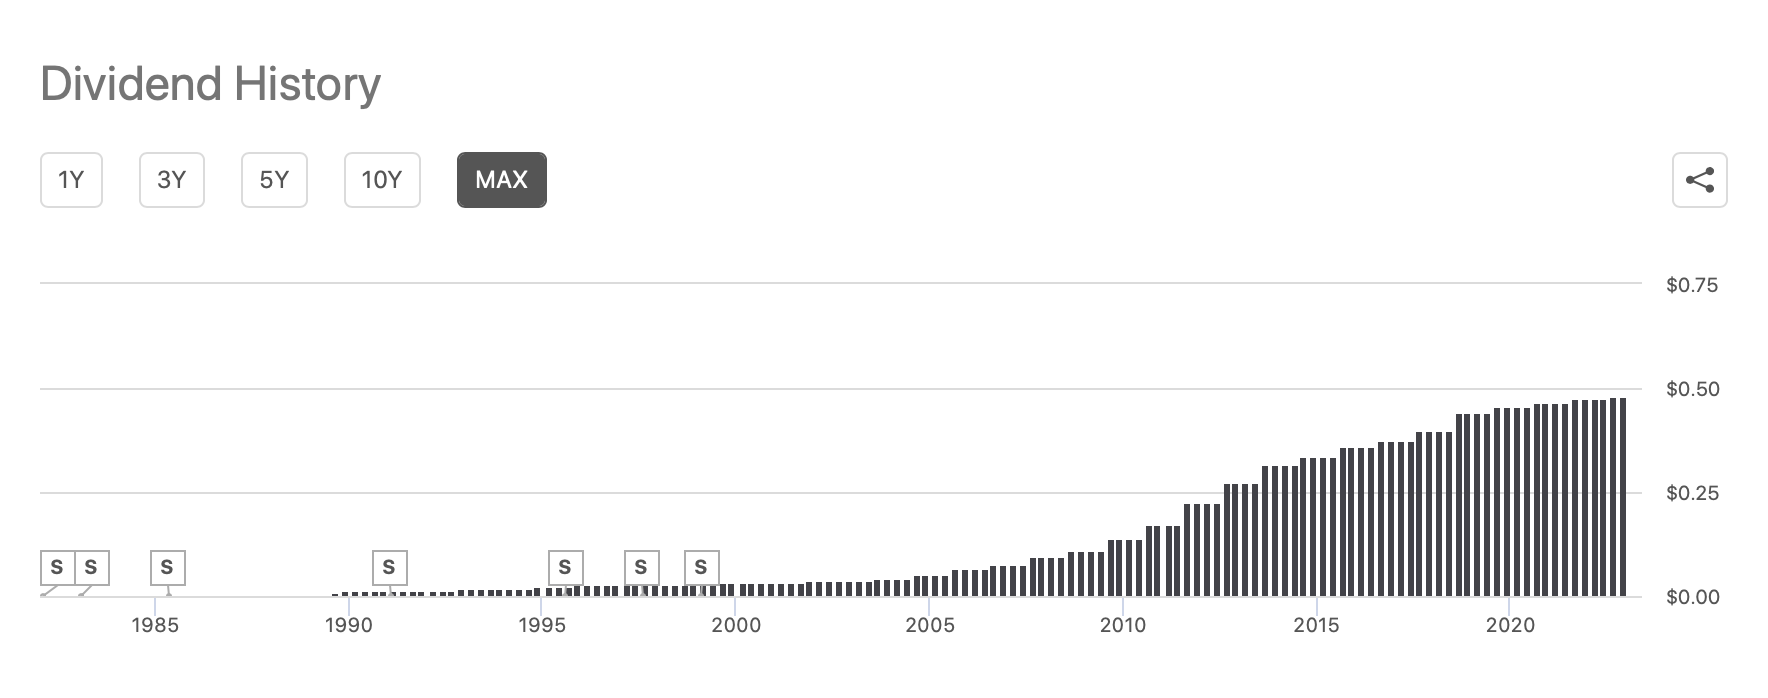
Not only has the firm been paying dividends for the past 3 decades consecutively, they have also managed to increase these payments each year.
These metrics compare favourably to the consumer staples sector medians.
Consistency grade (Seeking Alpha)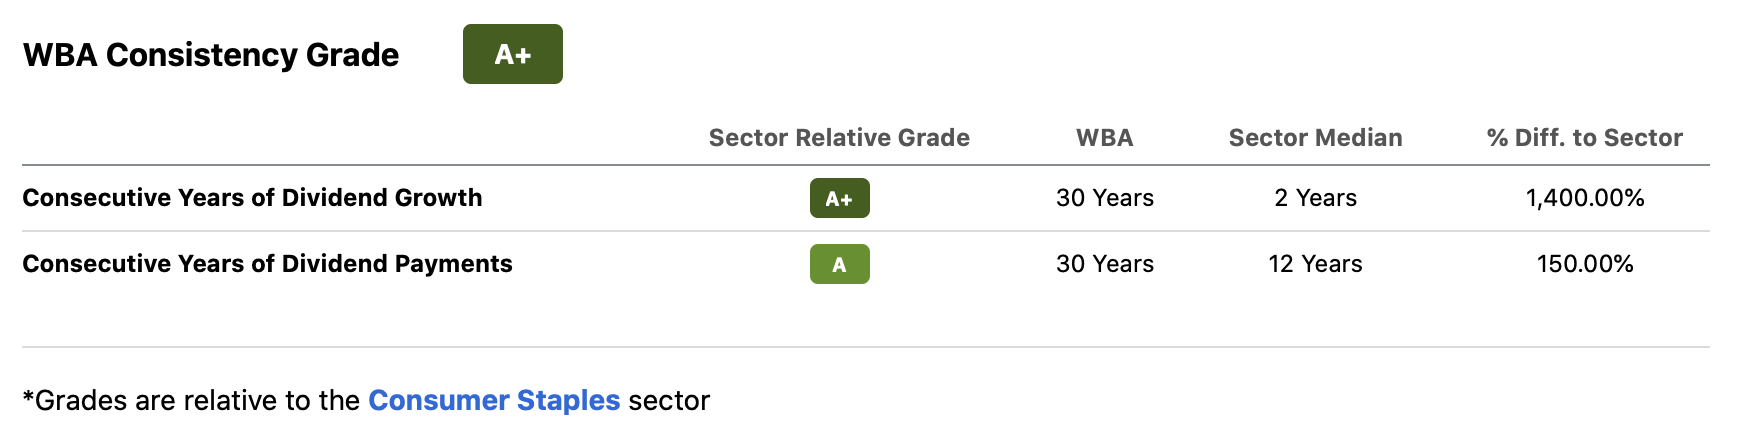
The consistency and the growth of the dividend payment are however not the only factors that need to be considered, when investing in a business for the dividends. The safety and sustainability of the payments pay an important role as well, when making an investment decision. Two metrics that indicate well, whether the company can indeed afford to pay dividends, are the payout ratio and the dividend coverage ratio.
Dividend safety (Seeking Alpha)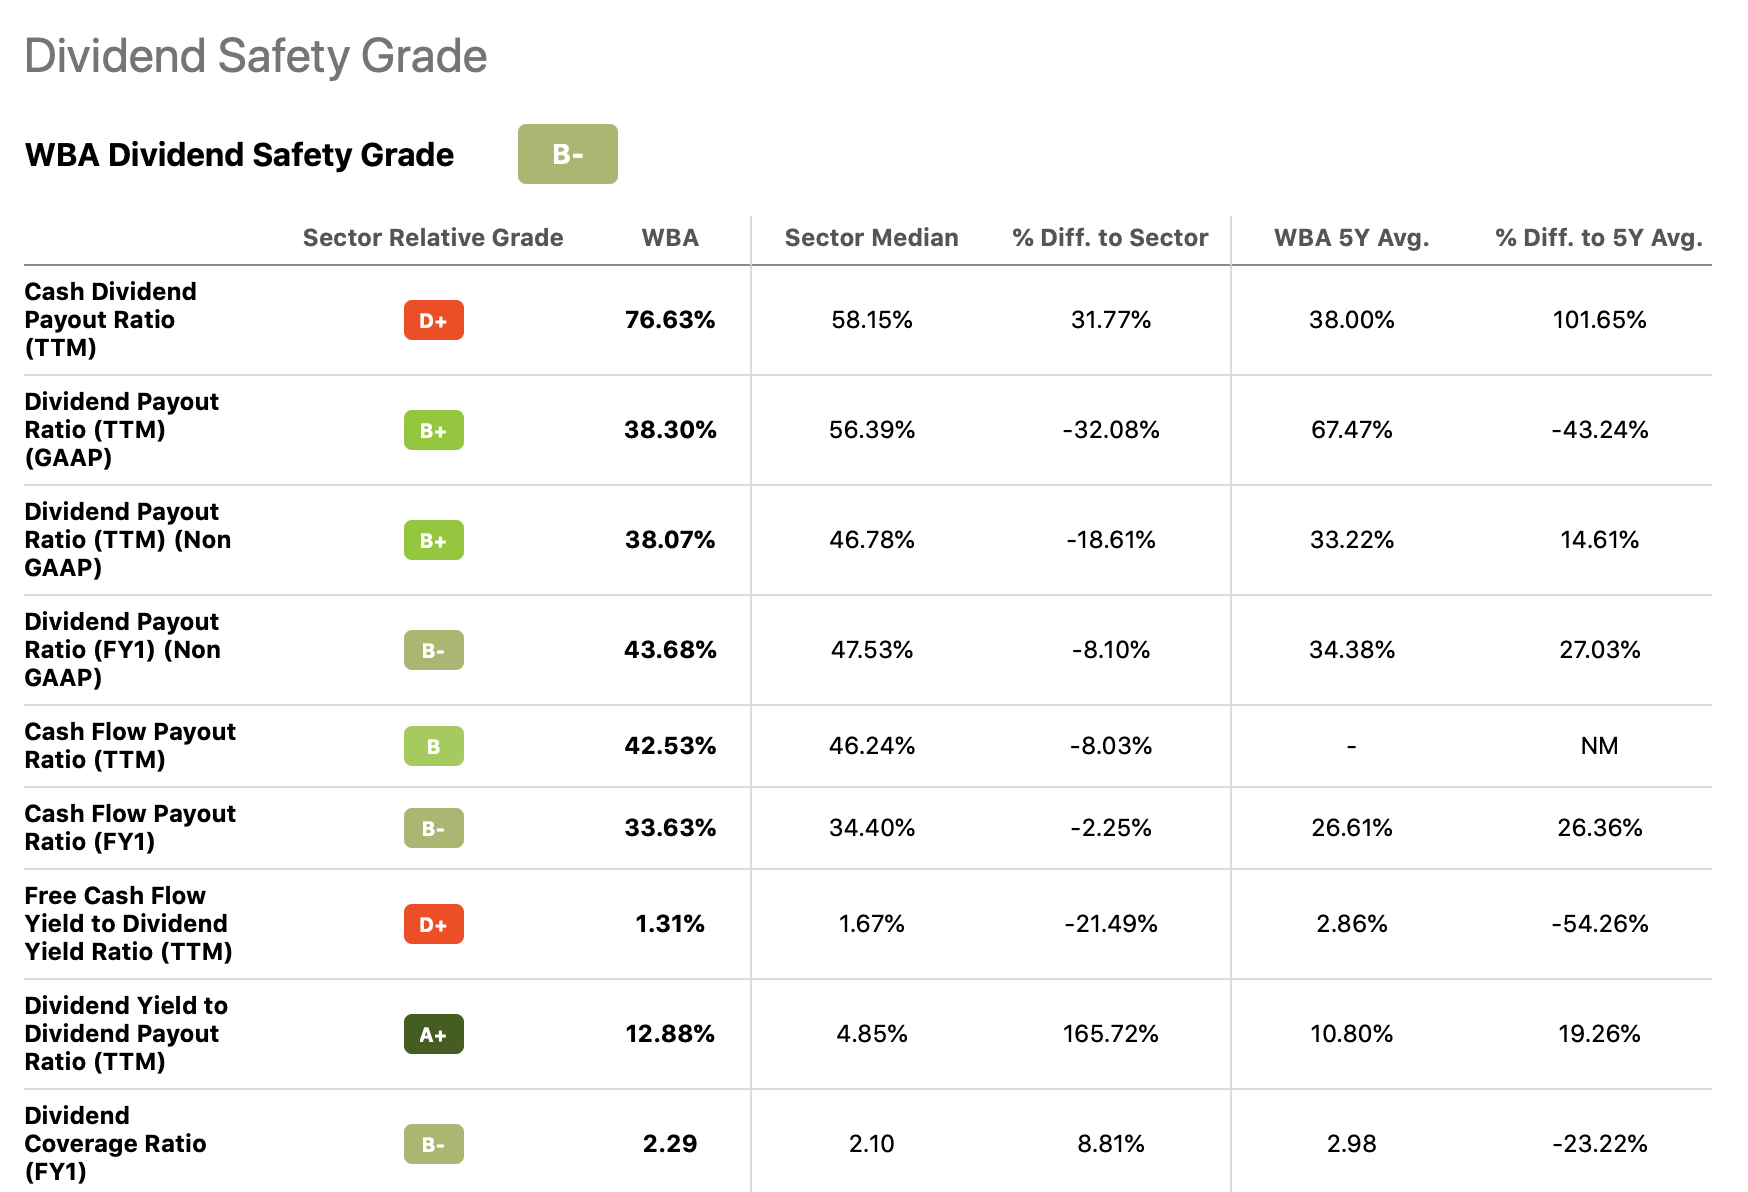
According to the metrics above, we can see that WBA can easily pay the current dividend amount, with the dividend payout ratio being less than 40% and dividend coverage ratio being more than 2.2. These metrics also compare favourably to the respective sector median, even though the current readings are somewhat higher than the firm’s own 5Y average.
For these reasons, we believe that WBA’s stock could be an attractive option for dividend and dividend growth investors. Now what we need to understand is how much we should be paying for these dividends. To answer this question, we will use the Gordon Growth Model (GGM).
Gordon Growth Model
The GGM is a relatively simple and well-known dividend discount model, used to value the equity of dividend paying firms. The main assumption of this model is that the dividend grows indefinitely at a constant rate. Due to this criterion, the growth model is particularly suitable for valuing firms, which are:
- Paying dividends
- In the mature growth phase
- Relatively insensitive to the business cycle
A strong track record of steadily increasing dividend payments at a stable growth rate could also serve as a practical criterion if the trend is expected to continue in the future.
In our opinion, WBA ticks all these boxes, therefore we can continue with our evaluation.
Let us take a closer look, what is actually the GGM. The following formula described the mathematics behind the model:
GGM (wallstreetprep.com)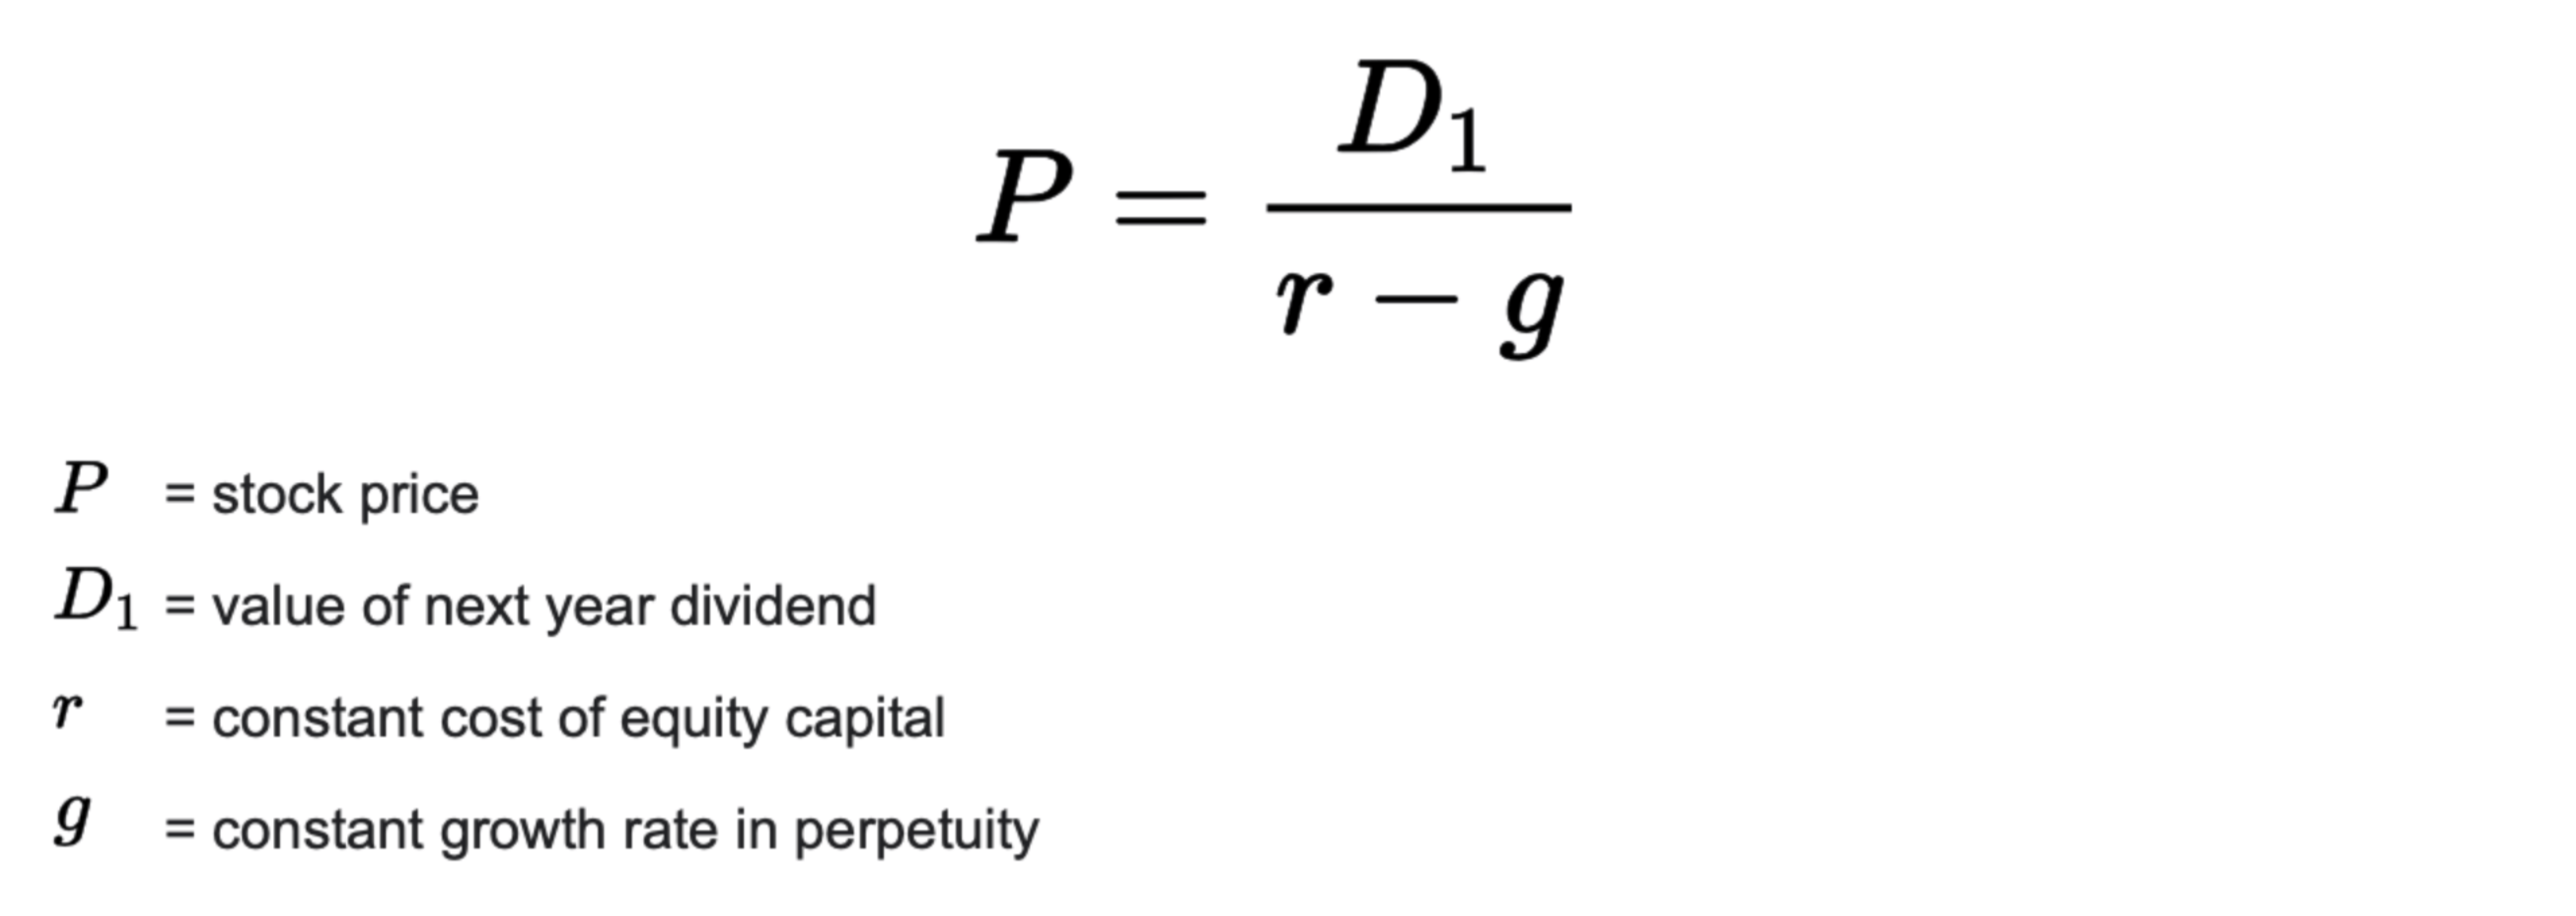
In order to determine a meaningful and realistic range of fair values, we need to define a realistic set of assumptions, including the constant growth rate in perpetuity and the required rate of return.
1.) Required rate of return
For the required rate of return normally we prefer to use the firm’s weighted average cost of capital (WACC). This is estimated to be 9% in WBA’s case.
WACC (finbox.com)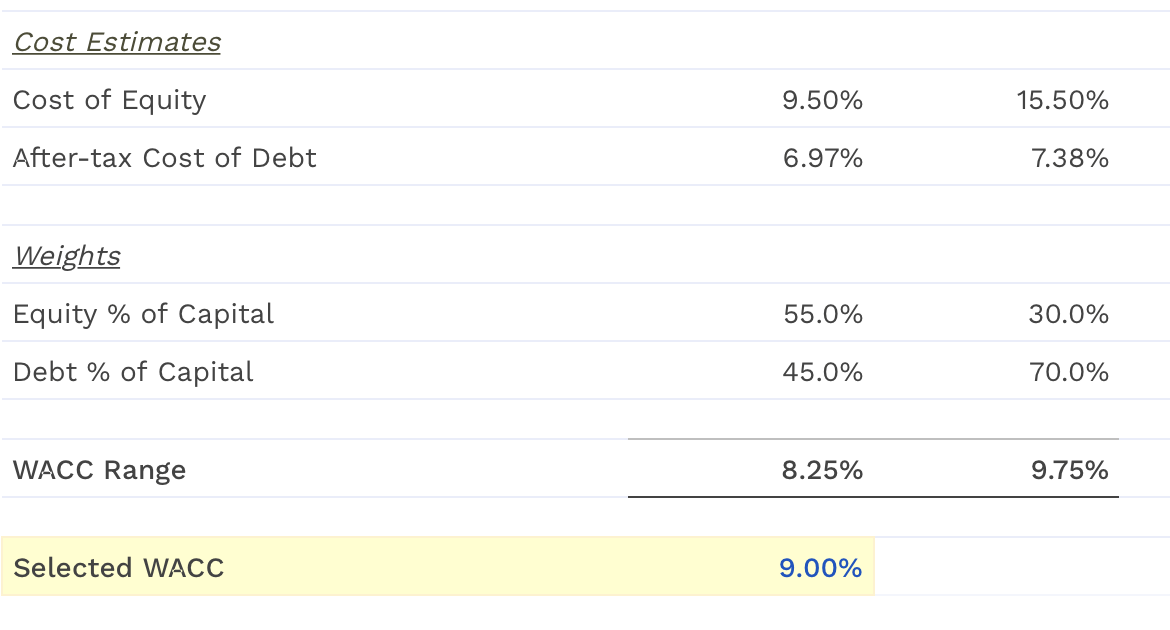
2.) Constant dividend growth rate in perpetuity
In order to define a reasonable range, we have to take a closer look at WBA’s historic dividend growth rate. Important to note here that the growth rate has a substantial impact on the calculated fair value. Assuming unrealistically high growth rates can lead to a significant overestimation of the fair value.
Dividend growth (Seeking Alpha)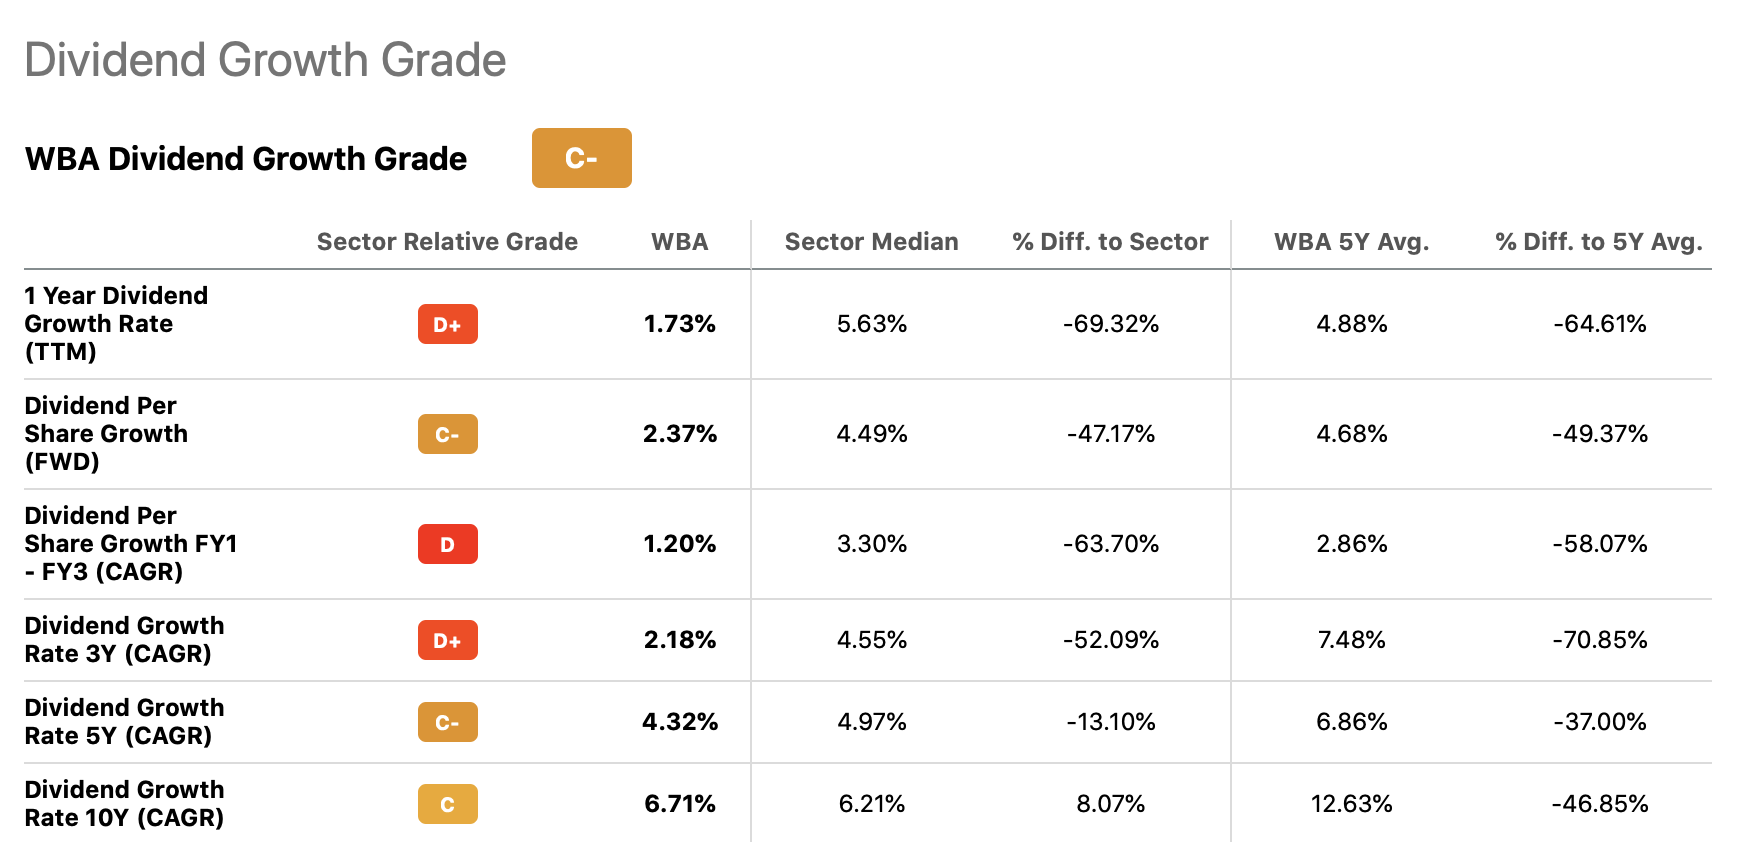
Based on historical dividend growth rates, a range of 1.5% to 4.5% could be appropriate for our calculations.
Setting in the 9% required rate of return in the formula and the above-defined range of growth rates, we get the following results, in USD per share:
Results (Author)
As the stock is currently trading around $39 per share, it appears that there could be further upside potential for investors, in case the dividend growth rate would exceed 4%.
Other considerations
We also have to appreciate the limitations of the model. For example, the model does not capture the potential changes in the number of share outstanding or certain company specific risks.
Reducing the number of shares outstanding
In the past years, WBA has been committed to return value to its shareholders by reducing the number of shares outstanding.
Share outstanding (Seeking Alpha)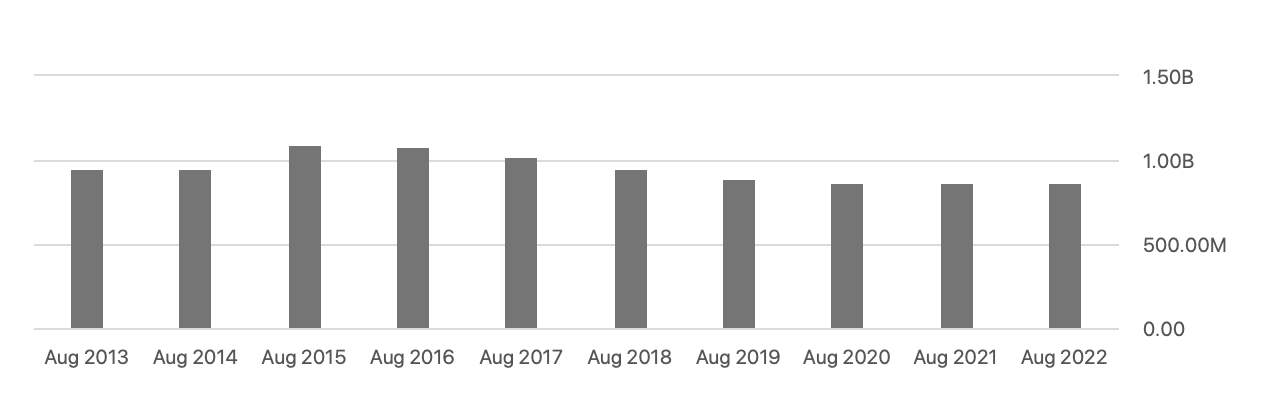
Investors can often prefer share buybacks over dividends due to potential tax efficiencies. It can be also advantageous for firms as they are not obliged to buy back a certain amount of shares each quarter, therefore their financial flexibility is positively impacted.
Risks
In this section, we are going to focus on company specific risks that can have a substantial impact on the share price or on the firm’s ability to continue paying the dividends. For the complete list of risks, see the firm’s latest 10-K report. One risk that we would like to underline here is related to the current macroeconomic environment.
“Changes in economic conditions could adversely affect consumer buying practices.”
As the consumer confidence levels are at historic lows in the United States, consumers may not purchase certain discretionary, non-essential items. Alternatively, they may choose to purchase cheaper, lower cost alternatives, which can have an impact on the firm’s sales results.
Future growth
Future growth is only reflected in the dividend discount model through dividend growth. However that may not be the only component of growth.
The firm’s near term guidance appears quite promising, which may allow the firm to grow dividends at a higher rate in the near term, causing our fair value estimation to be too conservative.
- Expecting fiscal year 2023 adjusted EPS of $4.45 to $4.65 as strong core business growth is more than offset by lapping fiscal year 2022 COVID-19 execution, and currency headwinds
- Raising U.S. Healthcare fiscal 2025 sales target to $11 billion to $12 billion, with the segment expected to achieve positive adjusted EBITDA by fiscal year 2024
- Increased visibility to the company’s long-term growth algorithm, building to low-teens adjusted EPS growth in fiscal year 2025 and beyond
Takeaways
The firm has a strong track record of returning value to its shareholders in the form of dividends. They have been growing these annual payments each year in the past 30 years.
According to the GGM, the firm appears to be fairly valued, with potential upside.
The model does not account for the positive impact of potential future share buybacks, for certain company specific risks and for near term growth that may exceed our long term estimates.
For these reasons we rate WBA’s stock as “buy”.
Be the first to comment