

piranka
(This article was co-produced with Hoya Capital Real Estate)
Introduction
There are so many ETFs trading in the United States that firms must have a hard time coming up with clear names for what the ETF invests in. Since Vanguard already had an International stock ETF, when they added a second one, based on a different index (same provider), they had to call it “All World-Ex US”. This article reviews both Vanguard, FTSE indexed ETFs:
- Vanguard Total International Stock ETF (NASDAQ:VXUS)
- Vanguard FTSE All-World ex-US ETF (NYSEARCA:VEU)
But since non-US stocks have lagged behind their counterparts, why invest there at all is a valid question.
portfoliovisualizer.com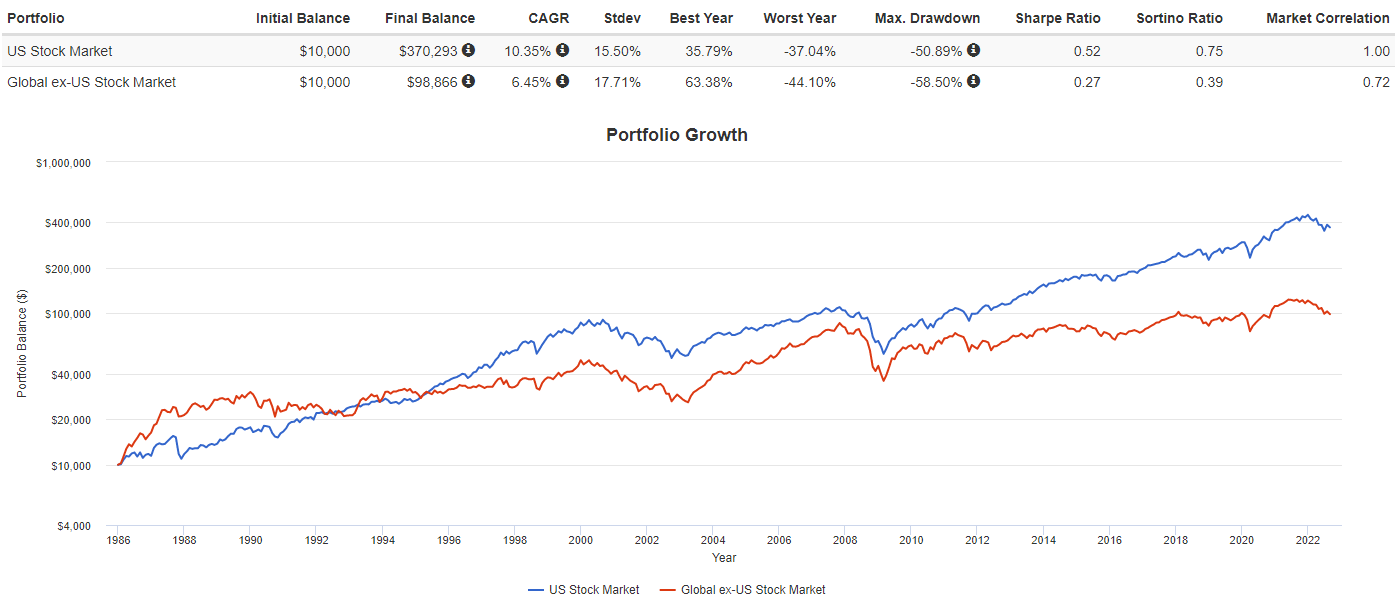
One answer is the .72 correlation factor to US stocks. Some allocation, while reducing overall return, should result in lower risk statistics than a 100% US allocation. Indeed this does happen with little harm to the Sharpe ratio.
portfoliovisualizer.com
Vanguard Total International Stock ETF review
Seeking Alpha describes this ETF as:
The investment seeks to track the performance of a benchmark index that measures the investment return of stocks issued by companies located in developed and emerging markets, excluding the United States. VXUS tracks the FTSE Global All Cap ex US Index, a float-adjusted market-capitalization-weighted index. The ETF started in 1996.
Source: seekingalpha.com VXUS
VXUS has $340.7b in AUM and comes with a 7bps fee from Vanguard. The current yield is 3.9%.
Index review
FTSE provides this information about their Index:
The FTSE Global All Cap ex US Index is part of a range of indices designed to help US investors benchmark their international investments. The index comprises large, mid and small cap stocks globally excluding the US. The index is derived from the FTSE Global Equity Index Series (GEIS), which covers 98% of the world’s investable market capitalization. Stocks are selected and weighted to ensure that the index is investable, plus stocks are screened to ensure that the index is tradable.
Source: research.ftserussell.com Index
research.ftserussell.com Index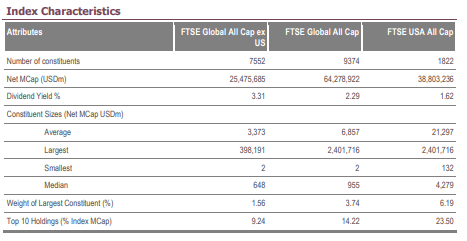
By including data about the USA-only index, investors can see how excluding those stocks affects the values of the index used by VXUS.
VXUS holdings review
advisors.vanguard.com; compiled by Author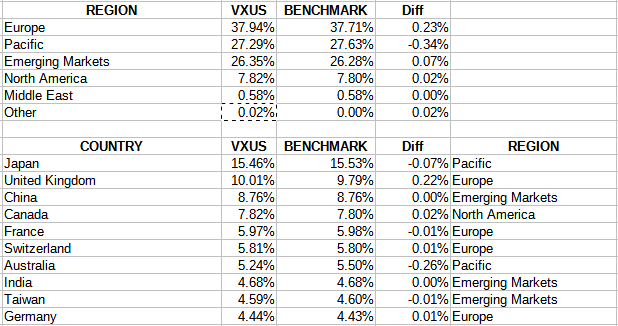
The Index lumps all Emerging Market stocks together, separate from their underlying region. For investors wanting their first exposure to EM stocks, VXUS provides that with a 26+% allocation there. As expected, China and India are the largest EM exposures. There are 45 country exposures in VXUS.
Next is the sector allocations. As with the above data, VXUS is following the Index closely.
advisors.vanguard.com; compiled by Author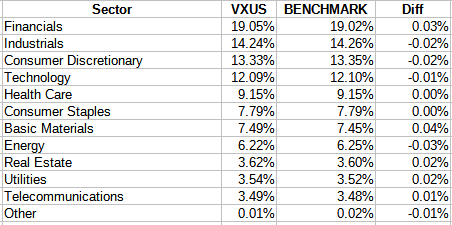
Unlike many US-only indices, Technology stocks are not the dominant sector. Banks are some of the largest market-cap stocks in EM countries, which helps explain why Financials is the top sector.
Top holdings
advisors.vanguard.com; compiled by Author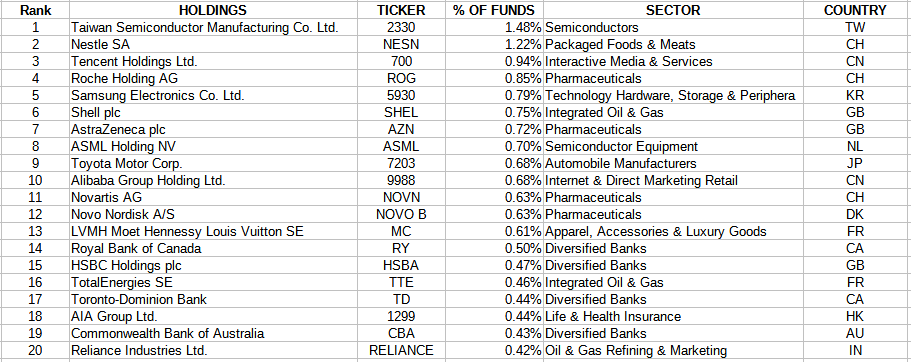
Even with over 7500 stocks, the Top 20 come to almost 14% of the portfolio. The smallest 6000 stocks come to 20% of the portfolio.
VXUS distribution review
seekingalpha.com VXUS DVDs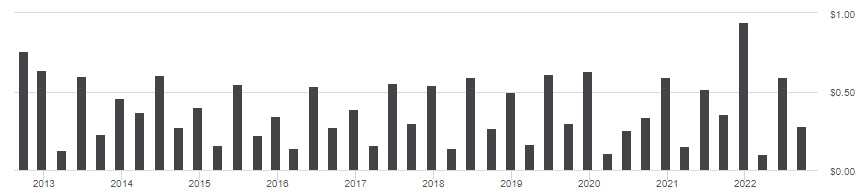
This up/down pattern, which we will see in VEU also, is the result of several countries where payouts occur semi-annually, not quarterly. Payouts have grown by 6+% over the last five years. Seeking Alpha gives VXUS an “A-” grade for their payout results.
seekingalpha.com VXUS scorecard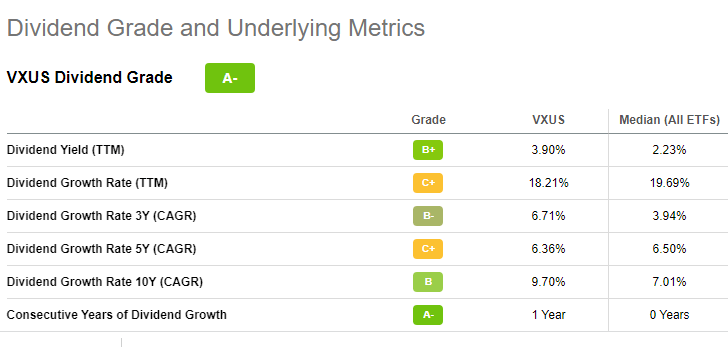
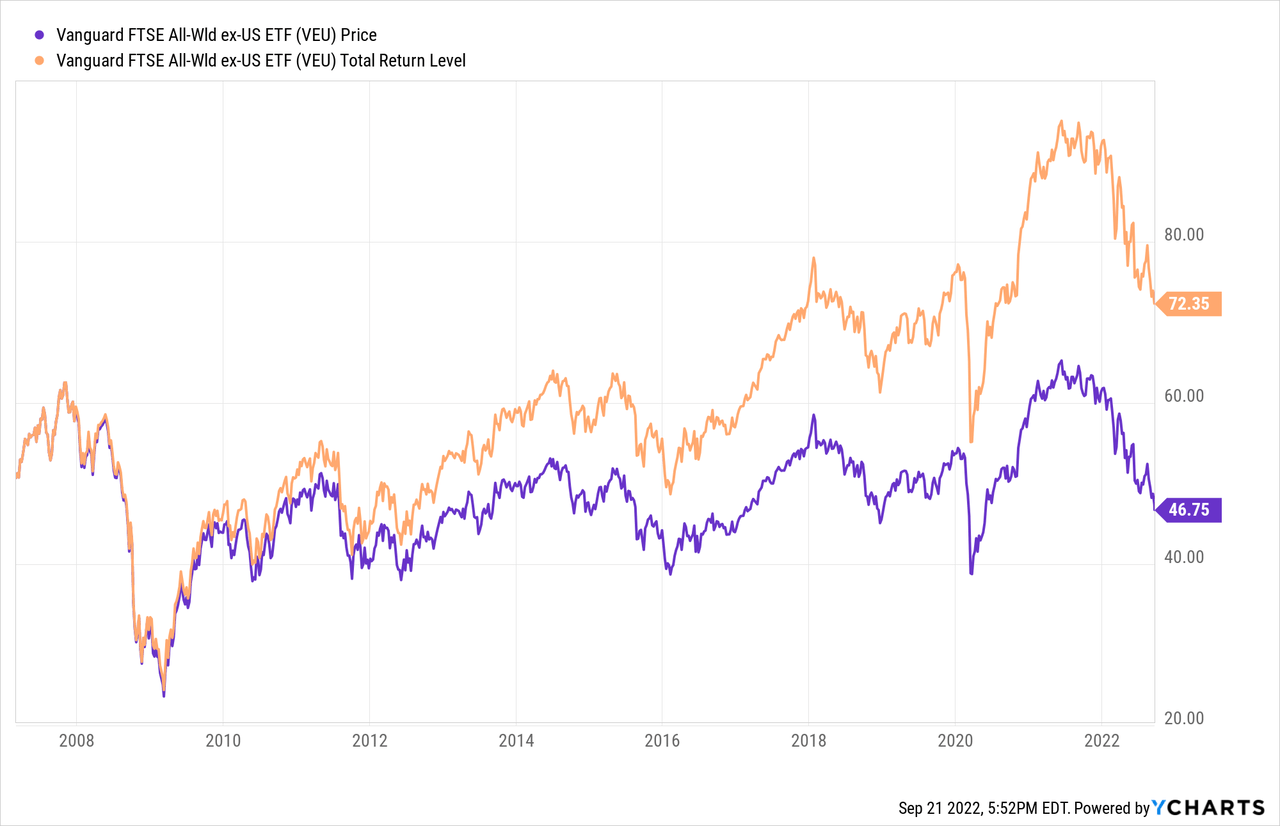
Vanguard FTSE All-World ex-US ETF review
Seeking Alpha describes this ETF as:
The investment seeks to track the performance of a benchmark index that measures the investment return of stocks of companies located in developed and emerging markets outside of the United States. The fund employs an indexing investment approach designed to track the performance of the FTSE All-World ex US Index. VEU started in 2007.
Source: seekingalpha.com VEU
VEU has $46b in AUM and Vanguard also charges 7bps in fees for this ETF. The current yield is 3.8%, slightly lower than what VXUS provides.
Index review
FTSE provides this information about their Index:
The FTSE All-World ex US Index is one of a number of indexes designed to help investors benchmark their international investments. The index comprises Large and Mid cap stocks providing coverage of Developed and Emerging Markets excluding the US. The index is derived from the FTSE Global Equity Index Series (GEIS), which covers 98% of the world’s investable market capitalization. Stocks are selected and weighted to ensure that the index is investable, plus stocks are screened to ensure that the index is tradable.
Source: research.ftserussell.com Index
research.ftserussell.com Index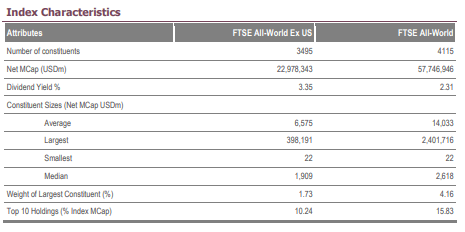
Again, investors can see what excluding US stocks does to the data values of the index used by VEU. Comparing some key data points between the two indices, we see:
| Factor | VXUS index | VEU Index |
| Stocks held | 7552 | 3495 |
| Median Mkt-Cap | $648m | $1909m |
| Smallest MC | $2m | $22m |
| Top 10 % | 9% | 10% |
The only description difference is the Index used by VEU doesn’t mention Small-Cap stock inclusion, and that is reflected in the value differences shown above.
VEU holdings review
advisors.vanguard.com; compiled by Author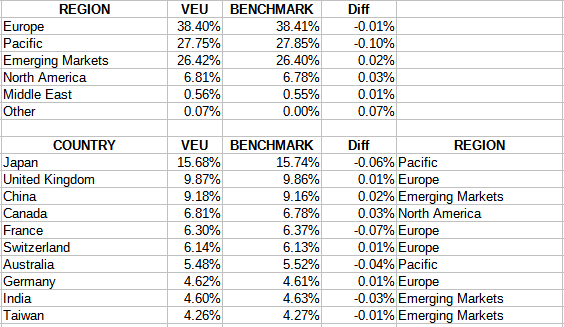
Compared to VXUS, VEU has slightly more exposure to Europe and less in North America. The top countries are all the same, with the Top 7 in the same order.
advisors.vanguard.com; compiled by Author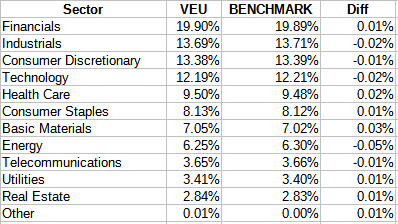
I will compare sectors later. Like VXUS, VEU is adhering to its benchmark very closely in its allocations.
Top 20 holdings
advisors.vanguard.com; compiled by Author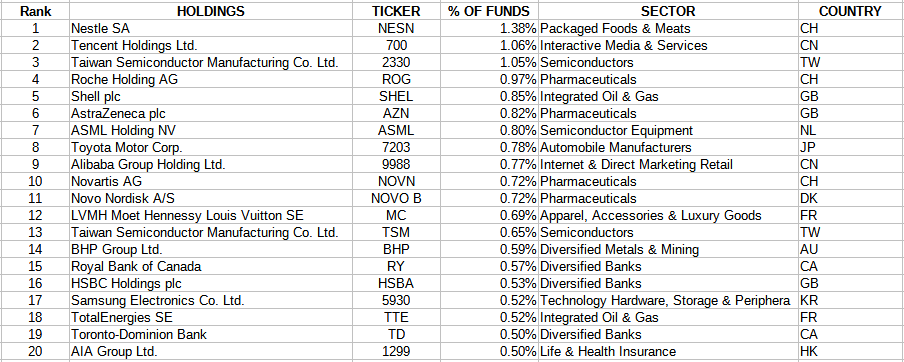
The ETFs show a 90% overlap in their Top holdings, though not in the same order. The Top 20 here are 14% of the portfolio, with the bottom 2100 stocks accounting for only 10% of the portfolio.
VEU distribution review
seekingalpha.com VEU DVDs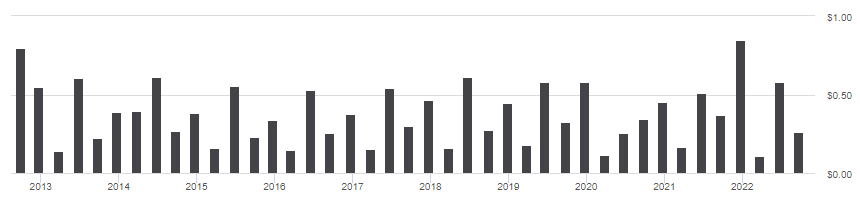
With slightly less payout growth (high 5%), VEU gets a “B+” grade from Seeking Alpha.
seekingalpha.com VEU scorecard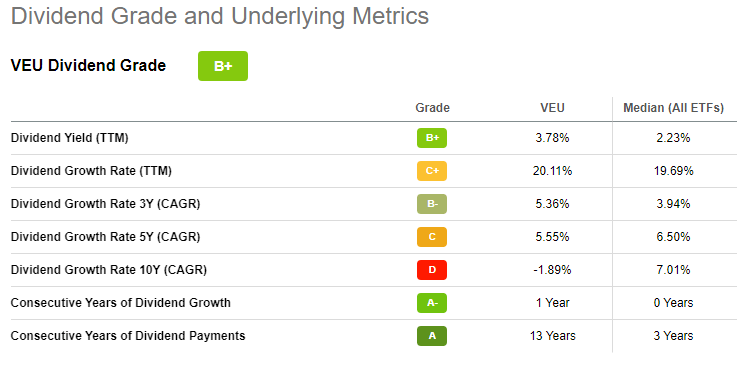
Comparing ETFs
ETFRC.com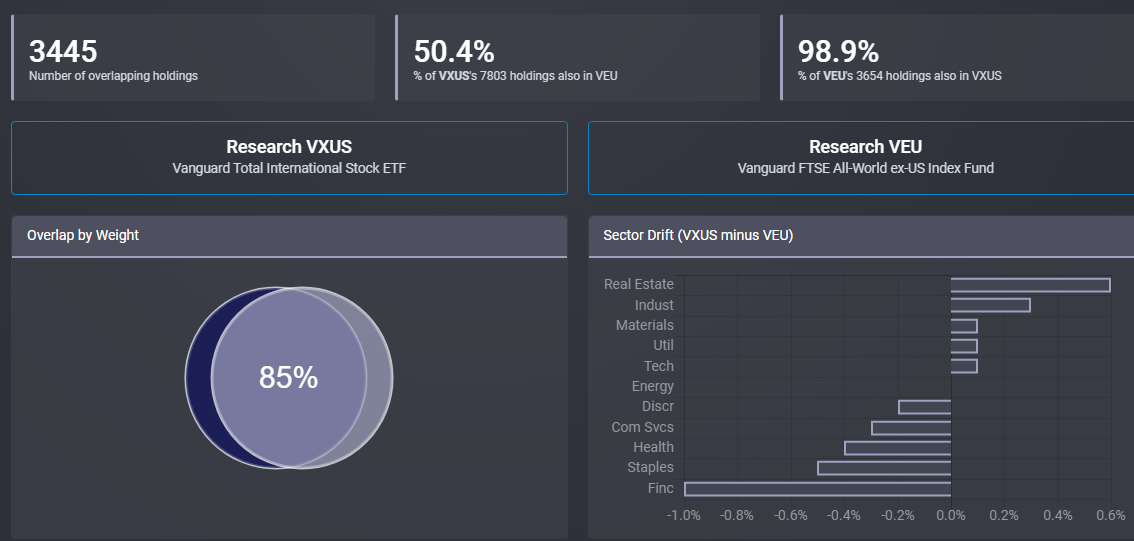
As I have seen with other ETFs using similar indices, VEU’s holdings are almost totally included within the other ETF’s holdings. Plus, the ETFs have an 85% overlap weighting. That said, there are sector allocation differences but all are under 1%. The next chart shows where the two ETFs differ the most in individual stock weightings.
ETFRC.com advisors.vanguard.com; compare tool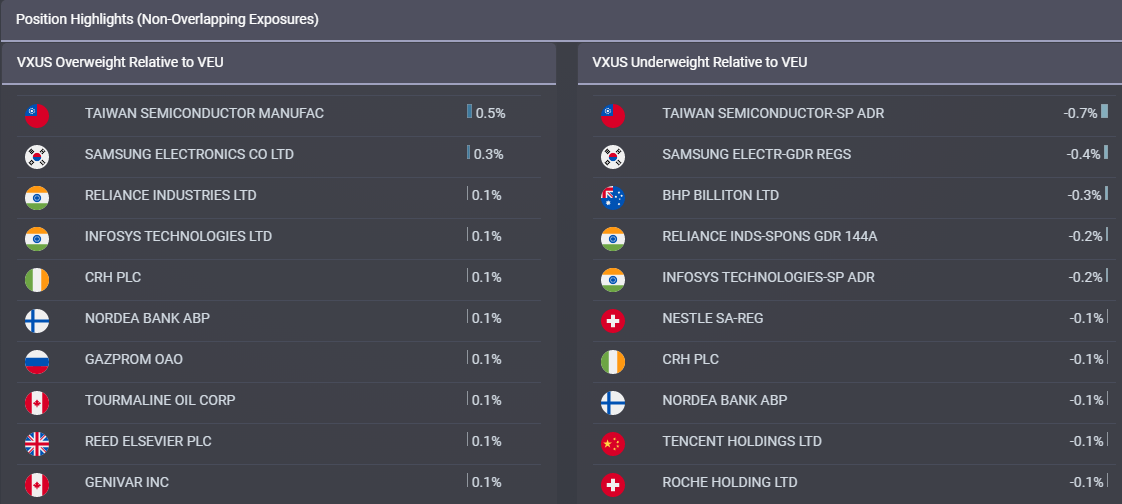
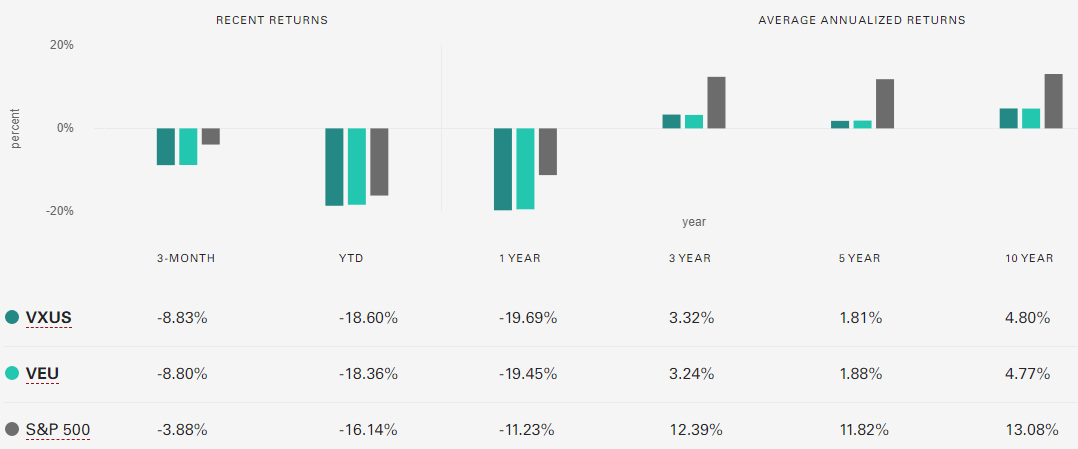
While performance numbers for the two international ETFs are close, they still are underperforming US stocks. Unless an investor thinks this will change, better returns (vs US stocks) is not a reason for owning either ETF covered here. Along with the number of stocks held, there are differences when it comes to market-cap allocations.
advisors.vanguard.com; compiled by Author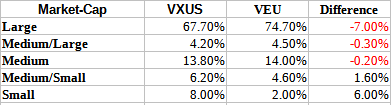
As mentioned before, VEU holds more weight in the larger size stocks, with little exposure to small stocks.
Portfolio strategy
While the yields on both ETFs reviewed, at close to 4%, best US-only ETFs except for some that focus on yield, as shown above, returns trail US-only stocks. International stocks do provide some correlation difference to US stocks, which would be a reason to own some.
PortfolioVisualizer.com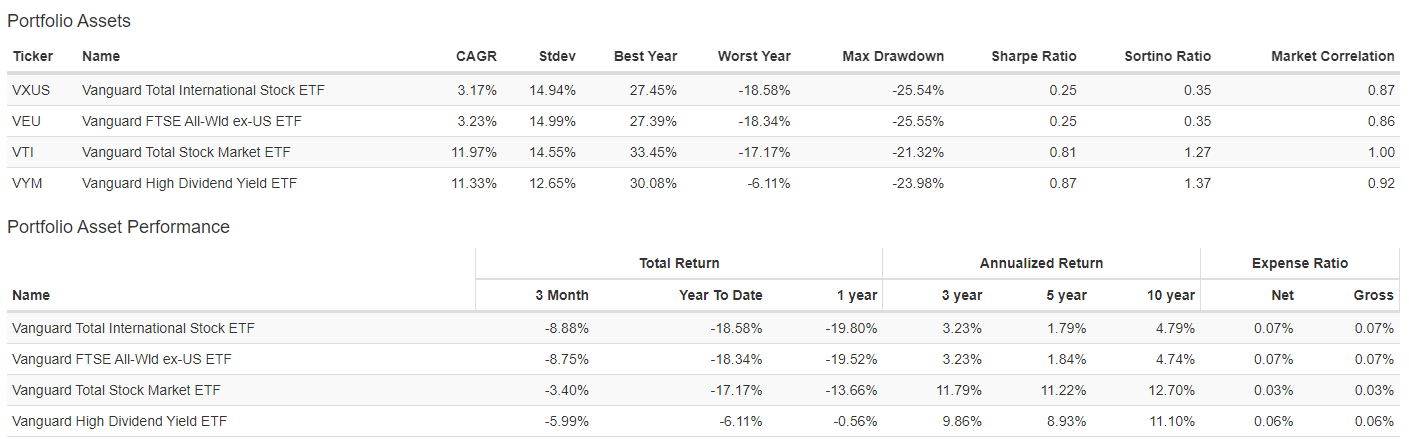
I added a popular High-Yield US ETF, the Vanguard High Dividend Yield ETF (VYM) as a yield/correlation equivalent to the international ETFs. If/when the USD weakens, these stocks should outperform, as they did from 2002 to 2007. With the FOMC possibly increasing the Fed rate after September by 125bps, that might be a while.
Be the first to comment