

Nastassia Samal/iStock via Getty Images
VOO represents the large-cap market as contained in the S&P 500 Index; VUG, the Vanguard Growth ETF, includes slightly more than half the stocks in the S&P 500 selected for Growth. It is heavy in tech investments. The two ETFs are broadly correlated in longer-term price movements. In the past, one has done meaningfully better than the other for periods as long as a decade, but they generally share the same long-term trend with leadership alternating for periods as long as a decade. The present moment is one of those times when leadership may be in the process of shifting. VOO is holding up much better during the market decline which started last year and has accelerated in 2022. This does not necessarily mean that a long term investor should automatically pile into the better performer at this or any other moment.
The Vanguard S&P 500 ETF (NYSEARCA:VOO) and the Vanguard Growth ETF (NYSEARCA:VUG) overlap in the sense that all stocks in VUG are also included in VOO. According to its fund profile VOO seeks to track the performance of the Standard & Poor‘s 500 Index using “full replication technique.” That’s an important detail because it means that VOO does not use approximations to track the index, but attempts to replicate the index by holding each stock in the same proportion as its weighting in the index. It doesn’t get more straightforward than that. In short, when you buy VOO you are buying the S&P 500 Index.
The S&P 500 is a large-cap capitalization-weighted index which provides excellent diversification. Capitalization weighting means that positions within the index are sized to reflect the market cap of the individual stocks. When the market cap of a company inside the S&P 500 Index rises, its weight in the S&P 500 also rises. This has the effect of increasing the percentage of the index made up of companies which are doing well with the result that their market cap increases. The biggest winners rise to the top and a glance at the slowly shifting Top Ten holdings tells you which companies have risen to dominate the business world. Investors in an index ETF like VOO thus participate fully in companies that are growing and increasing their market cap without having to do anything themselves. I wrote about the positive impact of cap-weighting (the title arguing “Big Winners Overpower Losers”) in this article.
Cap weighting is one of the factors which make VOO and all cap weighted indexes such a good passive investment. The S&P 500 Index is the mainstay of many institutional portfolios and is a leading retirement account option. With its extremely low cost of .03% VOO is a cheap way to own the entire large-cap market segment. Warren Buffett himself has left instructions in his will that the assets set aside in trust for his wife be invested 90% in the Vanguard S&P 500 index fund.
Dividing the S&P index into Growth and Value stocks provides investors with an additional option. VUG, the Vanguard Growth ETF, is comprised of the roughly 50% of the stocks contained in the S&P 500 which are classified as “growth stocks.” This would seem pretty straightforward but upon close examination it’s not so simple. For one thing it requires a means for dropping companies from the list as they fail to remain above some sort of line while promoting others. In either case the stocks chosen for the category are ranked by market cap, but market cap alone isn’t a sufficient way to define growth. VUG is instead based upon a detail methodology which proposes to define Growth with quantitative precision.
What Exactly Do We Mean When We Use The Term “Growth”?
“Growth” is often defined using the same principle used to define “pornography” by Supreme Court Justice Potter Stewart. Stewart famously remarked, “I know it when I see it.” It’s not hard to look at a long term chart of Apple (AAPL). Microsoft (MSFT), and Amazon (AMZN) and say, Hey, Apple, Microsoft, and Amazon are growth stocks. Their operating numbers confirm it. Looking back from their beginnings to the present moment it’s perfectly clear. It is strongly suggested by those four letter ticker symbols which mark them as NASDAQ stocks, but it’s only recently that so many S&P 500 leaders have had four letter symbols. Being included in a NASDAQ index is not enough to define growth, although it happens that Apple, Microsoft, and Amazon are currently the top three by market cap in both VOO and VUG as well as the Invesco QQQ ETF based on the NASDAQ 100.
VUG actually has an entirely different methodology than either VOO and QQQ and undertakes to define “growth” in a more rigorous way. I first noticed this about a decade ago when I stumbled upon the fact that Vanguard had begun to cite an unfamiliar model for some of its large cap funds. The new model was derived from the CRSP Indexes (Center For Research In Security Prices) developed by the University of Chicago Booth School Of Business. The Booth School approach is world famous for its quantitative approach to business and the markets. I won’t go into their mathematics in detail, but here’s the list of factors used in the CRSP methodology for defining growth and value:
GROWTH FACTORS USED IN MULTI-FACTOR MODEL
- Future Long-term Growth in Earnings Per Share
- Future Short-term Growth in Earnings Per Share
- Three-year Historical Growth in Earnings
- Three-year Historical Growth in Sales
- Current Investment-to-Assets Ratio
- Return on Assets
The estimates for both long and short term growth are sourced from I/B/E/S (Institutional Brokers’ Estimate System) which derives data from over 18,000 analysts. In my experience these future earnings per share estimates are the hardest questions I try to answer with “growth” stocks which I am considering individually. The I/B/E/S estimates produce crowd-sourced numbers which work well when dealing with an index like the CRSP Growth Index while the six categories provide a helpful conceptual framework when considering individual stocks.
The final four criteria for Growth, #3 through #6, are simple and easy to reduce to a number. After looking at the six factors, I think most of us see that it is minimally a better definition of growth than Justice Stewart’s “I know it when I see it” definition. It ultimately produces a composite number by which all stocks can be compared. Of particular note is that the CRSP methodology has nothing to say on the subject of price or valuation.
The Value model is very different as price and valuation are involved in all five criteria. Note that the terminology reverses common practice (Price-to-Book Value, for example, become Book Value To Price, making both comparable to Dividend Yield.)
VALUE FACTORS USED IN MULTI-FACTORS MODEL
- Book to Price
- Future Earnings to Price (3 years)
- Historical Earnings to Price (3 years)
- Dividends to Price
- Sales to Price
As opposed to the Growth Model, everything in the Value Model is a ratio involving Price. All stocks in every size category except microcap are put through quantitative analysis in both Growth and Factor models and assigned a composite number before being placed in the Growth or Value category and occasionally split between the two. They are then ranked by market cap the same way stocks are ranked and represented in other cap-weighted indexes. With CRSP, however, there are two major differences:
- Rebalances are done on a quarterly basis rather than daily except for events like mergers, acquisitions, etc. Stocks with market caps near the boundary of a market cap category are kept in a border area from which they may “migrate” at the end of quarterly reset up to large cap, say, or down to mid-cap. They do this by a multi-step formula which may place them half in the large cap index and half in the mid cap index.
- Interestingly, the same approach is used for a stock which is a borderline case when it comes to Growth and Value. Not only can they “migrate” from Growth to Value, or vice versa, but at some points in this process they may be represented 50/50 in both indexes. You can compare indexes and check for this if willing to take the trouble. It’s the reason that the Vanguard Growth ETF (VUG), though derived from the S&P 500 Index, contains 268 stocks, thirteen more than half the stocks in the 500 Index, which contains 510.
The above look at the construction and workings of CRSP Indexes shows the level of seriousness Vanguard brings to the concept of Growth. In effect it builds a Growth Index from the ground up with quantitative rigor (creating a Value counterpart with similar rigor). There is a logic in both sets of factors. Value investors look for stability, low price, moderate growth, and dividends. Those are the things the five factors select for, and many suggestions for dividend investment on this site make the case in terms of exactly those factors.
Growth factors are somewhat more elusive. The ones used by the CRSP Index around which the Vanguard Growth ETF is built nevertheless contain factors which I often use intuitively while evaluating growth prospects. I always look at three years of historical earnings and sales at a minimum along with Return on Assets as well as the ratio of Capital Expenditures to Total Assets. The more difficult Factors are the two involving the future, and I often feel that many unknown factors are involved in going out even 3 to 5 years. Aggregate future forecasts deriving from over 18,000 institutional analysts are more likely to be more successful as they represent the “wisdom of crowds.”
Now that we have a good working definition of “growth,” the next section looks at the kind of portfolio holdings it generates along with a few other metrics
Deconstructing The Top Ten Holdings Of VOO and VUG
The table below presents the Top Ten holdings of VOO and VUG as of the end of February 2022, and also, for reasons I will explain later, the Top Ten holdings of the Invesco QQQ ETF based on the Nasdaq 100 Index which is updated as of the end of March 2022. The first thing to notice is that the first seven of the Top Ten stocks of each ETF are the same, which is not surprising because all are based on cap weighted indexes in which the top performers by market cap rise to the top. In VOO, which contains all 510 stocks in the S&P 500, two Value stocks break into the Top Ten, Berkshire Hathaway B (BRK.B) at #8 and UnitedHealth (UNH) at #10. In VUG, it’s the growth stocks Visa (V) and Home Depot (HD) which break into the Top Ten.
In the QQQ ETF, based on the NASDAQ 100, two NASDAQ stocks recognizable as such by their four digit ticker symbols break into the last two spots in the Top Ten, Broadcom (AVGO) and Costco (COST). QQQ is included because it is a fairly close proxy for VUG and in longer term charts will serve as a proxy for VUG which was not in existence until 2004. VOO did not come along until 2010 so that for longer term charts I will use the SPDR S&P 500 ETF (SPY) as proxy for VOO before 2010; it does not require information on holdings or metrics because it is substantially identical to VOO.
| VOO | VUG | QQQ | |
| 1 | Apple 6.92% | Apple 12.61% | Apple 12.49% |
| 2 | Microsoft 6.03% | Microsoft 10.99% | Microsoft 10.13% |
| 3 | Amazon 3.60% | Amazon 6.49% | Amazon 7.27% |
| 4 | Alphabet A 2.18% | Alphabet A 3.98% | Alphabet C 3.66% |
| 5 | Alphabet C 2.03% |
Alphabet C 3.57% |
Alphabet A 3.67% |
| 6 | Tesla 1.90% | Tesla 3.43% | Tesla 4.88% |
| 7 | NVIDIA 1.64% | NVIDIA 2.84% | NVIDIA 4.21% |
| 8 | Berkshire B 1.58% | Meta A 2.45% | Meta 3.37% |
| 9 | Meta 1.34% | Visa 1.71% | Broadcom 1.87% |
| 10 | United Health 1.20% |
Home Depot 1.62% |
Costco 1.86% |
| % of total net assets | 30.40% | 49.68% | 53.6% |
| Number of Holdings | 510 | 268 | 103 |
The most interesting fact included in the above table is the number at the bottom line for total holdings. VUG contains only a little more than half the number of stocks as the full S&P 500 holdings of VOO while the QQQ holds only about one fifth. The fact that VOO contains the entire S&P 500 makes it less risky. It’s the smaller number of total holdings that makes the Top Ten of both VUG (49.68%) and QQQ (53.6%) so much larger than the 30.40% in VOO. Neither includes the Value half of VOO, with one effect being that both are more risky. It’s “addition by subtraction” which make the growth stocks in VUG and QQQ both more risky and more likely to perform powerfully in bull markets favoring Growth.
Charts Show Alternating Periods Of Market Leadership
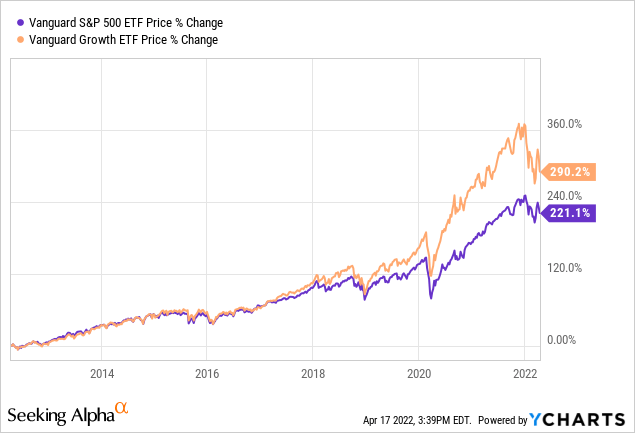
When growth stocks like the growth/media companies are in the ascendant, their rapid increase in price and market share is amplified by having fewer slow-growing Value holdings. On the other hand, when growth stocks are underperforming, the fact that they have fewer stocks to balance their decline works against the index as a whole. That important statistical fact is evident in the following five charts, starting with the most recent 10 years in which Growth companies were very much the leaders and VUG significantly outperformed VOO.
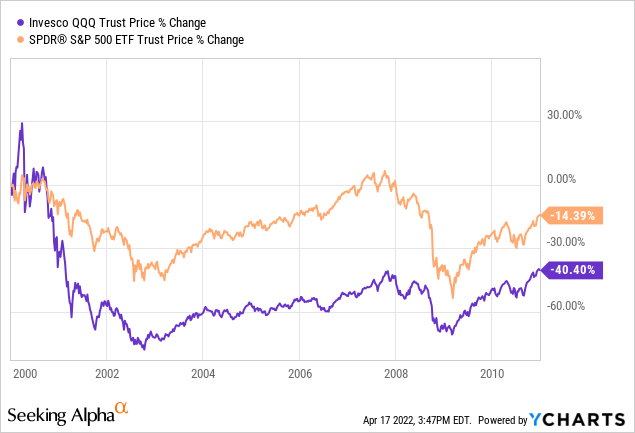
The next two charts use SPY as a very exact proxy for VOO and QQQ as a somewhat less exact proxy for VUG. The chart covers the decade starting in the year 2000 as the dot.com growth/tech favorites crashed. The Value components withstood the tech crash very well, and despite the fact that they performed poorly from 2007 to 2009 they continued to have better results for the decade of the 20 aughts. The chart contains a cautionary note, however. For the ten years from 2000 through 2010, both indexes were in the red. After the past decade it’s easy to believe stocks always go up, but looking backward twice as far tells you clearly that this is not always the case and the point where you enter the market matters.
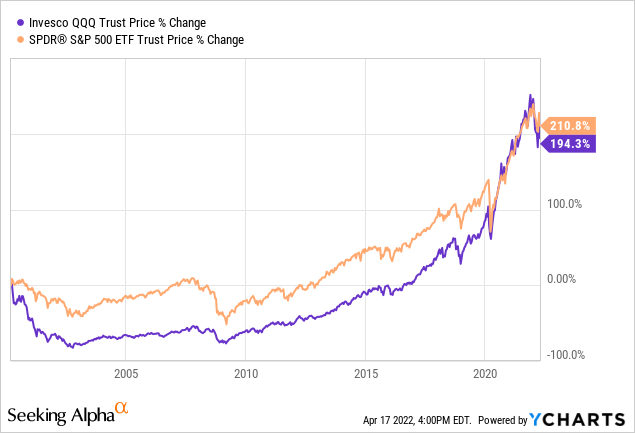
The chart that follows puts together the entire period from 2000 to the present. Rather than starting on the first day of 2000 as I did in the previous chart I used March 9, 2000, which happened to be the exact peak of the last major speculative growth stock cycle. Looking closely you will see that the S&P 500 (SPY) led the growth stock proxy (QQQ) through 2019 – more than 19 years. Both indexes declined sharply starting in late February 2020 and bounced sharply off the March 23, 2020, pandemic bottom. After that, growth stocks finally caught up until the 2022 year-to-date decline left them behind by a small margin. If the recent declines prove to mark a cyclical peak for growth, this suggests that growth and the market as a whole may produce about the same result if measured peak to peak from eras of growth leadership. And again it’s worth noting that the overall return of around 200% is not spectacular for 22 years.
The final two charts show recent performance of growth versus the S&P 500 once again using VOO and VUG.
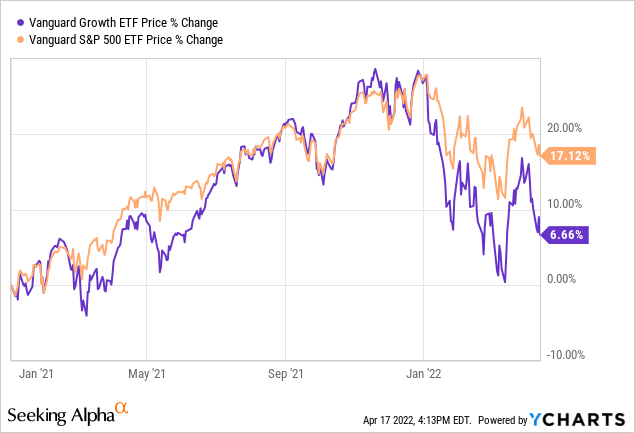
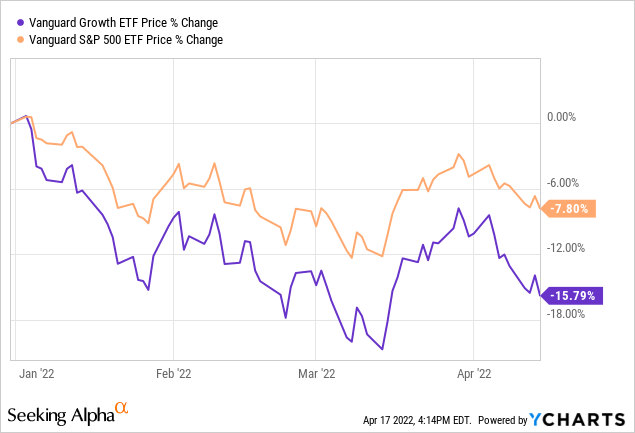
Both charts show VOO performing better than VUG. The first chart from January 1, 2021, to the present shows both ETFs rolling over in the last months of 2021 into a sharp decline in the first months of 2022. What charts show is always somewhat in the eye of the beholder, but if the present trend continues the market may be in a decline in which VOO with its large number of Value stocks has performed better.
VUG And VOO Key Metrics
The tables below provide a concrete sense of the growth category as opposed to the category which includes both growth and value.
| Equity characteristics | ||
| Vanguard S&P 500 ETF | Vanguard Growth ETF | |
|---|---|---|
| Median market cap | $207.4 billion As of 03/31/2022 | $350.2 billion As of 03/31/2022 |
| Price/earnings ratio | 22.1x As of 03/31/2022 | 33.0x As of 03/31/2022 |
| Price/book ratio | 4.3x As of 03/31/2022 | 9.7x As of 03/31/2022 |
| Return on equity | 22.3% As of 03/31/2022 | 29.1% As of 03/31/2022 |
| Earnings growth rate | 20.9% As of 03/31/2022 | 28.8% As of 03/31/2022 |
| Turnover rate | 2.3% As of December | 7.6% As of December |
Almost every line in the table provides illustrations of differences between pure growth and growth plus value:
- The larger Median Market Cap for VUG is much larger than that of VOO because in the Growth Index the giant growth stocks listed in the Top Ten overpower the rest of the 268 stock index.
- The Price/Earnings Ratio and Price/Book Ratio are lower for VOO because low ratios in these categories (though inversely expressed) are specific Value qualities not included in the VUG ETF.
- The Return on Equity and Earnings Growth Rate are higher for VUG because Return on Equity is closely linked to the growth criterion of Return on Assets while earnings growth rate in the past as well both short and long term future are three of six criteria for Growth.
- As for turnover rate, the amount of movement in growth stocks is again spread over fewer total holdings.
| Equity sector diversification | ||
| Vanguard S&P 500 ETF | Vanguard Growth ETF | |
|---|---|---|
| As-of date | 02/28/2022 | 02/28/2022 |
| Basic materials | 2.26% | 1.59% |
| Communication services | 9.64% | 14.37% |
| Consumer cyclical | 11.68% | 18.95% |
| Consumer defensive | 6.62% | 2.37% |
| Energy | 3.68% | 0.41% |
| Financial services | 13.61% | 5.98% |
| Health care | 13.41% | 7.65% |
| Industrials | 8.27% | 3.94% |
| Real estate | 2.62% | 2.27% |
| Technology | 25.63% | 42.50% |
| Utilities | 2.57% | 0.00% |
It’s no surprise that VUG owns a much higher percentage of both Tech and Communication Services than VOO, or that VUG owns more Consumer Cyclicals while VOO owns more Financials, Consumer Defensive, Health Care, Industrials, Energy, and Utilities. It’s the latter four which are enabling VOO to hold up better in this year’s market decline so far.
Two other important differences not covered in the above tables are dividends and expenses. Both VOO and VUG have the characteristic Vanguard low expense ratios with VOO at .03% and VUG at .04%. The slightly higher VUG expense ratio reflects its higher turnover rate. The dividend yield of VOO is 1.37% while the dividend yield for VUG is .54%.
ETF Grades And Quant Ratings
There are no Wall Street Analysts with ratings on either VOO or VUG. SA Authors are neutral with 1 Strong Buy, 4 Holds, and 1 Sell on VOO and a single Hold Rating on VUG.
The ETF Grades And Quant Ratings On VOO are strong with A Ratings for Momentum, Dividends, and Asset Flows and A+ Ratings for Expenses and Risk.
Quant Rankings on VOO
Ranked in Asset Class (US Equity) 64 out of 468
Ranked in Sub Class (Large Blend) 21 out of 133
Ranked Overall 266 out of 1976
The ETF Ratings on VUG share the A+ Expense Rating with VOO. Its Momentum is B and Asset Flows C+ are consistent with the last of the above charts which show VOO doing better for 2021 and 2022 YTD helped by the fact that it is helped by its 50% in Value. Dividends are lower for VUG as noted in the previous system, and the focus on Growth alone elevates its Risk Grade compared to VOO’s A+/
Quant Rankings On VUG
Ranked in Asset Class (US Equity) 148 out of 468
Ranked in Sub Class (Large Growth 16 out of 67
Ranked Overall 620 out of 1976
Both VOO and VUG are ranked positively in all categories, although VOO has a slightly higher rank in percentile for Large Blend than VUG has for Large Growth. VOO is ranked higher among both US Equities and Overall stocks on SA.
Is VOO Or VUG The Better Buy?
It depends. Part of the answer comes from factors extrinsic to the ETFs themselves. Here are some things to bear in mind:
- Both VOO and VUG are excellent ETFs for long term investors. Investors who do not follow the market closely should probably hold the Vanguard S&P 500 ETF or an equivalent fund or ETF. This very general suggestion is based on the same reasoning used by most retirement plans with offerings including one of the low cost S&P 500 vehicles as a choice. The idea is to own the large-cap market as a whole and to stick to it through ups and downs despite the fact that market leadership changes from time to time. This happens to coincide with the message of the charts at this particular moment.
- Other things being equal, if you primarily want growth and can accept some volatility, you may prefer VUG.
- If you prefer growth balanced by the stability provided by diversification that includes value stocks, you might prefer to stick with the Vanguard S&P 500 ETF.
- Other things are rarely equal.
- Market preference for Growth and market preference for Value differ from season to season and sometimes from decade to decade.
- Market trends are hard to project in real time and are only clear after the fact. Keep this in mind if tempted to project the current trend into the future.
Studies based on valuation suggest to many observers that returns for equities, regardless of how they are sliced and diced, are likely to be below normal for the next decade. The above charts show a market which is currently trending down. There is also evidence in the short term charts comparing Growth and Value that after a decade of Growth dominance Value may be entering a significant period of leadership.
These hints of overall market behavior and future leadership of Value may or may not come to pass. The conventional wisdom argues that efforts to time the market have not succeeded for most investors. Buying an instrument like VOO at regular intervals is a good idea at most times, particularly when buying regularly in a 401K account. Investing similar amounts regularly over a period of time accumulates more shares when the market is down and lowers average cost. If you are young enough to have a long investment horizon, this may be the way to go.
The counter-argument is that VUG historically grows faster over the very long term, and might therefore produce better returns if you have the steady nerves to hold on through bad periods. The 22-year chart shows that Growth and Value had about the same return from 2000 to the present, but one should not forget that the result measured from one Growth peak to another.
For the moderately adventurous investor with reasonably high risk tolerance, a mixture of the two ETFs might serve to juice returns a bit by overweighting Growth. It’s arguable that the current correction in Growth, especially the large cap Growth leaders, may not be as deep in price or extended in time as the Growth crash of 2000-2003. This argument is based on the idea that Growth stocks of the present era have significant and growing profits, unlike many of the dot.com stocks of 2000, and that they are also much more moderately priced.
Stocks like Apple, Amazon, and Alphabet may look expensive compared to value stocks which have lower P/E ratios but if they are able to grow earnings at 20% or more annually, the gap in valuation could close quickly. A stock growing at 20% a year, priced at 33 times earnings, and selling at a P/E of 29 would see its P/E shrink to the overall market P/E in two years. Those are in fact the numbers for the Vanguard Growth ETF in the table above labelled Equity Characteristics. Taking this principle into account, the VUG ETF might turn out to be the better bet for the long term, especially if the Growth sector presents a little deeper dip to buy.
There’s no easy and guaranteed answer when it comes to choosing between VOO and VUG. Both are good for what they do. As with many investment choices you yourself are the ultimate factor. Your choice will be most heavily dependent on your own goals, your best estimate of the economic environment and future, your time frame, and your risk tolerance.
Be the first to comment