

Antonio_Diaz/iStock via Getty Images
(This article was co-produced with Hoya Capital Real Estate.)
In this article, I am going to take a close look at two venerable Vanguard ETFs, Vanguard S&P 500 ETF (NYSEARCA:VOO) and Vanguard Total Stock Market ETF (NYSEARCA:VTI).
This author has had a long relationship with VTI. This ETF was the subject of the very first article I wrote as ETF Monkey for Seeking Alpha, all the way back in June 2015. It then became 1 of 3 ETFs in The ETF Monkey Vanguard Core Portfolio. It has been an uninterrupted core holding in my personal portfolio since October 17, 2013. Late last year, I also included VTI in the ETF Reliable Retirement Portfolio, for which I recently released my Q1 2022 update and commentary.
As one of the premier total-U.S. market ETFs, VTI is certainly a solid core holding for any portfolio. At the same time, it is good for all of us, including myself, to step back, consider the assumptions we make about anything we do, and see if they hold up to scrutiny.
In this article, I am going to do exactly that. In actuality, the primary focus of this particular article is going to be VOO. First, I am going to go into some depth in comparing the structure of VOO against VTI, with a view to looking at their similarities as well as their differences. Next, I am going to do some analysis of their respective track records when it comes to performance. In the course of doing so, I am going to revisit certain assumptions I have made in the past, and determine whether they have actually proved correct. Finally, I will try to piece all of this together in considering the road ahead.
VOO vs. VTI – Structure
Let’s first talk about some of the commonalities between these two excellent ETFs. First, both have been around for many years and established a solid track record; VOO with an inception date of 9/7/2010 and VTI going all the way back to 5/24/2001. Secondly, both are extremely large; VOO with $277.4 billion in assets and VTI slightly larger, at $279.1 billion. Finally, both offer rock-bottom expenses, with matching expense ratios of .03% and trading spreads of .01%.
In other words, when it comes to longevity, size, and expenses, there is nothing of any consequence to differentiate the two funds. Either ETF will serve admirably as the core U.S. stock holding in your portfolio.
Before we go further, please bear with me as I digress for just a second with a pet peeve I have with a few articles I have seen on VTI, sadly some even here on Seeking Alpha. I’m not going to call any out specifically, because my aim is not to cast aspersions, simply to make a point. In the last paragraph, I refer to both VTI and VOO as core holdings in a portfolio. And that is exactly what they are. For better or worse, VTI represents the entire U.S. stock market! So any article, or title, breathlessly telling you to buy or sell VTI, as if you were trading a single stock, at the very least does VTI a disservice. If you are a diversified investor, ETFs such as VTI or VOO always deserve some place in your portfolio. They allow you, in one vehicle, to both select the specific weighting you desire in U.S. stocks, as well as easily rebalance to your chosen weighting with a single trade.
OK, rant over. Thanks for letting me get that off my chest. Let’s proceed.
A couple of paragraphs back, I said that either ETF will serve admirably as the core U.S. stock holding in your portfolio. That statement serves as a hint to where we are about to go next. While we will consider differences between the two ETFs, I will try to explain clearly why you really only want to select one as your core U.S. stock holding. You can hold both if you want—it is a free country after all—but you don’t need to.
Why is this the case?
For the answer, let’s take a close look at a most helpful combination graphic from the Vanguard Investor websites for VOO and VTI, respectively.
First, for VOO:
VOO – Sectors & Top 10 Holdings (Vanguard Investors Website – VOO)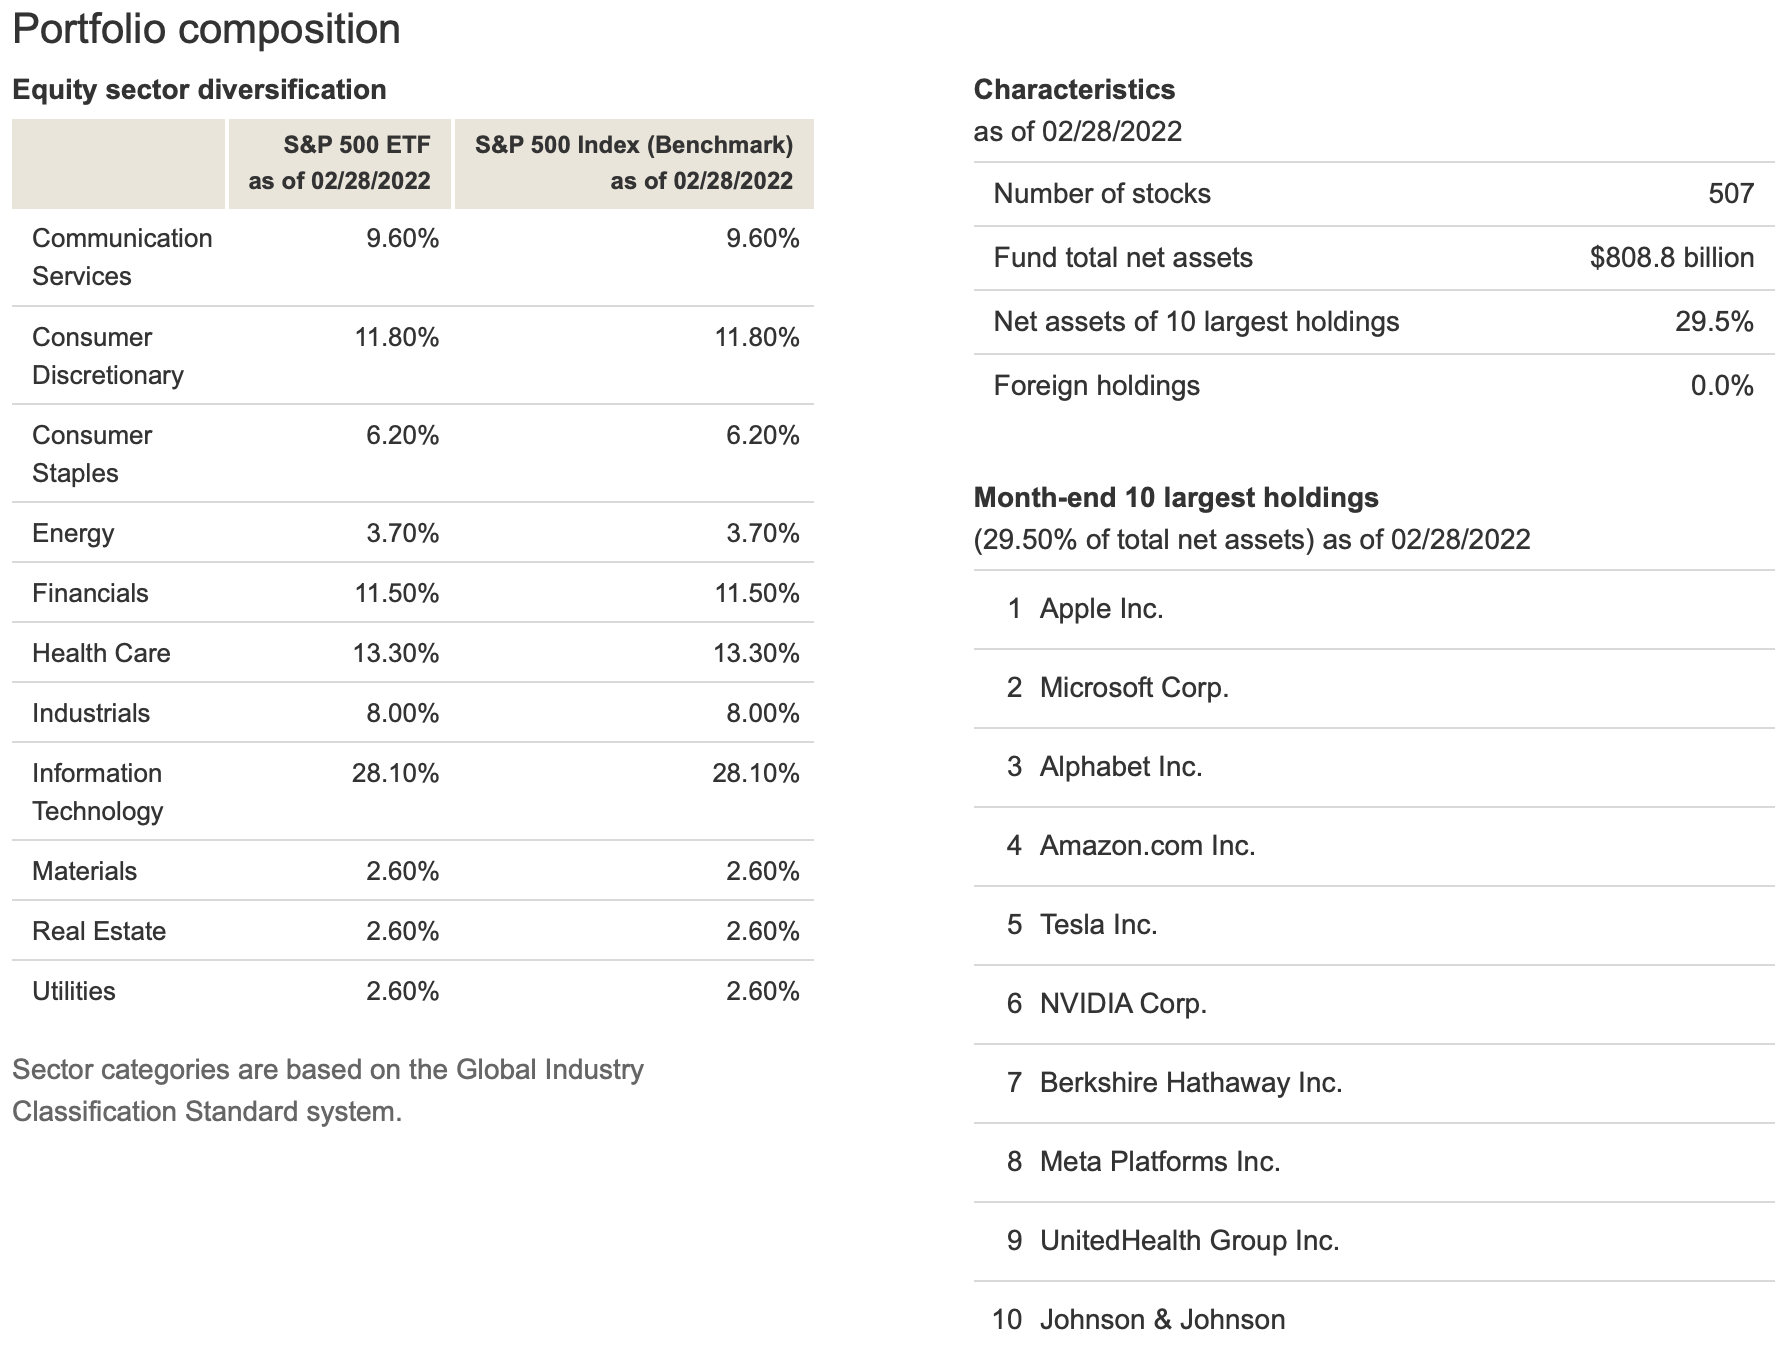
Before we go any further, please take careful note of the sector breakdown, and the Top 10 holdings, in VOO. In terms of sectors, if you were to add the values for Consumer Discretionary, Consumer Staples, Financials, Health Care, and Information Technology, you would find these total to 70.9% of the fund. At 28.1%, the largest single sector is Information Technology.
Next, the same graphic for VTI:
VTI – Sectors & Top 10 Holdings (Vanguard Investors Website – VTI)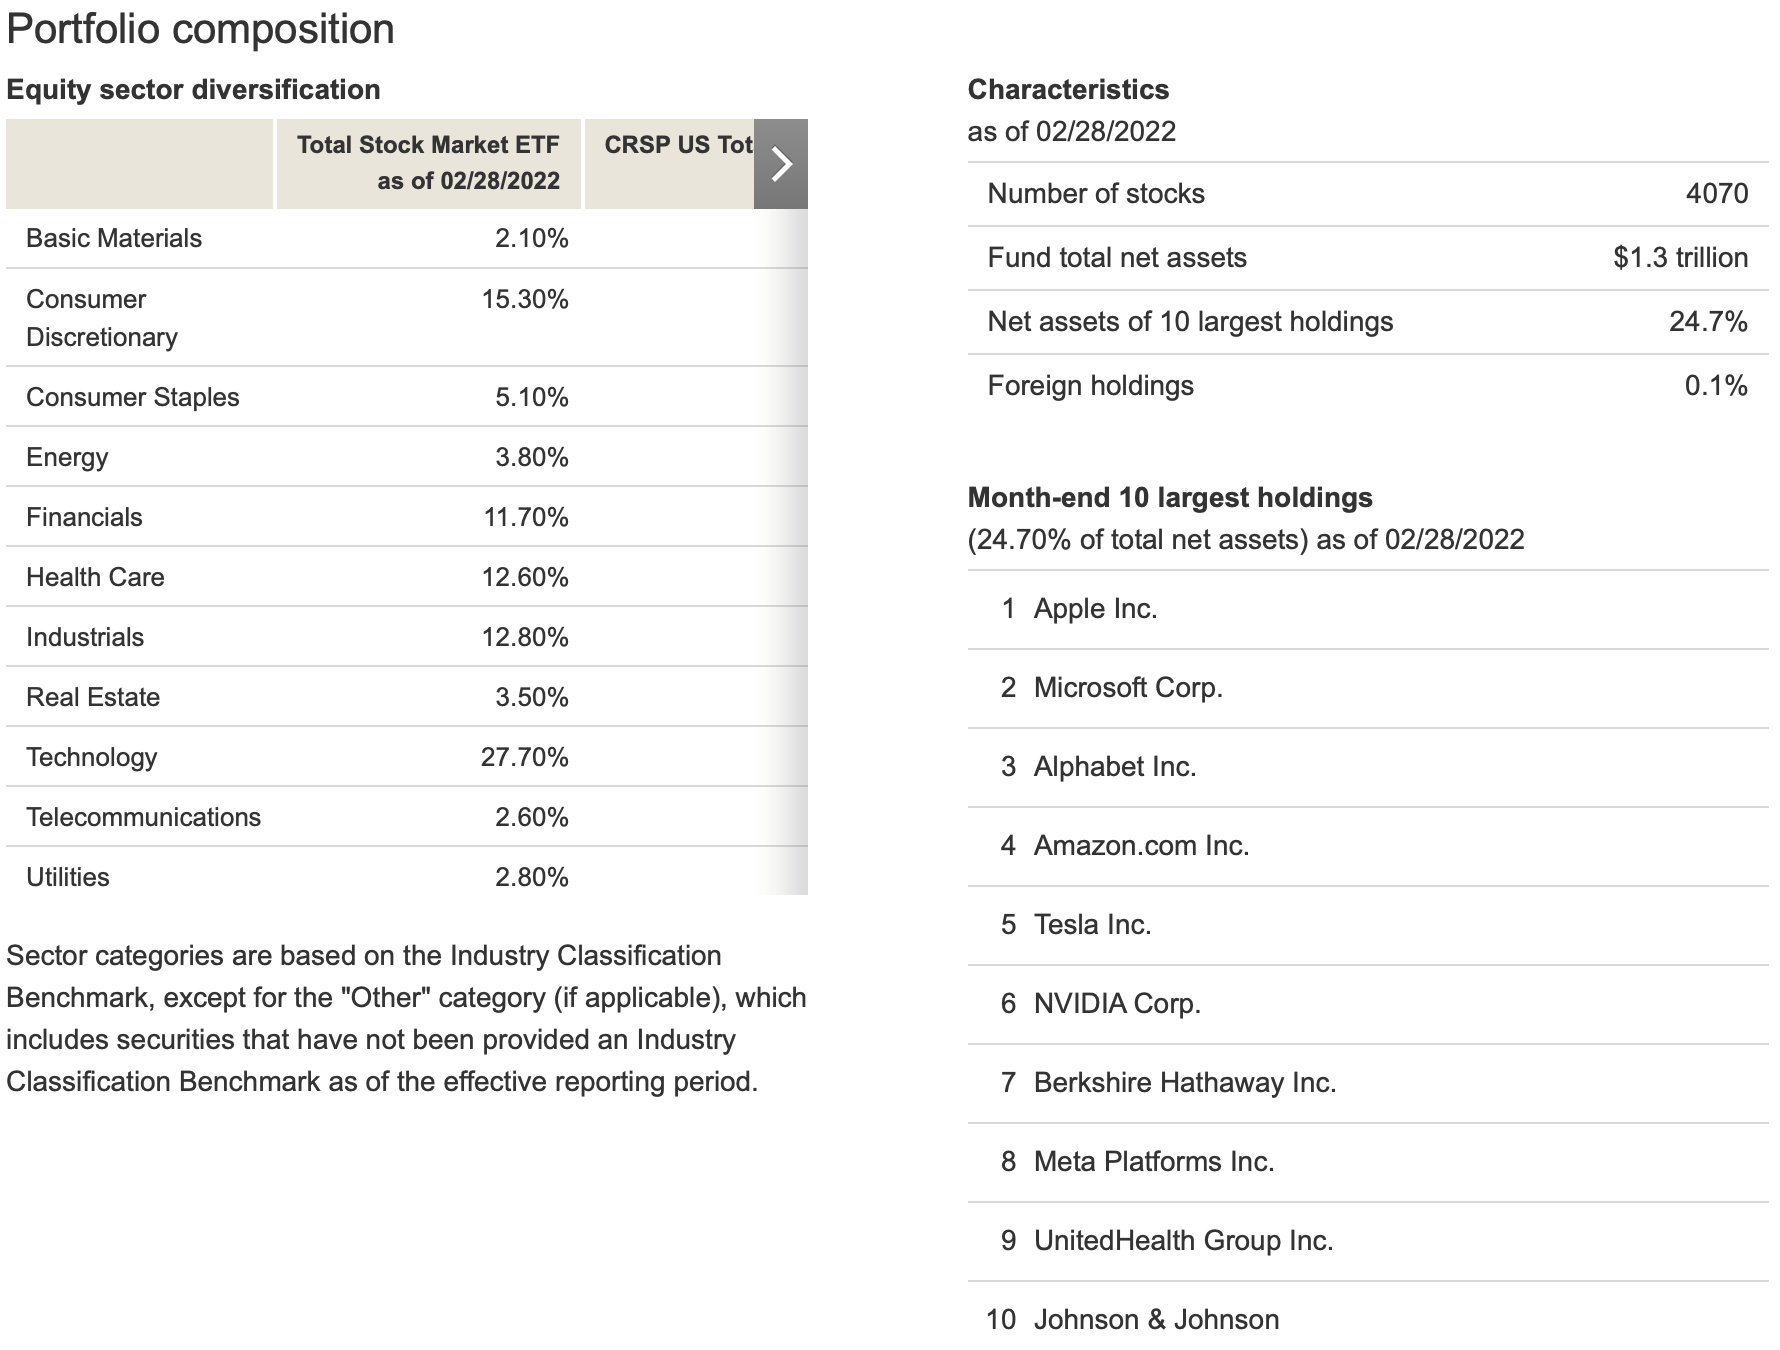
In the case of VTI, the 5 sectors referenced above total to a value of 72.4%, with what is listed as Technology in this graphic once again the largest sector, at 27.7%. In the big picture, quite similar to VOO. Lastly, if you look at the Top 10 holdings for both ETFs, you find that they are exactly the same.
Now, though, focus on the relative weightings of the Top 10 holdings in both funds. In VOO, those Top 10 holdings comprise 29.5% of the fund. In VTI, this drops to 24.7%. Looking back at the number of stocks in both funds, it becomes clear why this is the case. VOO, since it tracks the S&P 500, comprised solely of large-cap stocks, currently contains exactly 507 holdings. In contrast, VTI, since it tracks the entire U.S. market, holds some 4,070 stocks.
Quickly piecing it all together, then, we come to the conclusion that despite the far larger number of stocks in VTI, as a practical matter the two funds are more similar than one might initially think.
I wanted to start with two graphics directly from Vanguard’s own materials, to ensure readers of the accuracy of the presentation. Now that I have done that, however, let’s bring the picture into focus courtesy of an extremely compact yet insightful comparison of VOO vs. VTI, courtesy of etfrc.com.
VOO vs. VTI – Characteristics & Overlap (ETFRC.com)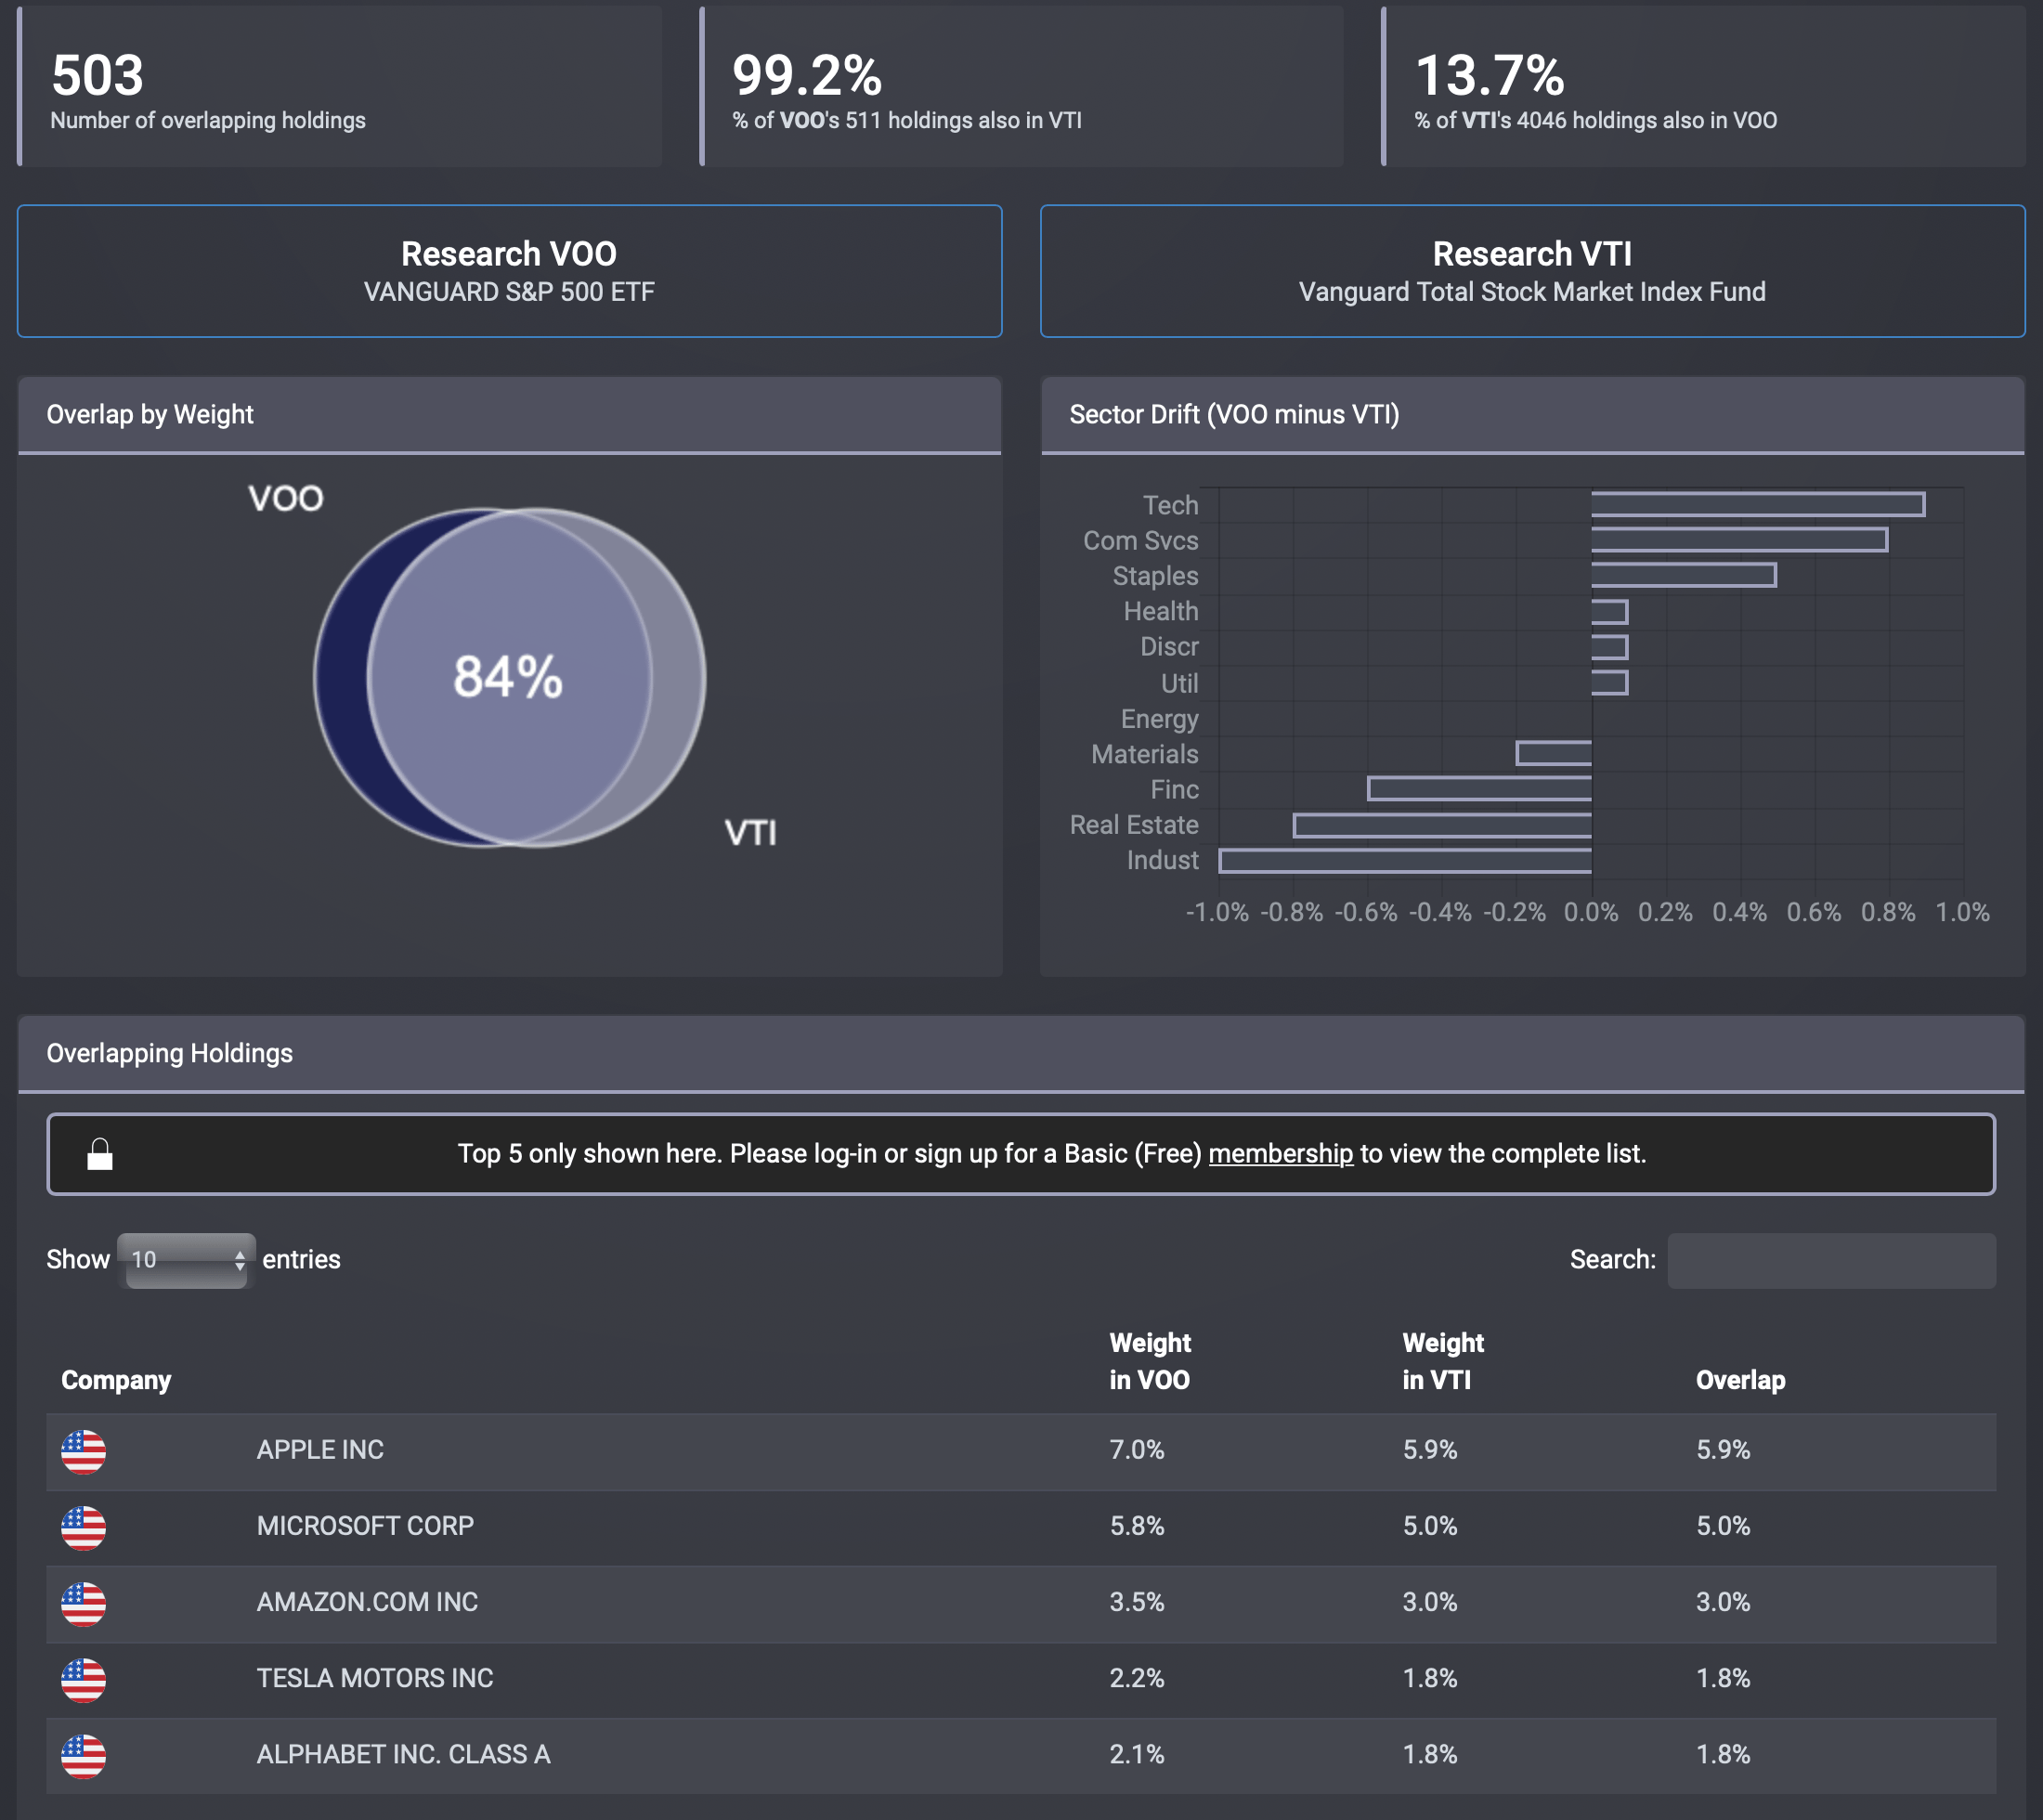
Starting from the top, we first learn that 99.2% of the smaller number of VOO holdings are also in VTI. As a practical matter, everything in VOO is also in VTI.
Since VTI incorporates mid- and even small-cap stocks, along with their large-cap brethren, only 13.7% of VTI’s holdings are also found in VOO.
Turning to the middle section, we see that there is some 84% overlap in terms of weight. Next, a concise look at areas where the weightings in certain specific sectors varies a little bit. As an example, Technology is weighted slightly more heavily in VOO, whereas there is a little more exposure to Industrials in VTI.
The bottom section offers a slightly expanded look into what I featured above, namely that the Top 10 holdings are the same in both funds. It’s just that they are slightly more prominent in VOO than in the more heavily-diluted VTI. Here, we see this itemized for the Top 5 holdings. Taking a second look at it, you can likely also begin to decipher how VOO holds a slightly higher weighting in Technology.
VOO vs. VTI – Performance
I hope you enjoyed that fairly comprehensive dive into the structural similarities, and differences, between VOO and VTI. You may recall, though, that I also teased that I would revisit “certain assumptions I have made in the past, and determine whether they have actually proved correct.”
As it happens, those “certain assumptions” go all the way back to my very first article for Seeking Alpha, linked in the second paragraph of this article. Here is what I wrote at the time.
As opposed to the S&P 500, which is comprised solely of large companies (large-cap), the landscape covered by VTI also encompasses many smaller companies (mid-cap, small-cap, and even micro-cap). Such companies, while offering a higher level of risk than their larger brethren, also offer greater opportunities for growth.
In that article, I included a graphic that appeared to support that statement, showing that the price of VTI outperformed the S&P 500 by roughly 10% over a 10-year period.
In connection with examining matters for this article, however, further review appears to show that the original graphic was flawed, likely taking into account only the price increase in VTI vs. the S&P 500 as opposed to total return, including all dividends.
In connection with this article, using Portfolio Visualizer, I went back and took a second look, by virtue of a direct comparison between VOO and VTI. For any who are interested, here is a link to the backtest.
The backtest covers the period from January, 2011 through March, 2022, constrained by the inception date of VOO. All income was included, and reinvested.
Frankly, the results surprised me. I’ve broken them out into two separate graphics. Here’s the first.
VOO vs. VTI – Growth & Annual Returns (PortfolioVisualizer.com)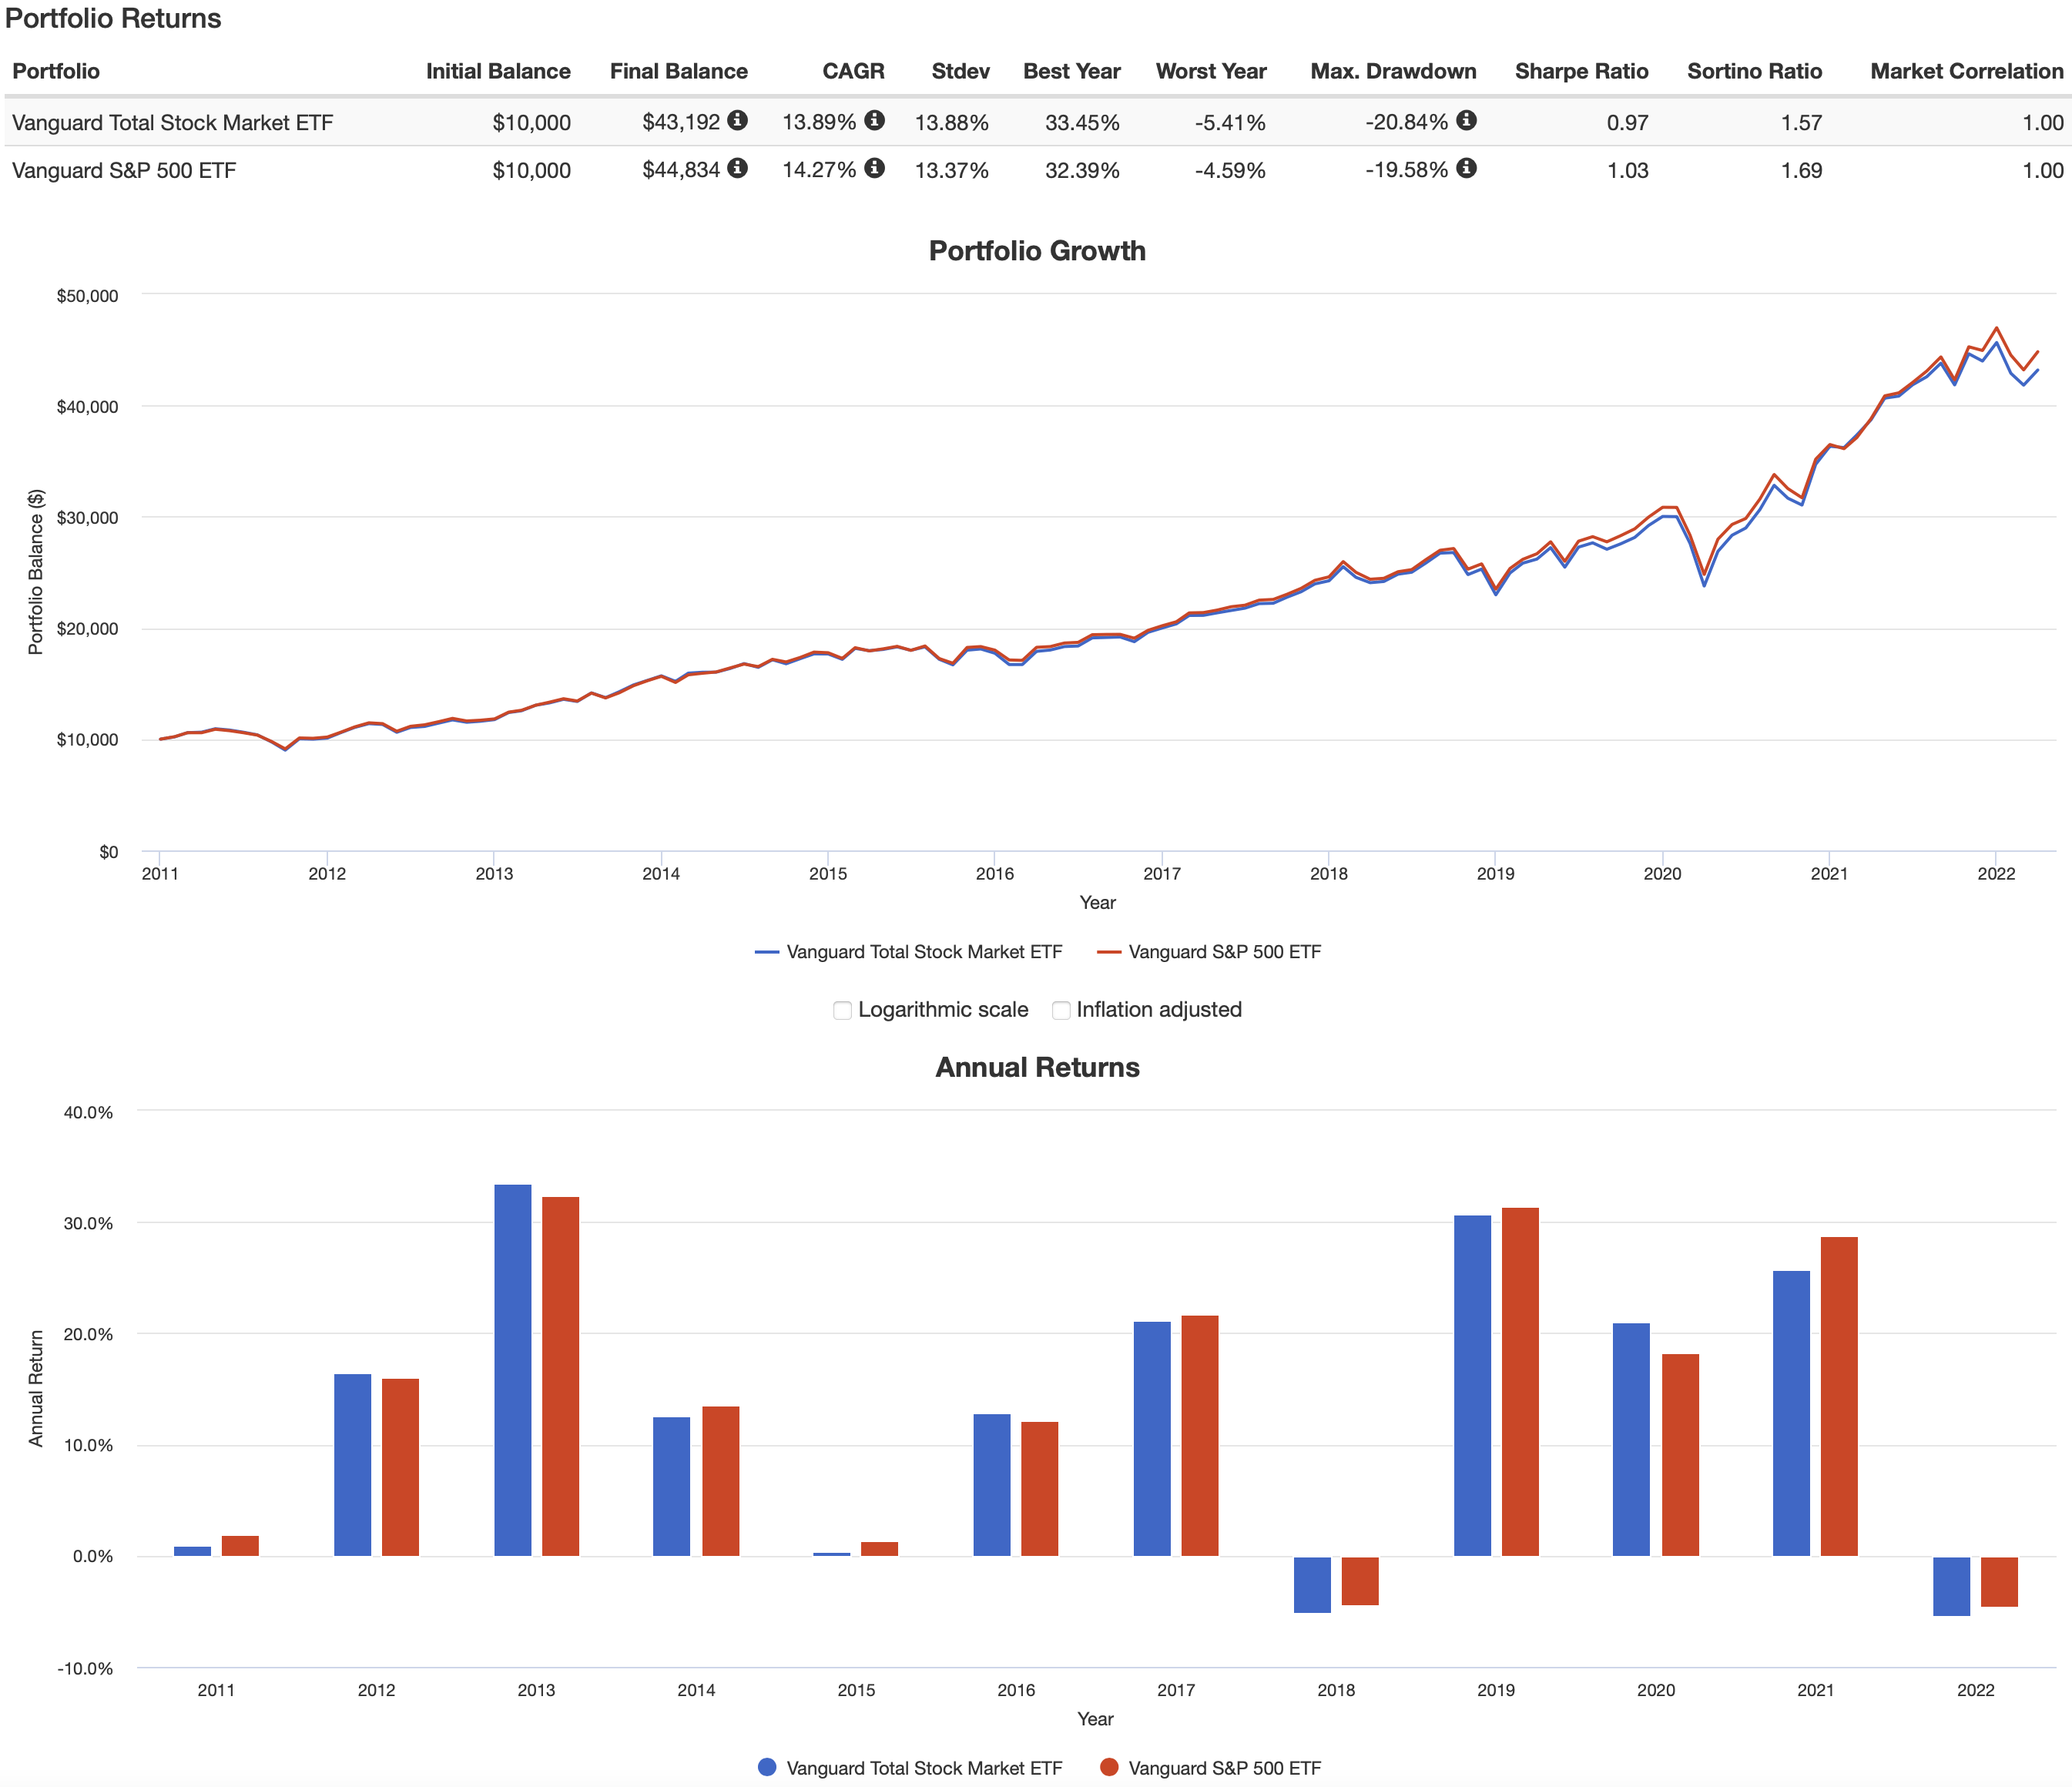
The first thing that surprised me was that VOO generated a superior total return over that time period, generating a CAGR of 14.27% vs. VTI’s 13.89%.
However, it is often the case that greater return comes with greater volatility. But take a look. That is not the case here. The rest of the values along the comparison line all skew in favor of VOO!
Looking at the by-year annual returns, we see this playing out. VTI notches a few wins, in 2012 & 2013, 2016, and 2020. However, in all remaining years, VOO generated either a larger gain, or smaller loss.
Let’s continue on to the second graphic.
VOO vs. VTI – Returns & Annual Income (PortfolioVisualizer.com)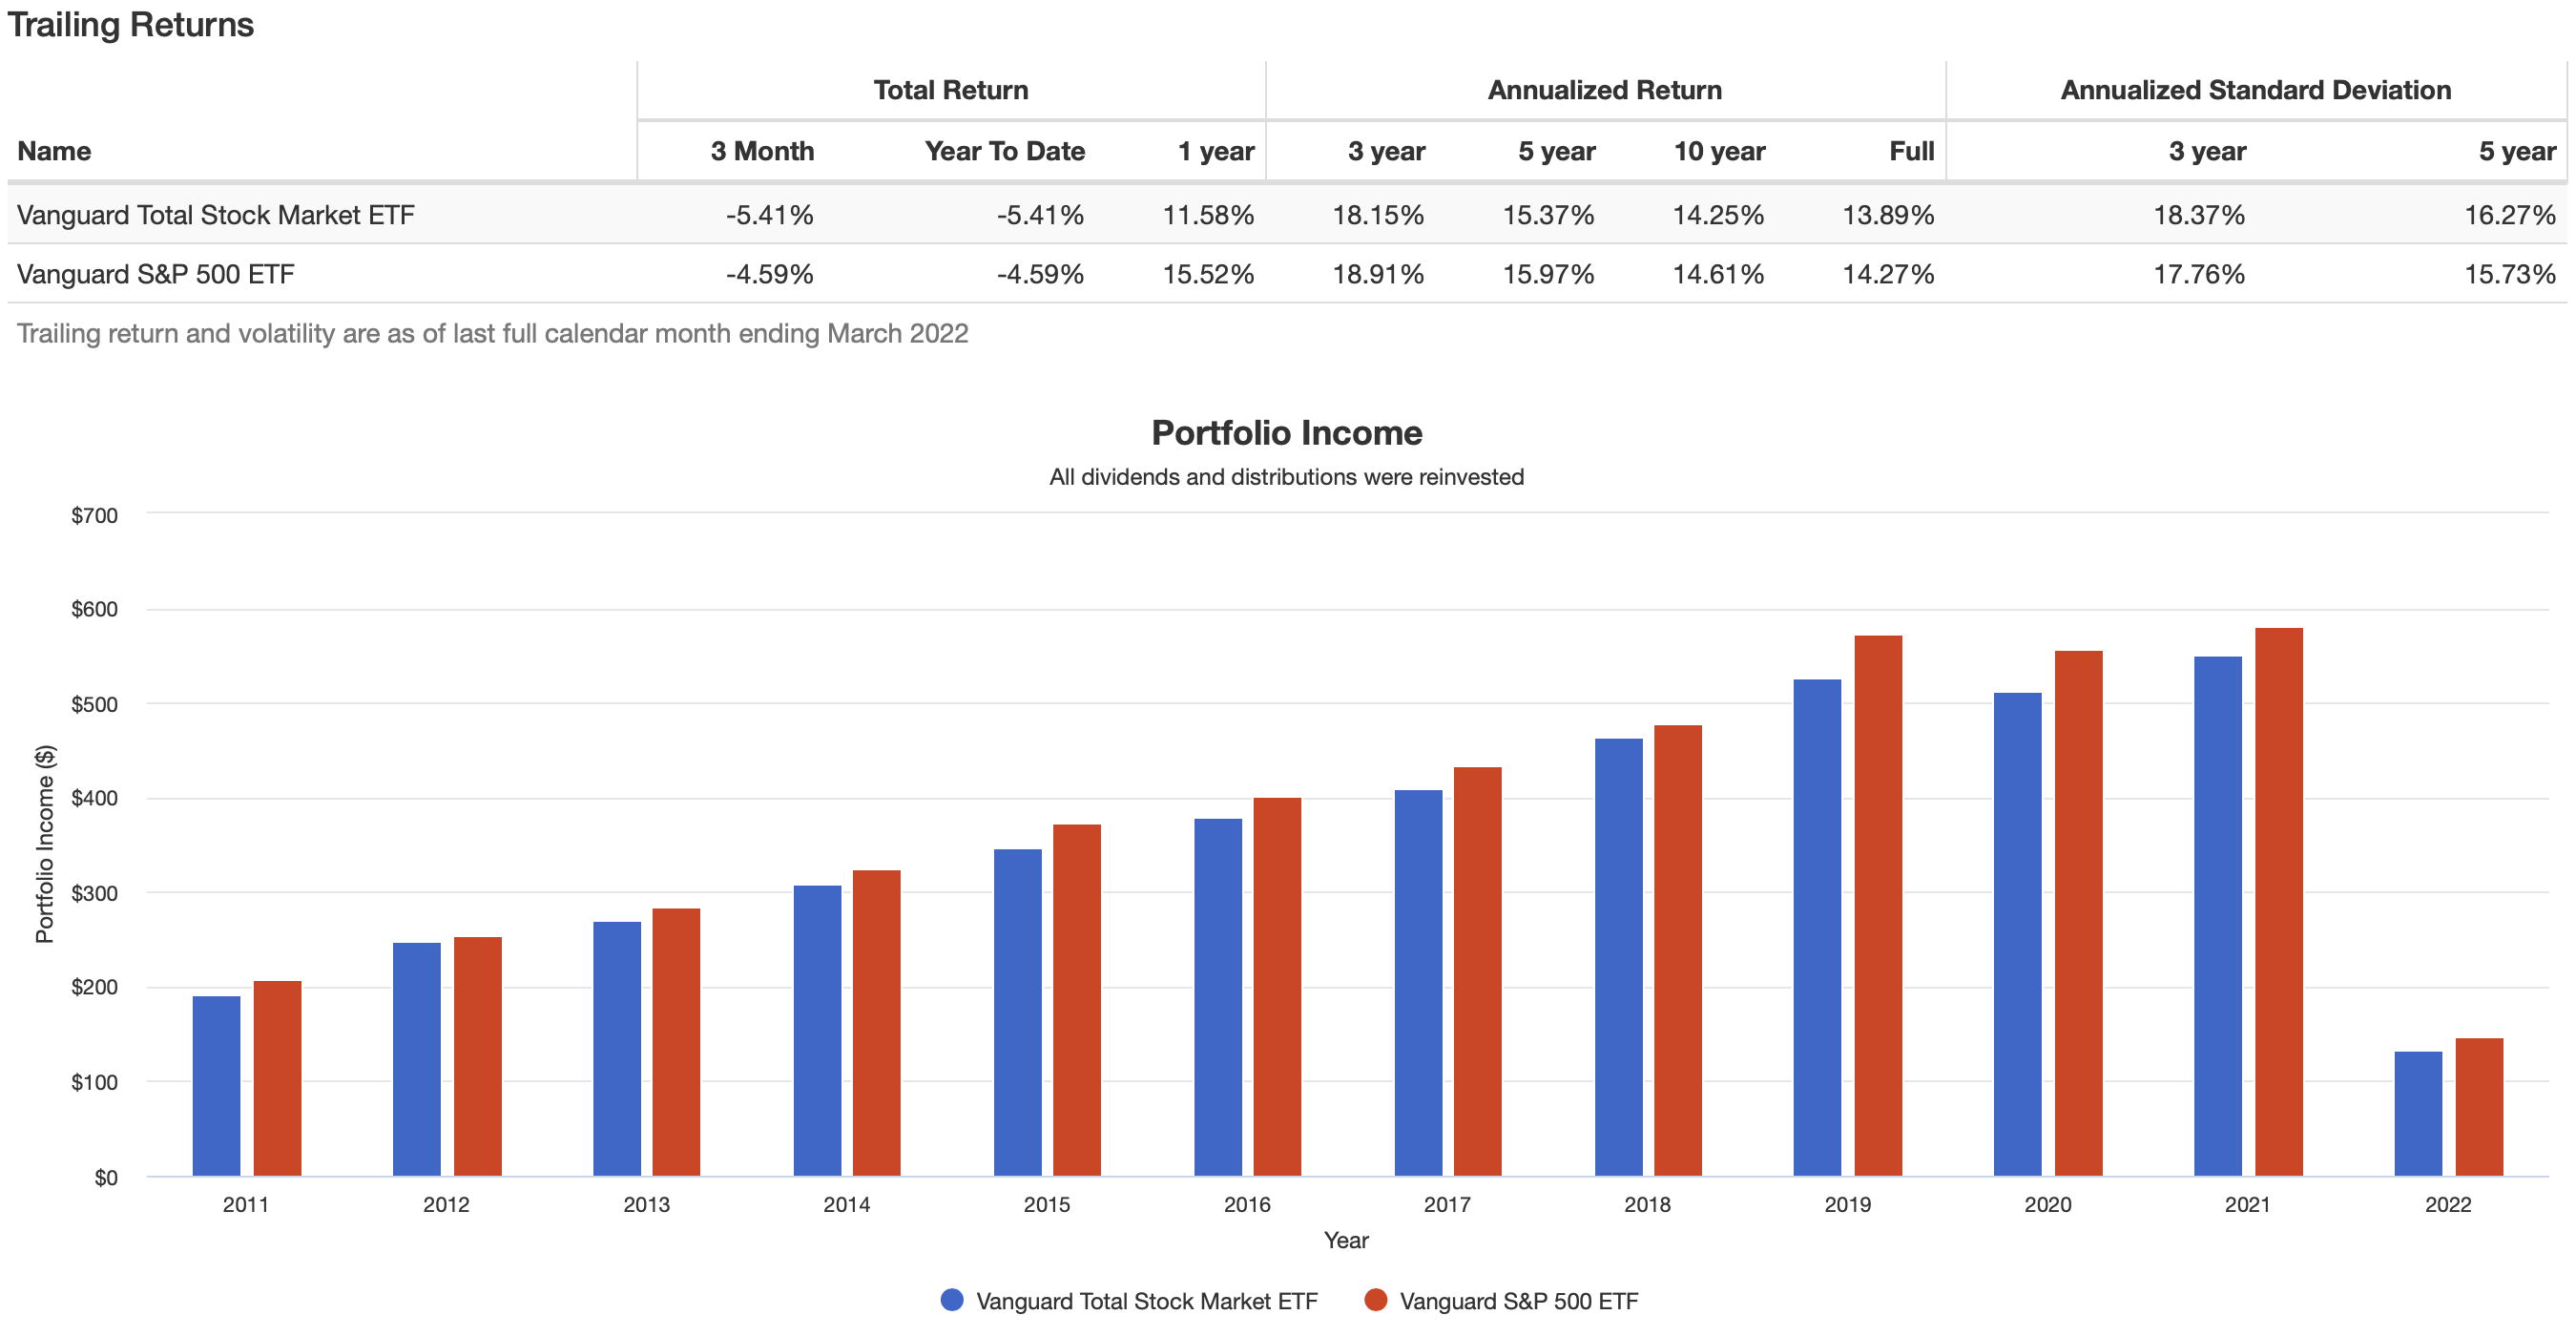
Again, confirmation of what we saw in the first graphic. Superior returns, with lower standard deviation.
Finally, for those interested in income, I included the section of the graphic that demonstrates that, albeit by a modest margin, VOO again comes out the winner.
Summary and Conclusion
I chose VOO as my competitor against VTI specifically because of all the similarities. They are both Vanguard funds. They both have well-established track records. The expense ratios are the same. They are both of massive size, leading to similar trading costs, for those who may desire to trade on a regular basis.
To my surprise, I can’t see any other conclusion to come to other than that VOO is the clear winner in this comparison. It becomes very hard to argue against a combination of better returns with lower volatility, with slightly higher income as the icing on the cake.
Here’s the only question. How will each of them do moving forward?
If you go back to the Portfolio Visualizer graphics and examine them very closely, you will notice that a decent amount of VOO’s outperformance has come in 2021 and 2022. This is not particularly surprising. As laid out in this article, it holds a slightly higher weighting in some of the large-cap technology stocks that have led the market higher of late.
Could this reverse as we move forward, perhaps making VTI a better choice at this time?
It could. I don’t know the future any more than anyone else. However, there is one last question I would like you to ponder. As a total-U.S. market ETF, VTI effectively drags all stocks—good and bad—into the mix. With its focus on S&P 500 stocks, I feel like VOO will have a slight advantage in terms of quality. For example, a higher percentage of companies it holds may preserve some level of pricing power in these inflationary times.
What do you think? Did any of this come as a surprise to you? Do you think I missed something, or have a different viewpoint? Please, take a minute and speak your piece in the comments section below.
In the meantime, as always, I wish you . . .
Happy investing!
Be the first to comment