

Torsten Asmus
“Volume precedes price” is an idea with some statistical backing, widely followed by traders and investors on Wall Street. This continuing article series of my quant-sort findings is focused on companies with short-term rising price trends crossed with higher-than-normal trading volume, especially compared with the last few months of activity. Up to 15 other momentum indicators help to narrow down each list to stocks where the odds of further price gains look probable. To a degree, weekly VBR stories are a type of diary for my research into small and mid-cap selections, with new picks and commentary on past choices. For more information and background on what I am doing, please read my previous posts, starting with the July 9th effort linked here.
Performance from the first 15 picks over the last 4 weeks have not been much to write home about. As a group they have underperformed the minor +2% S&P 500 and +1% Russell 2000 index returns since late June. Outside of -15% losses in Cyanotech (CYAN) and Li Auto (LI), the remaining 13 have gained closer to market returns. But, including the two losers, gains are just above the breakeven line. I personally sold my small CYAN trading position for a slight gain above $3, with plans to repurchase the stake eventually. [I have traded in and out of CYAN 4 or 5 times since my first full-length article in March here on this algae farmer and supplement maker in Hawaii.]
Missed Opportunity
I wouldn’t call any of the picks a mistake at this point, as 10% to 15% price swings are fairly common in the small and microcap areas of Wall Street. However, I would like to discuss one mistake I have made, which revolves around a pick I chose NOT to highlight several weeks ago. For my refined dart throwing system in small caps to work for investors, losses should be kept to a minimum, while big winners are left to run a bit. A critical part of the process for deciding on my VBR picks is I shy away from companies without much underlying fundamental business operating value, or those with less interesting long-term prospects. This means I am only exposing readers to roughly half of my mathematically-derived, technical trading formula results, those with the strongest fundamentals, subjectively in my opinion using 35+ years of trading/investing experience.
One stock I debated about including in the VBR list was Target Hospitality (TH) around $7 per share. This manufacturer and renter of temporary housing mostly for the oil/gas industry, out of the blue announced business sales for 2022 were going to be a good 50% higher than previous guidance, alongside much improved income numbers. After reviewing the balance sheet and past cyclical swings in the business, I figured the stock would rise the next week by another 20% or 30% from the VBR signal, but that would mark a peak for some time. My protective feeling was I didn’t want readers to find the company a week following publication and buy at the exact spike top in price.
Of course, as you can see on the chart, TH has exploded higher in price farther than I anticipated and effectively grown in investor interest for weeks. If I had included this name, a 60% almost instant return over 2 weeks could have been included in my performance calculations. Again, not only did I not let this winner run, but I failed to even put the buy idea into my VBR article on July 9th (using the $7.61 close on Friday, July 8th, the green arrow below). If Target Hospitality would have been included, the group of 16 initial choices would be widely “outperforming” the market averages by +2%. So, in the future I am going to include extra stocks with fundamentals I may not completely understand, and let readers decide for themselves if any/each fits their specific portfolio construction needs.
StockCharts.com – Author Reference Points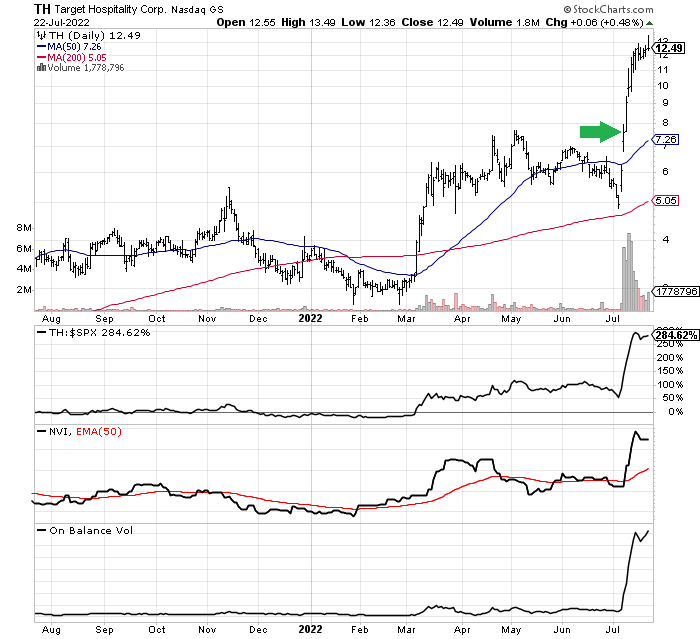
New VBR Buy Signals
JAKKS Pacific
JAKKS Pacific (JAKK) is a small toy maker/seller, with $658 million in trailing sales and a current $160 million equity market cap. Action figures, costumes, dolls, and games usually related to the launch of blockbuster movies, many from Walt Disney (DIS), are the main focus of the company.
Company Website
A strong U.S. dollar in foreign currency exchange makes imported toys cheaper for U.S. consumers (China and Hong Kong manufacturing for JAKKS). The vast majority of company income is generated around the Christmas sales season, but the last two quarters have soundly beat analyst expectations with flat earnings results vs. expected losses. The company is in the best financial shape in terms of balance sheet health since 2016, and trades at a low 6x projected 2022 earnings. The stock quote is breaking out to its highest level since 2018.
StockCharts.com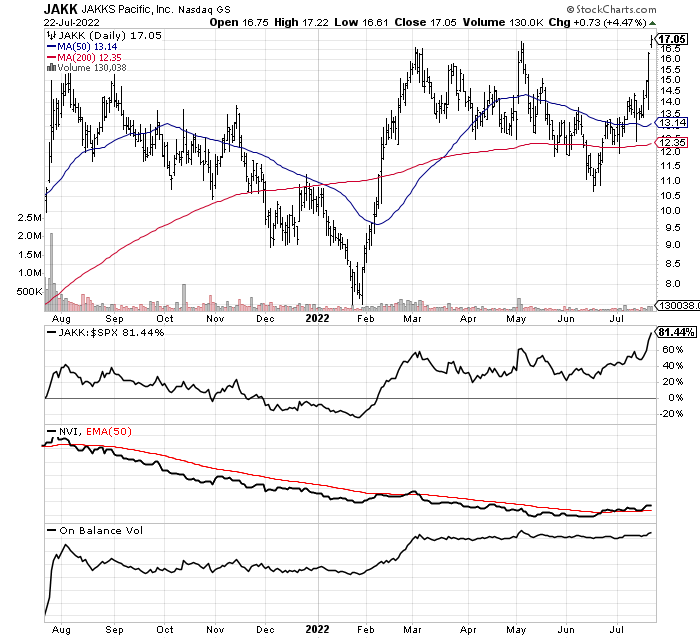
CECO Environmental
An ESG pick that markets water and air cleaning products, CECO Environmental (CECE) announced in early May a major share buyback program for roughly 10% of outstanding float. Since that point On Balance Volume stats have been through the roof. The stock quote has raced from the mid-$5 range to above $7, despite a huge pullback in the U.S. equity market overall. Steady EPS growth is projected through 2024 by Wall Street analysts.
Seeking Alpha, Analyst Estimates, CECE – July 22nd, 2022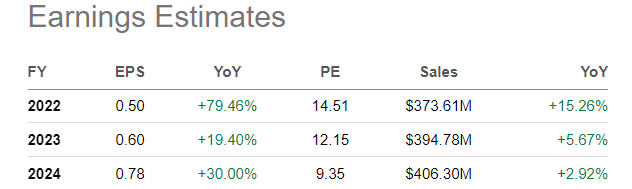
I would call the balance sheet respectable with current assets like cash, inventory and receivables nearly covering total liabilities. I am assuming future share price changes will track the growth or lack thereof in operating income during the rest of 2022. I don’t have any special insight into how sales trends are playing out for CECO in June-July. If the share buyback has something to do with management expecting a big jump in operating profits next year, the stock price should continue to outperform.
StockCharts.com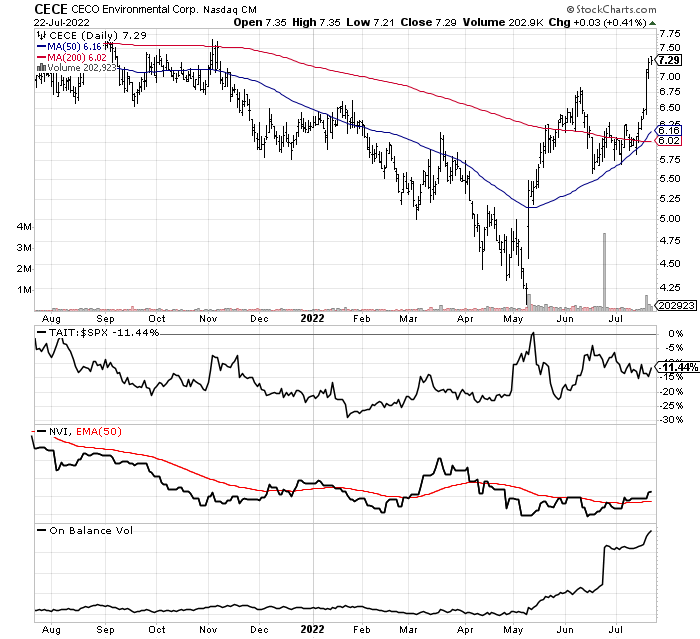
Taitron Components
A small electronics and semiconductor component distributor witnessing consistent share buying interest since late April is Taitron Components (TAIT). The balance sheet is top notch, with $6 million in cash and $13 million in net working capital vs. a market cap of only $20 million. A 5% dividend yield annually is available to new buyers. The company has reached a new era of profitability during the global chip supply shortages of 2020-22. The TAIT share price has tripled since 2018, but still trades at 6x trailing EPS on an accounting change. Forward P/Es are likely in the 10x to 15x range.
StockCharts.com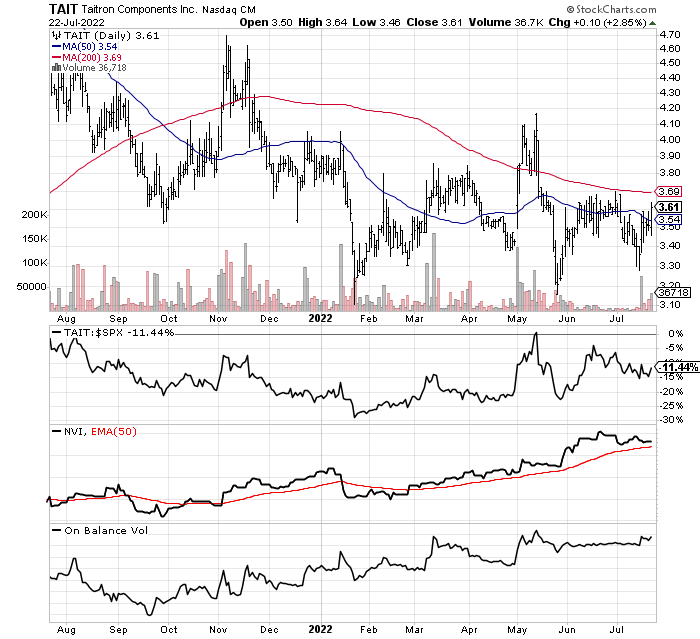
Immatics N.V.
If you are looking for exposure to a small biotech with lots of upside potential in groundbreaking cancer treatments, German-based Immatics N.V. (IMTX) is worth a look. On Tuesday, 4x normal volume appeared without any real news I could find, as price jumped 17% intraday.
In June the company announced a new partnership with Bristol-Myers Squibb (BMY) for some of its products under development. IMTX will receive $60 million upfront with the potential to earn many hundreds of millions over time. The company also signed a licensing agreement with Editas Medicine (EDIT) in June. The deal combines Editas gene-editing technology with Immatics ACTallo allogeneic, off-the-shelf cell therapy platform.
At the end of March, Immatics held US$279 million in cash vs. $184 million in total liabilities. The total equity market value is around $650 million for shareholders. Note: Research & Development companies in the biotech space are very volatile, and may not be appropriate for all investors.
StockCharts.com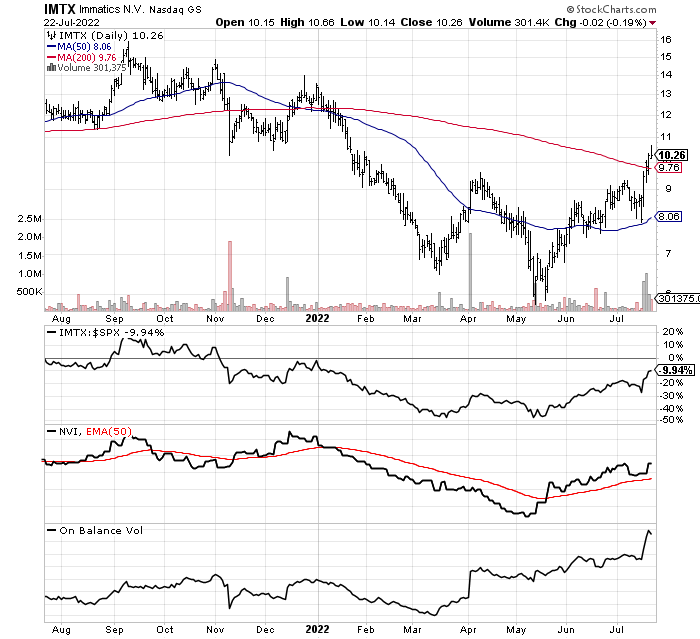
Final Thoughts
I remain skittish and cautious about the overall market’s direction in the weeks ahead. Combined material weakness in the shares of banks/brokerages and gold/silver mining stocks is rare, and usually takes place during liquidity crunches in the American financial system. Assuming the Federal Reserve raises bank interest rates by 0.75% this week, liquidity will be even tighter in coming weeks. I believe another 10% to 20% of downside could hit soon for the major U.S. equity averages, although I would prefer to be wrong on this forecast.
I remain confident the VBR list is a great tool to search for future small capitalization outperformers in the months ahead. When the market turns from bear to bull, we should see the utility and advantage of owning small cap winners during more normal trading circumstances. Patience will be key, as will tempered (realistic) expectations that future stock gains are destined to be far lower than the outlier 2020-21 bull span.
I suggest readers take the time to do further research into any of the Volume Breakout Report selections that appeal to you, a function of your risk appetite or sector exposure needs in portfolio construction. Please understand small-cap picks should be a limited portion of portfolio design. Holding a diversified number of stocks (at least 20-30) is the prudent risk-adjusted way to play them. Volatile price swings are part of the investing process for smaller companies on Wall Street. Please consider using preplaced stop-loss sell orders to reduce downside potential in individual names. Depending on your risk tolerance, 10% to 30% stop levels are recommended.
Thanks for reading. Please consider this article a first step in your due diligence process. Consulting with a registered and experienced investment advisor is recommended before making any trade.
Be the first to comment