

bjdlzx
Global energy stocks have had quite a year so far. The iShares Global Energy ETF (IXC) is up a solid 34% in 2022, but that has not come without volatility. The fund was up 55% at its peak but then sunk amid a bear market in June and July to be higher by just 17% for the year. In the last month, though, global energy names are back on the mend. IXC has beaten the iShares All-Country World Ex-U.S. ETF (ACWX) since mid-July.
Global Energy Shares Rebound From A Steep June-July Drop
StockCharts.com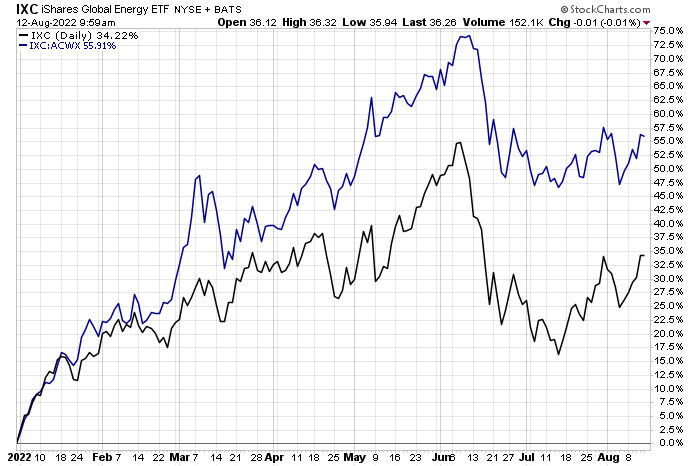
One Mexico-based energy stock is up huge over the last few weeks thanks to an impressive EPS beat and annual profit climb.
According to Seeking Alpha, Vista Energy, S.A.B. de C.V. (NYSE:VIST) through its subsidiaries, engages in the exploration and production of oil and gas in Latin America. The company’s principal assets are located in Vaca Muerta with approximately 183,100 acres. It also owns producing assets in Argentina and Mexico. As of December 31, 2021, it had proven reserves of 181.6 MMBOE. The company was formerly known as Vista Oil & Gas, S.A.B. de C.V., and changed its name to Vista Energy, S.A.B. de C.V. in April 2022. Vista Energy, S.A.B. de C.V. was incorporated in 2017 and is based in Mexico City, Mexico.
The $748 million market cap Energy sector stock in the Oil, Gas & Consumable Fuels industry does not pay a dividend and trades at a very cheap 5.45 trailing 12-month P/E ratio, according to The Wall Street Journal. The industry average P/E is higher at 8.8. VIST reported Q2 2022 earnings on July 26. The Mexican firm crushed EPS expectations with an impressive $0.93 of adjusted per-share profits. The consensus forecast was just $0.43, per I/B/E/S data. EPS in the same quarter a year ago was just $0.20. Free cash flow was an impressive $62.6 million in Q2, according to the company’s 10-Q report.
Vista Energy Quarterly Report: Profit Summary
Vista Energy SEC Filing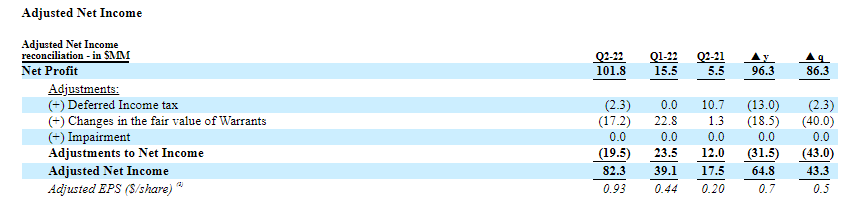
The company trades at just 0.7 times next year’s sales, historically low for the stock, too.
VIST: Historical Price to Sales Ratio
Koyfin Charts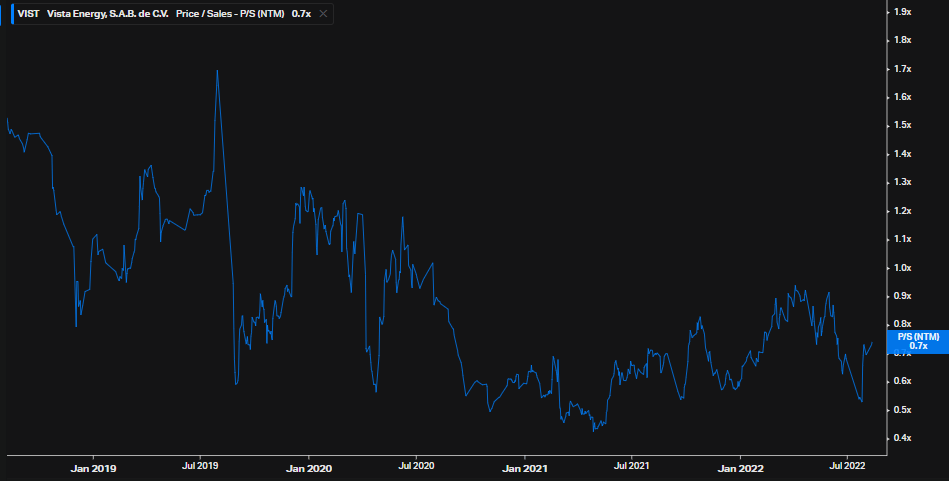
Vista’s corporate event calendar is light until its Q3 2022 earnings date unconfirmed for Tuesday, October 25 after the closing bell, according to data provider Wall Street Horizon.
Vista Corporate Event Calendar
Wall Street Horizon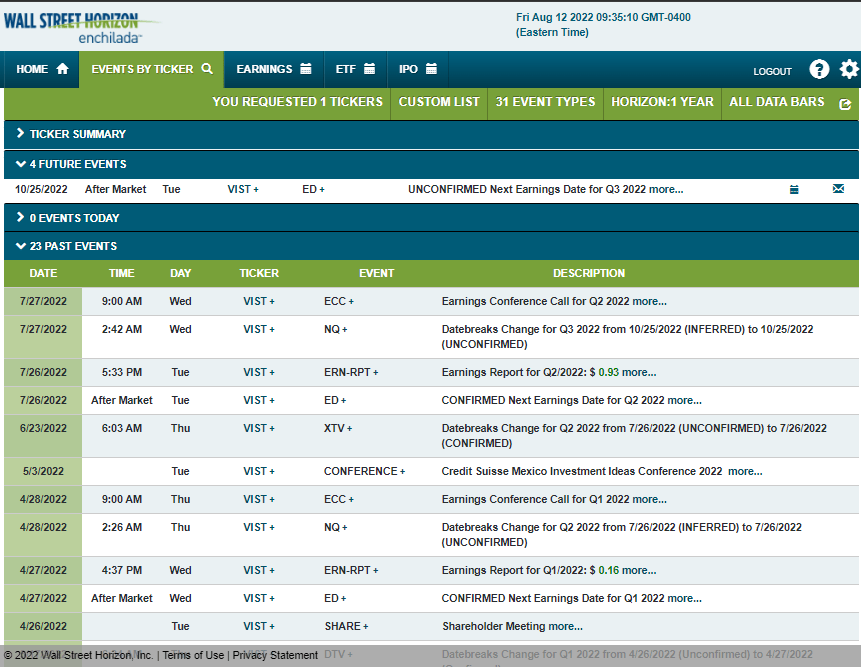
The Technical Take
VIST shares found resistance near the $10 market a few times earlier this year during the big resource-sector bull market. When money fled the Energy and Materials areas in June, VIST sunk. The stock dropped about 40% to a July nadir just below $6. Around its July 26 second-quarter earnings report, shares soared. The stock rose from under $6 to near $7 in advance of the small-cap’s profit report. Once positive earnings news hit the tape, buyers aggressively scooped up shares. VIST settled above $8 on July 27, above critical resistance from its June rebound high. Shares then held that level on a retest earlier this month.
With the stock now hovering around $9, I see continued support in the $8 to $8.20 area, with resistance at the all-time high near $10. Being long here with a stop under $8 makes sense.
VIST: $8 Support, $10 Resistance. Big July-August Recovery and Retest
StockCharts.com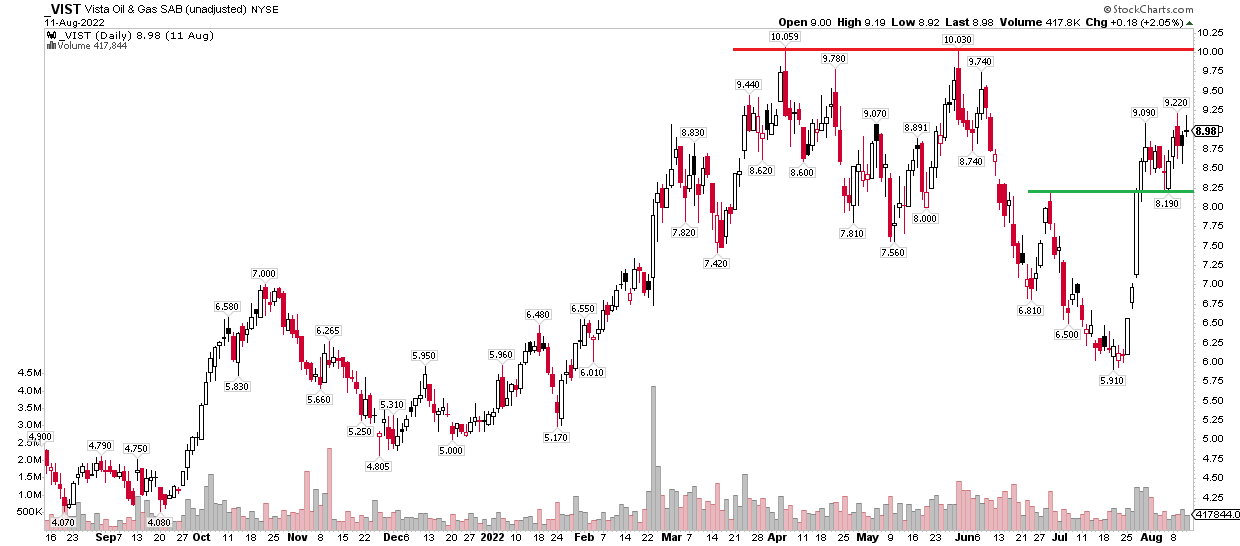
The Bottom Line
Vista Energy’s absolute and relative valuations look good while its technical chart has recovered most of the June losses after the company beat Q2 earnings estimates. I think shares will at least rival the all-time high around the $10 mark. With a defined technical support point and earnings momentum, I think it’s a buy here with a stop under $8.
Be the first to comment