

hatchapong
Introduction
We review our investment case on Visa Inc. (NYSE:V) after shares have stagnated in the month since the company released strong Q3 FY22 results (on July 26), which we believe represent an exceptional bargain for investors.
We initiated our Buy rating on Visa (and on Mastercard (MA)) in June 2019. The total gain on Visa stock (including dividends) since our initiation stands at 29% after just over 3 years, but the stock price is down 9% from a year ago:
|
Librarian Capital’s Visa Rating History vs. Share Price (Last 1 Year) 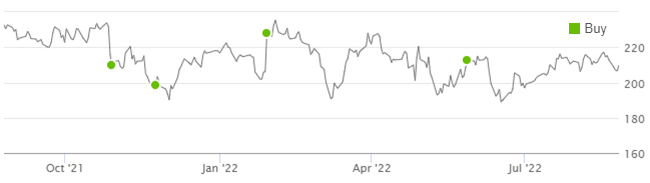 Source: Seeking Alpha (25-Aug-22). |
Visa is at present one of the most attractive stocks within our coverage. Earnings growth has resumed its long-term double-digit trajectory, with FY22 growth to be even higher thanks to a post-COVID rebound. Shares are currently trading at just 32.6x CY21 EPS, when we believe they should re-rate back to 40x. Our forecasts show investors can more than double their money in 3 years (by September 2025). Buy.
Visa Stock Forecasts
With shares at $209.82, based on our forecasts, we expect an exit price of $440 and a total return of 113% (27.9% annualized) by September 2025, in just over 3 years:
|
Illustrative Visa Return Forecasts 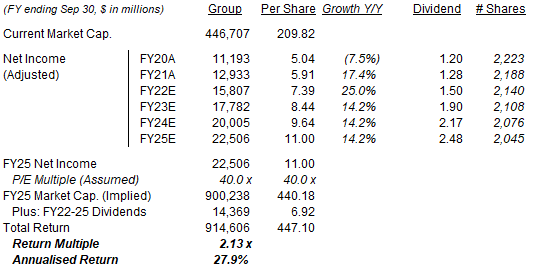 Source: Librarian Capital estimates. |
We have updated our forecasts slightly since our last article in May, based on Q3 FY22 results. We now assume:
- FY22 Net Income of $15.8bn (was $14.7bn)
- FY22 share count of 2,140m (was 2,155m)
- From FY23, Net Income to grow at 12.5% each year (unchanged)
- From FY23, share count to fall by 1.5% each year due to buybacks (unchanged)
- From FY23, dividends to be on a 22.5% Payout Ratio (unchanged)
- P/E of 40x at FY25 year-end (unchanged)
Our new FY25 EPS forecast is 8% higher than before ($10.18).
Around 86 ppt of our forecasted total return is driven by earnings growth, specifically an EPS CAGR of 16.8% in FY21-25. Another 24 ppt of forecasted total return is from an upward valuation re-rating, with Visa shares expected to trade at 40.0x FY25 EPS at exit compared to 35.5x FY21 EPS currently. The final 3 ppt is from dividends:
|
Illustrative Visa Investor Returns by Component 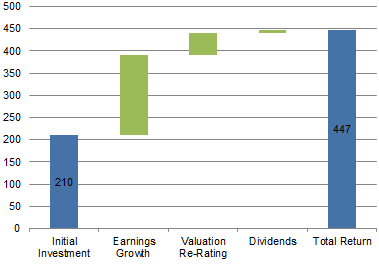 Source: Librarian Capital estimates. |
Our expectation of long-term double-digit EPS growth is supported by both Visa’s track record and recent results.
Visa’s Long-Term Track Record
Visa has a track record of growing EPS at double-digits. After the acquisition of Visa Europe in FY16, Adjusted Net Income grew at a CAGR of 21.8% in FY17-19 (and EPS CAGR was even higher, at 25.1%, thanks to buybacks), before it was interrupted by COVID-19. Adjusted Net Income fell modestly in FY20 and only partially rebounded in FY21, giving a CAGR of just 2.3% in FY19-21 (EPS CAGR was 4.2%).
|
Visa Net Income, Dividends & Buybacks (FY13-21) 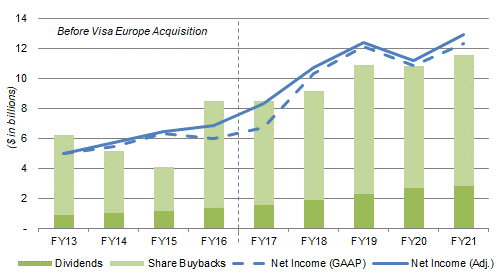 Source: Visa company filings. NB. Visa Europe acquisition was completed in FY16Q4. |
The difference between Adjusted and GAAP Net Income has always been small, and management has returned most of Visa’s earnings to shareholders in dividends and buybacks, with the latter adding to EPS growth.
Overall, Visa’s Adjusted Net Income had a CAGR of 11.6% in FY17-21, even with the pandemic and other one-off headwinds such as the Russia/Ukraine conflict. Growth is also set to be much higher in FY22.
Visa’s Strong Recovery in FY22
For the 3 quarters that have already been reported, Visa’s year-to-date (“YTD”) Adjusted EPS was 29.8% higher year-on-year and 41.2% higher than in 2019:
|
Visa P&L (Non-GAAP) (Q3 YTD FY22 vs. Prior Periods) 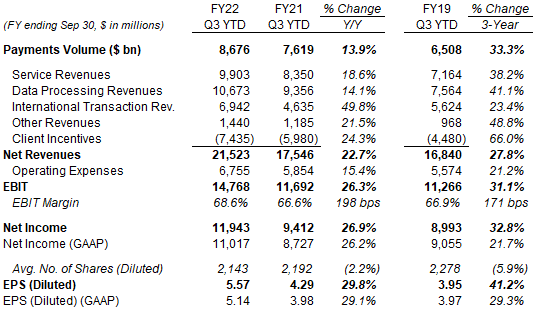 Source: Visa results releases. NB. Each quarter’s Service revenues are based on volumes in the preceding quarter. |
While the implied 3-year EPS CAGR is “only” 12.2%, FY22 YTD represents a still-incomplete recovery in global air travel, the exit from Russia was modestly negative, and the U.S. dollar’s record high this year is a headwind. (Russia and Ukraine together were 5% of group revenues in FY21, and we believe their margins are higher than the group average, just as they are at Mastercard.)
Visa’s recovery accelerated in the first three quarters of FY22, so growth rates for Q3 alone are stronger than those for YTD, with Adjusted EPS up 32.5% year-on-year and 44.3% higher than in FY19 (in USD):
|
Visa P&L (Non-GAAP) (Q3FY22 vs. Prior Periods) 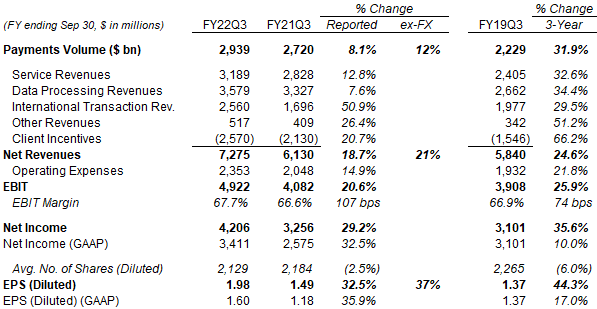 Source: Visa results releases. NB. Each quarter’s Service revenues are based on volumes in the preceding quarter. |
Visa’s Q3 FY22 financials show how all of the company’s growth engines are functioning:
Service Revenues grew 12.8% year-on-year in Q3 FY22. Service Revenues are driven by Payments Volume in the preceding quarter, and Payments Volume grew 14% year-on-year in Q2. The difference between the two growth rates is Russia, which is included in the volume figure but not the revenues figure.
Data Processing Revenues grew 7.6%, below the growth in process transactions (16%), due to a 4 ppt impact from exiting Russia and a 2 ppt impact from currency movements.
International Transaction Revenues grew 50.9% year-on-year, thanks to the continuing rebound in global travel. Visa’s Cross-Border Volume ex. Intra-Europe rose 38% year-on-year in Q3, and International Transaction Revenues grew faster than this, “helped by high currency volatility and select pricing actions”.
Other Revenues grew 26.4% year-on-year, “led by consulting services and travel benefits”. Management stated that value-added services had revenue growth of “almost 20%” in the quarter.
Total Net Revenue growth of 18.7% was helped by about 0.5 ppt with the Currencycloud and Tink acquisitions but reduced by 3 ppt due to currency movements, and by 5 ppt due to the suspension of operations in Russia.
Adjusted EBIT grew 20.6%, and Adjusted EBIT Margin expanded more than 100 bps year-on-year, thanks to Operating Expenses growing just 14.9%, less than revenue growth (19.7%). The effects of the acquisitions (Currencycloud and Tink) and exiting Russia largely cancelled out each other (at 3 ppt each), while currency was a 2 ppt benefit. Excluding all these, expenses still grew less than revenues, showing Visa’s natural operational leverage.
Management also provided Q4 FY22 guidance that implies a strong finish to the fiscal year.
Visa Q4 FY22 Guidance
Visa is assuming its recovery will continue, having seen no signs of any slowdown. As CFO Vasant Prabhu explained on the call:
We are seeing no evidence of a pullback in consumer spending… we are assuming that the trends we have seen in payments volume and processed transactions will continue through the fourth quarter… Through July, the cross-border recovery has progressed faster and further than we had expected last October.
For the fourth quarter, we’re assuming stable growth versus 2019 in cross-border e-commerce and some improvement from travel in and out of Europe and into the US, especially from Asia. The next and perhaps the last leg of the cross-border travel recovery will have to await a full reopening in China, which we do not expect in the near future
Management provided the following guidance for Q4 FY22:
- Net Revenues to grow at “high teens to 20%” in constant currency
- Currency to reduce Net Revenue growth by 4-5 ppts
- Client Incentives to be 26-27% of Gross Revenues
- Non-GAAP Operating Expenses to grow “at the low end of high teens” in constant currency
- Currency to reduce Operating Expenses growth by 2 ppts
- Tax Rate to be in the 19-19.5% range
We believe these comments imply a Q4 FY22 Net Income growth of just under 10%:
|
Visa Non-GAAP P&L Outlook (Q4 FY22) (Our Estimates) 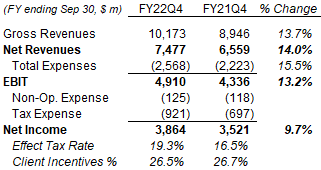 Source: Librarian Capital estimates. |
Adding these Q4 estimates to actual Q1-Q3 figures implies a full-year FY22 Net Income growth of approximately 22%:
|
Visa Non-GAAP P&L Outlook (Full-Year FY22) (Our Estimates) 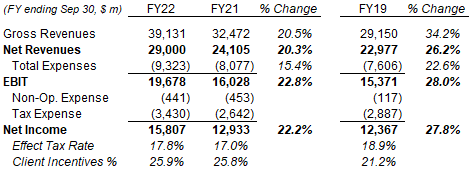 Source: Librarian Capital estimates. |
The 22% year-on-year Net Income growth in FY22 is higher than the low-teens long-term growth we have assumed, reflecting benefits from the ongoing recovery from COVID. The implied FY22 Net Income is “only” 27.8% higher than in FY19 despite, as described above, the result of the incomplete recovery in FY22, currency and the exit from Russia.
Valuation – Is Visa Overvalued?
At $209.82, relative to CY21 financials, Visa shares are trading at a 32.6x P/E and a 3.3% FCF Yield:
|
Visa Net Income, Cash Flows & Valuation (FY19-21) 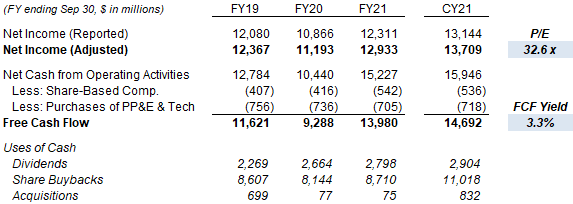 Source: Visa company filings. |
Relative to our FY22 Net Income forecast, Visa’s P/E is just 28.3x.
Visa pays a dividend of $0.375 per quarter ($1.50 annualized), having raised it by 17% year-on-year in October. This implies a Dividend Yield of 0.7%.
Visa repurchased another $2.5bn of shares in Q3 FY22, at an average price of $202.16. (Another $0.6bn was added to the MDL litigation escrow account, generating the same effect as a stock buyback at $200.25) The $12.0bn buyback program announced in December 2021 has $7.3bn remaining, equivalent to 1.6% of the current market capitalization.
We have been assuming a 40x exit P/E for Visa stock (42x P/E for Mastercard), which we believe is fair given the quality of the earnings (in terms of both resilience and growth). A 40x P/E also translates to a 2.5% “yield,” about 75 bps lower than the current 30-year U.S. Treasury yield of around 3.25%.
We believe Visa stock is undervalued.
Is Visa Stock A Buy? Conclusion
We reiterate our Buy rating on Visa.
Be the first to comment