

bizoo_n/iStock via Getty Images
European Gas Shortage
While many people in the US have undoubtedly noticed higher utility bills due to higher natural gas prices, our situation is a walk in the park compared to Europe’s. Natural gas prices in Europe began rising last year and have spiked violently since the Russia-Ukraine conflict. Russia is historically Europe’s biggest supplier of natural gas and flows from Russia to Europe have not been maxed out since December and have become increasingly unreliable since the conflict. While current prices are below the peak seen right after the invasion, prices have averaged higher levels over the past month than any other period over the past 12 months.
Dutch 1 Month Natural Gas Forwards in USD/mmbtu (Bloomberg)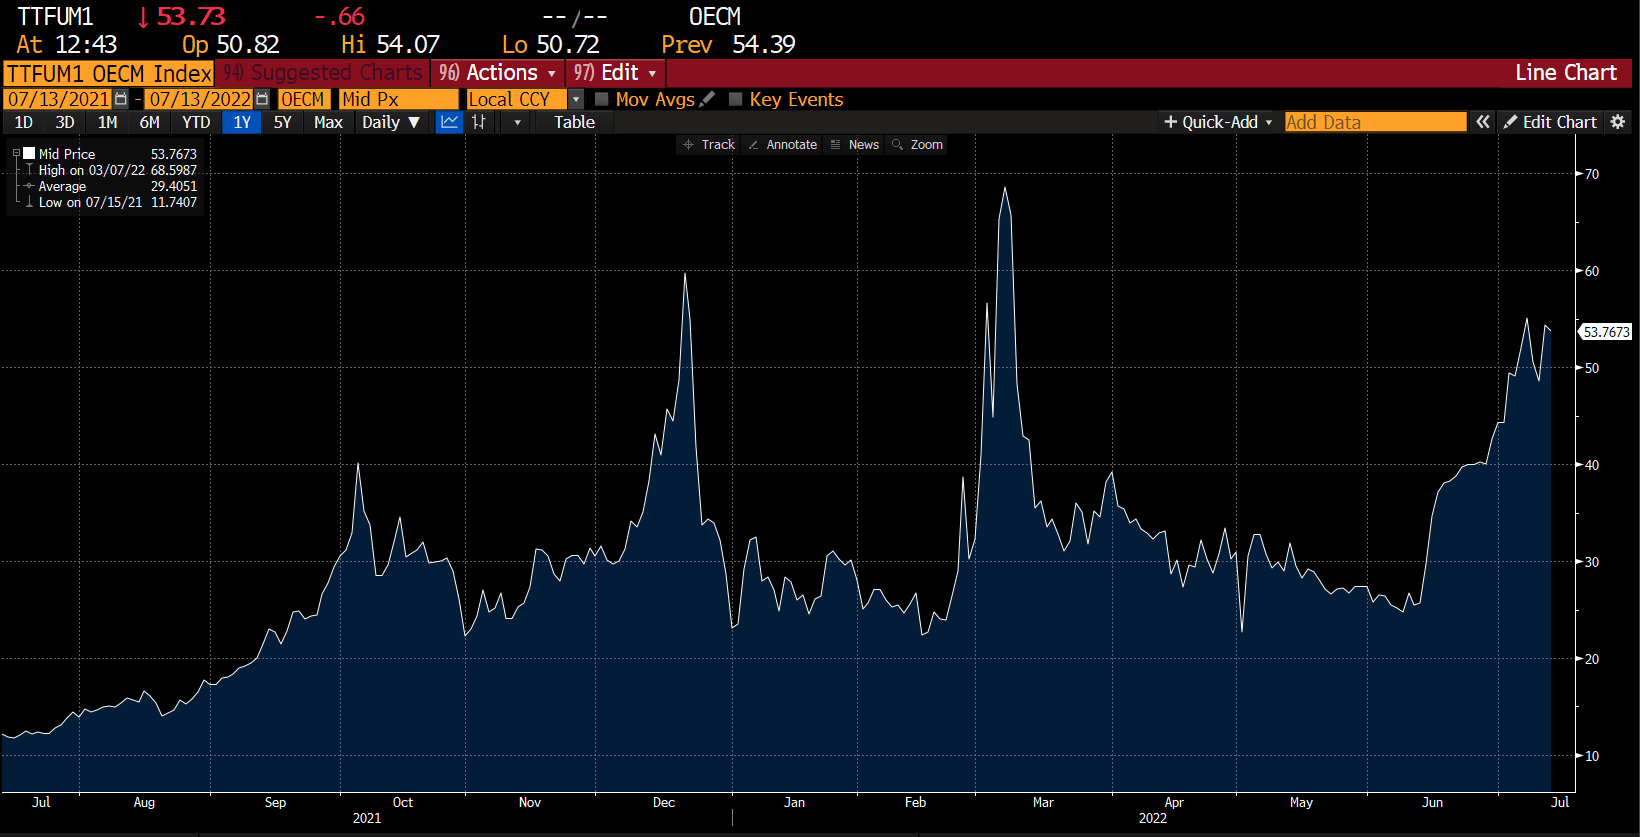
For context, Henry Hub natural gas prices, which determine US natural gas futures pricing is $6.75 as of this writing. So European prices are 8 times higher than here. These elevated European prices are already wreaking havoc. Electricite De France recently had to be taken over by the French government and the German government has had to rescue a utility called Uniper.
Nord Stream 1 Shutdown
As high as these European gas prices are currently, they have potential to go much higher. This past Monday (July 11th) Russia shut down Nord Stream 1, the pipeline bringing Russian natural gas to Europe, for annual maintenance that is supposed to last 10 days. The fear is that on Thursday July 21, the gas doesn’t flow again or flows at some reduced level. If it doesn’t flow at all, I fear that European natural gas prices go from nose bleed levels to truly stratospheric. I believe such an event would be horrific for broader risk assets as I think it would almost certainly push Europe into a severe recession at best. I believe European industry would basically have to shut down, all utilities would have to be nationalized and European consumers would only spend on bare necessities.
l Ironically, a massive spike could force countries like Germany and France to cry uncle and remove all sanctions against Putin, which would be a huge plus for risk assets. But the initial move before the capitulation would be terrible for most.
The Way to Protect Against a Shutdown of Russian Gas
Two companies would disproportionately benefit from Russian cutting Europe off from its natural gas, Equinor (EQNR), which I have written about fairly extensively mostly on the strength of European gas prices and Vermillion (NYSE:VET), which is an under the radar beneficiary.
Vermillion has operates in three main areas: North America (western Canada and Bakken), Australia and Europe. The big part of Vermillion that I believe the market is underappreciating is the European assets, specifically the company’s soon-to-be-expanded stake in the Corrib gas field off the coast of Ireland.
Vermillion Operational Geography (Vermillion Presentation)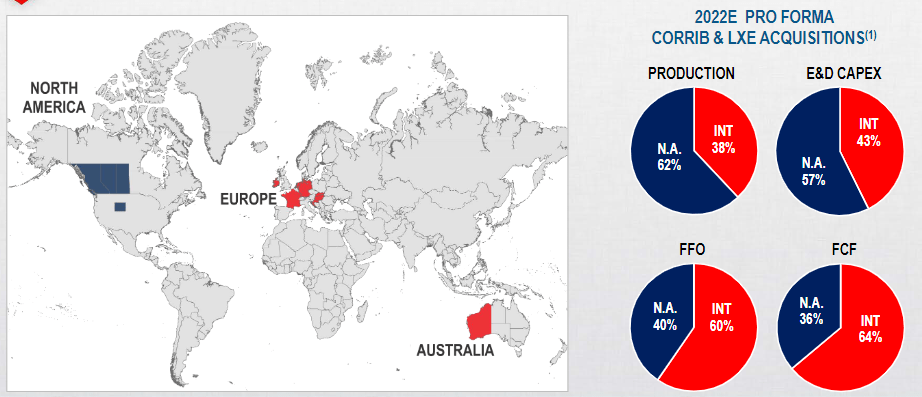
Vermillion is currently the operator and 20% owner of Corrib. Last November they announced the acquisition of EQNR’s 36.5% stake in Corrib for ~$600 million with an effective date of January 1, 2022. So while the deal has not closed until it receives regulatory approval (I expect virtually no risk to this regulatory approval), the cash flows started accruing for Vermillion on January 1, just as European natural gas prices started spiking. However, since the deal has not closed and Vermillion has not included the Corrib profits in their numbers, many online financial web sites are not including them in VET’s valuation.
Corrib Acquisition Pro-Formas (Vermillion Presentation)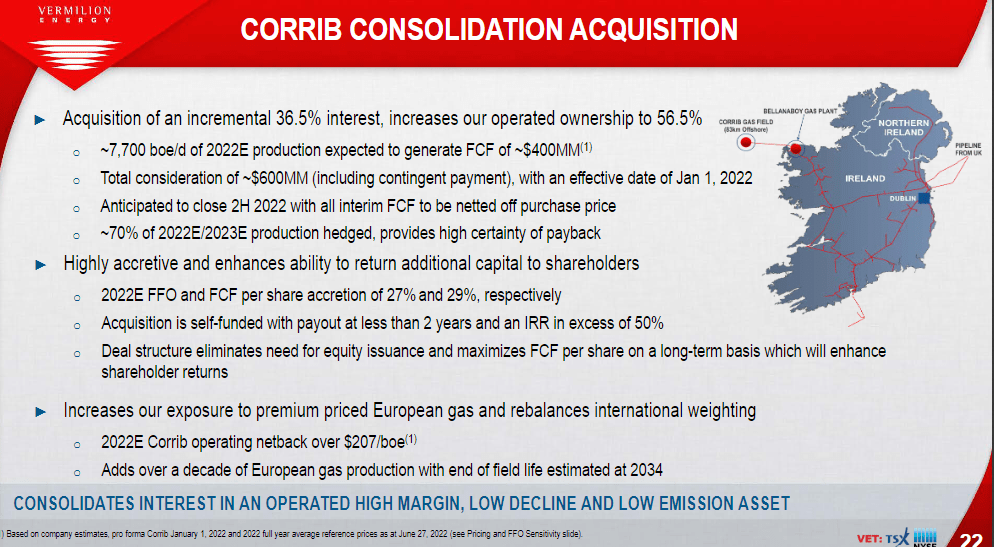
As you can see in the slide above, this deal is a massive benefit to VET (~$400mm of FCF). This cash flow taken along with another acquisition (Leucrotta) that just closed in June, means VET expects $1.8 billion of hedged free cash flow for 2022 and even higher cash flows next year (using strip prices that are below current spot prices).
Vermillion 2022 Cash Flow projections (Vermillion Presentation) Vermillion 2022-2024 Cash Flow Projections (Vermillion Presentation)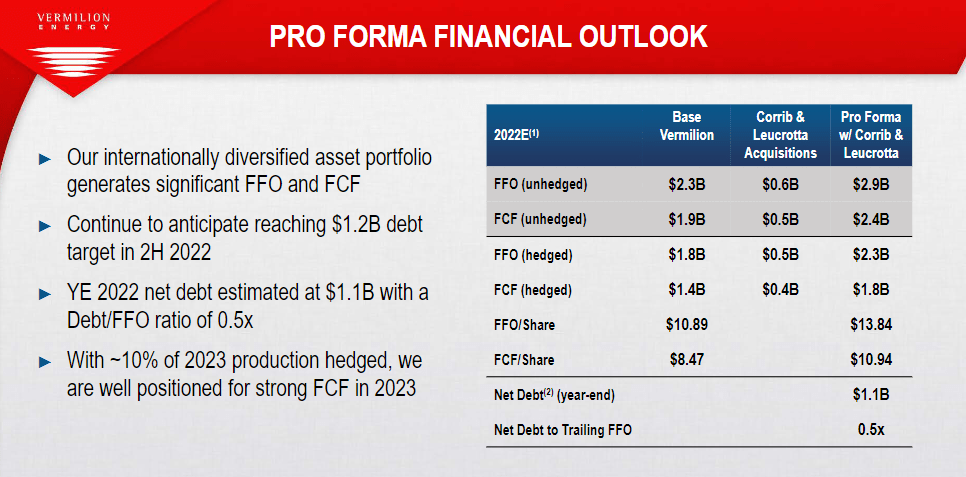
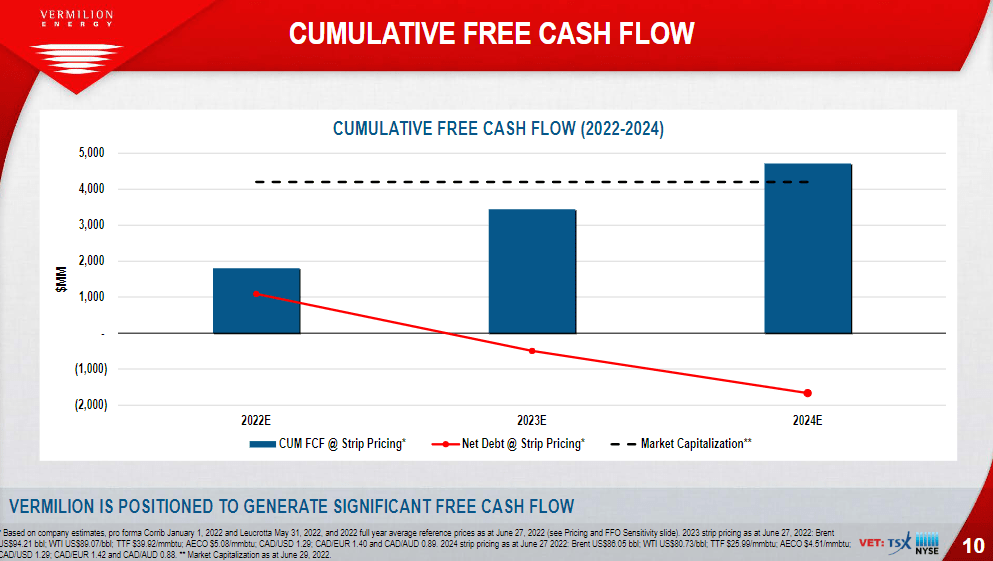
Anyone who has followed energy is used to seeing spikes in cash flows. Two things separate these cash flows from those of other companies.
- Vermillion expects to finish the year at $1.1 billion of debt and only ~$3 billion market cap. That translates to VET trading at ~60% free cash flow yield to the equity and just under 50% through total Enterprise Value. I can’t think of any company this cheap.
- These free cash flow numbers are based on European natural gas prices around $38/mmbtu versus the much higher current rates and if Russia cuts off its natural gas, these numbers could go significantly higher.
Other people on Seeking Alpha have highlighted how cheap Vermillion is. Tom Lott wrote a particularly great write up a few months ago. I suggest anyone who wants a deep dive on the company to read his work. I am more pointing out that not only is VET cheap on an absolute and relative level, it is an incredibly attractive option (along with EQNR) for a potential major black swan event that could happen next week.
Conclusion
Energy has had a rough few weeks with many stocks selling off far more than the underlying commodities they sell. I have argued recently that I believe energy writ large still offers tremendous value. I still believe that, and I think that the next week and a half could be particularly beneficial to VET and EQNR.
Be the first to comment