

David Ramos/Getty Images News
Investment Thesis
The thesis of this article is that now is the best time to buy Verizon Communications (VZ) in a decade. And as you will see from this analysis that the bull thesis is supported by several good reasons, ranging from business profitability, secular support, to valuation, specifically:
- With its scale and reach, VZ is well poised to benefit from the secular trend of our data usage.
- It enjoys consistently high profitability, as measured by the return on capital employed
- And yet, its valuation is at a cyclical low. According to what I call Buffett’s 10x pretax rule (which he followed, again, with his VZ investment), it is equivalent to a 13.5% equity bond with coupon payment growth built-in.
The decade-long decline in its fixed-line business has compressed its valuation but it is towards the end. And at the same time, its heavy investments in high-end technology like fiber-optic cable and 5G are beginning to pay off. The growth opportunities are abundant as our data usage explodes. As such, the stock is poised to deliver an outsized return in the decade ahead, as we will detail in the 4 charts below.
Chart 1: the elephant in the room
Let’s address the elephant in the room first – price decline and infrastructure cost. Many people are hesitant to invest in the telecommunication sector because of A) the sharp price decline of data fees, and B) the heavy investment requirement in infrastructure. Indeed, as you can see from the following first chart, the price per megabit per second of cable broadband service has declined by 98% over the last twenty years, declining from an average of $28.13 in 2000 to $0.64 in 2020. At the same time, broadband is the most costly infrastructure investment in recent American history (also arguably the most important one for our transition into the current internet-based economy).
Let’s first address the infrastructure issue. VZ is the largest wireless service provider in the U.S., and its network covers more than 98% of the U.S. population. VZ competes with two other major players: AT&T (T) and T-Mobile (TMUS). The competition involves staggering CAPEx investments and expenditures from all of them. They all have invested a staggering amount to build up the networks that they operate today, and they will have to keep investing a large amount of CAPEx to keep up (think of the 3G, 4G, and 5G transitions that have happened in just the recent decade). But the flip side is:
- The CAPEx and infrastructure requirements actually form a high barrier of entry.
- Furthermore, VZ enjoys stable profitability to fund such investments as we will see later. Also, capital expenditures are likely to fall in the current year for VZ. Management has earmarked approximately $16.5 billion to $17.5 billion for capital projects in 2022, a decrease from $18.2 billion in 2021. The reason is that VZ now has started its progress towards lower capital intensity.
- And finally, a sector dominated by a few (say 3) large players is easier to reach equilibrium as to be detailed later in the risk section.
Now, we will use the second chart below to address the price issue.
Source: https://www.ncta.com/industry-data/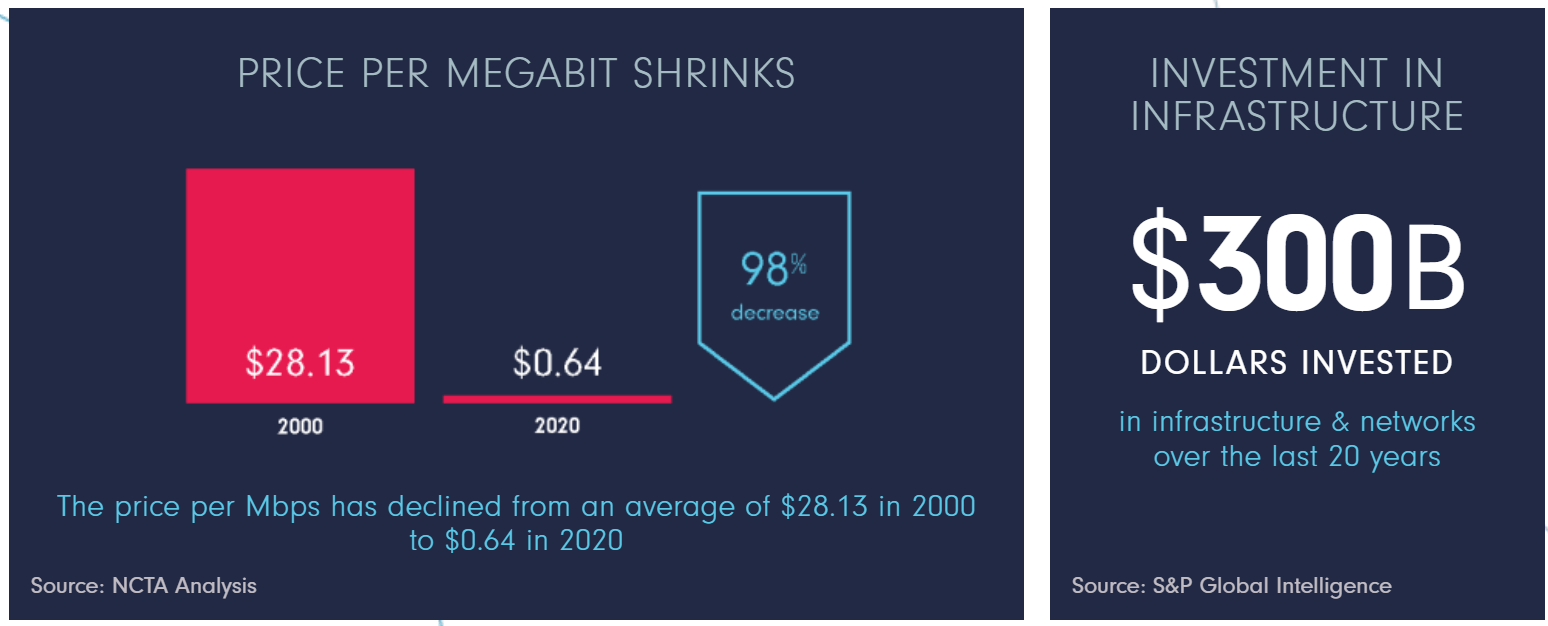
Chart 2: the magic scalability of our data usage
Yes, data fees have become 98% cheaper in the past 20 years. That is, for the same amount of data, we only need to pay 1/50 of the price today than 20 years ago.
BUT data usage is the best example that has the magical scalability trait – as the unit cost becomes cheaper, we use a LOT more of it. And once we are used to more of it, we cannot go back to less of it anymore. So as a result, the total market has actually gone up, despite the dramatic price drop. And looking forward, in only one direction that it can go in the future – to become bigger. Such scalability provides the most reliable engine to drive the secular trend.
As seen in the chart below, our appetite for data is non-satiating. The average US household is using 3.5x the amount of internet data they were only five years ago, and is using 38x the amount of internet data they were ten years ago! Such trend is expected to continue and our data usage is expected to almost double again by 2023~2024 from the current level – in only about 4 years! Such explosion has easily made up the price drop, and then some more.
The future driving force is that our internet needs in the future will be symmetrical. Viewing YouTube and Netflix videos, the largest two data traffic websites today, are asymmetrical. But they have already created a staggering amount of data needs. Our next need, symmetrical needs (think real-time streaming, conferencing, lecturing et al), will only cause another explosion of data needs.
And such explosion will easily make up the price drop, as it does in the past.
Source: https://decisiondata.org/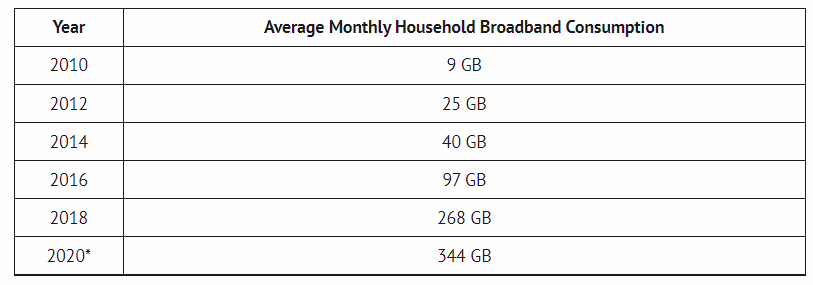
Chart 3: stable profitability
When we think like a long-term business owner, not a stock trader, a key metric (the most important metric in my opinion) is the return on capital employed (ROCE). Details of the analysis of ROCE has been elaborated on in my earlier articles, and here I will just provide a very brief recap for ease of reference:
ROCE is different from the more commonly quoted return on equity (“ROE”). ROCE is the profit earned on the capital ACTUALLY employed, and it would be the same as ROE if the book value equals the capital actually employed. But more often than not, the book value is not the capital actually employed. That is why ROCE is more fundamentally important.
A consistent and high ROCE also shows how effectively the reinvested income can be used to fuel further earning growth. In the long term, the growth rate is given by
Long term growth rate = ROCE * Reinvestment Rate
Thus a higher ROCE allows a business to reinvestment less of its earnings and grow more at the same time. And the combination of high ROCE and capital allocation flexibility is the key for a long-term compounder.
Under this background, to estimate the ROCE of businesses like VZ, I consider the following items of capital actually employed 1) Working capital, including payables, receivables, inventory, 2) Gross Property, Plant, and Equipment, 3) Research and development expenses are also capitalized. Based on the above considerations, the ROCE of VZ over the past decade is shown below. As seen, it was able to maintain a remarkably consistent and respectably high level of ROCE over the past decade: it has been above 31% almost consistently over the decade.
To put things into perspective, the average ROCE for the overall economy is currently about 18% (approximated by the ROE of S&P 500), and the average ROCE for the overachieving FAAMG group is about ~50%.
Author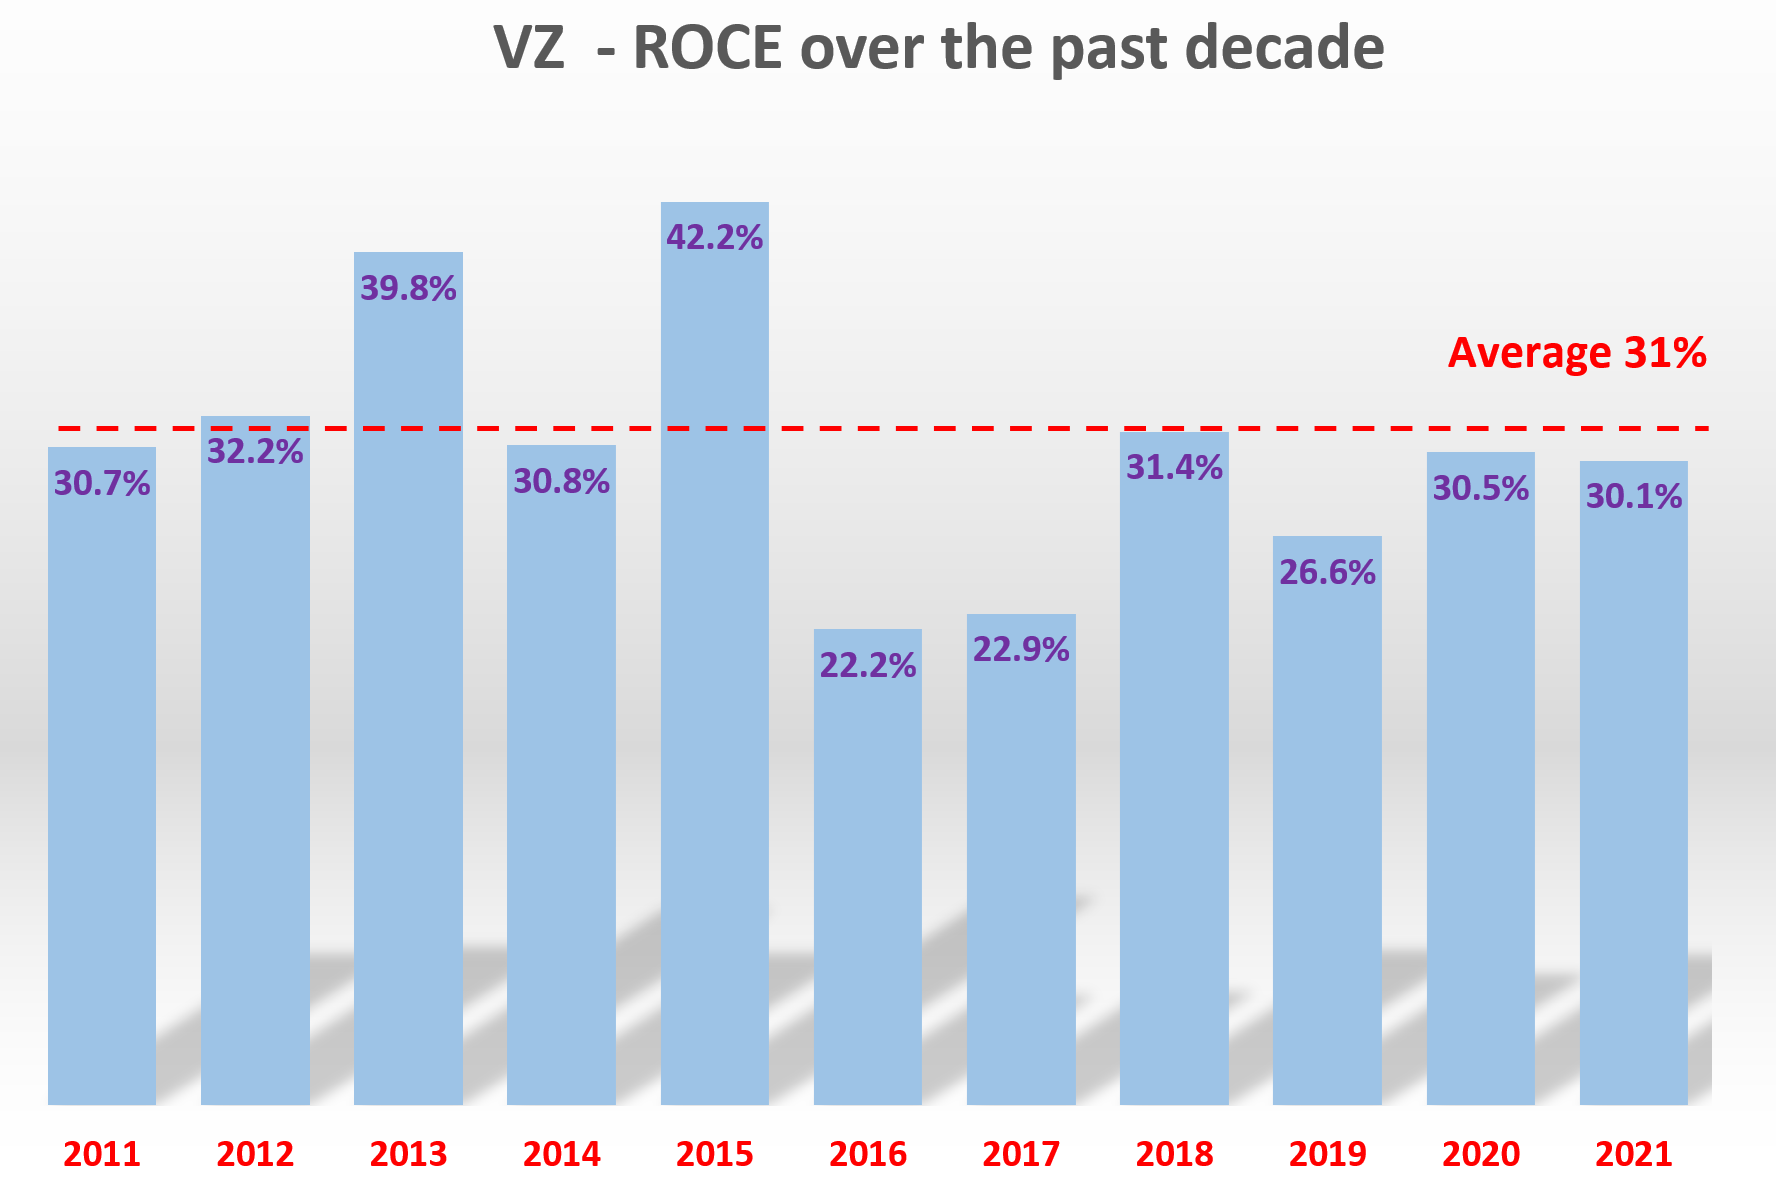
Chart 4 – valuation and Buffet 10x pretax rule
Now with its long-term staying power and stable profitability established, let’s look at its valuation using what I call Buffett 10x pretax rule. The rule is especially relevant here because Buffett himself holds a sizable VZ position in his Berkshire portfolio. If you are interested in the details, they are provided in our earlier writings on Buffett’s 10x pretax rule. And a very brief summary is provided below:
- Buffett himself has paid ~10x pretax earnings for so many of his largest and best deals. The list is a really long one, ranging from Coca-Cola, American Express, Wells Fargo, Walmart, Burlington Northern, and the more recent Apple.
- After-tax earnings do not reflect business fundamentals as well as pretax earnings (“EBT”).
- Pretax earnings are easier to benchmark, say against bond earnings. When we speak of bond yield, that yield is pretax. So a 10x EBT would provide a 10% pretax earnings yield, directly comparable to a 10% yield bond.
- As a result, if we get to buy a business with staying power at 10x EBT and even if the business stagnates forever, we are already perfectly happy to be making a 10% return pretax. Any growth is a bonus.
And as you can see from the chart below, Buffett has accumulated his shares almost exclusively near or below 10x EBT. Paying 10x EBT for a business that will stagnate forever is like owning a bond with a 10% yield. In VZ’s case here, the current valuation is significantly lower than 10x EBT. It is at 7.4x FW EBT as of this writing, equivalent to purchasing a bond yielding 13.5%. At the same time, there is a good prospect that VZ will feature some long-term growth with its leading position and secular trend mentioned above. If history is of any guidance – its earnings have grown at 7.5% CAGR in the past 10 years and 5% in the past 5 years. Its dividends have grown at 2.5% CAGR both in the past 10 and 5 years.
So in the long-term, VZ is equivalent to an equity bond with a 13.5% yield and growth built into the coupon payments.
Source: author based on Seeking Alpha data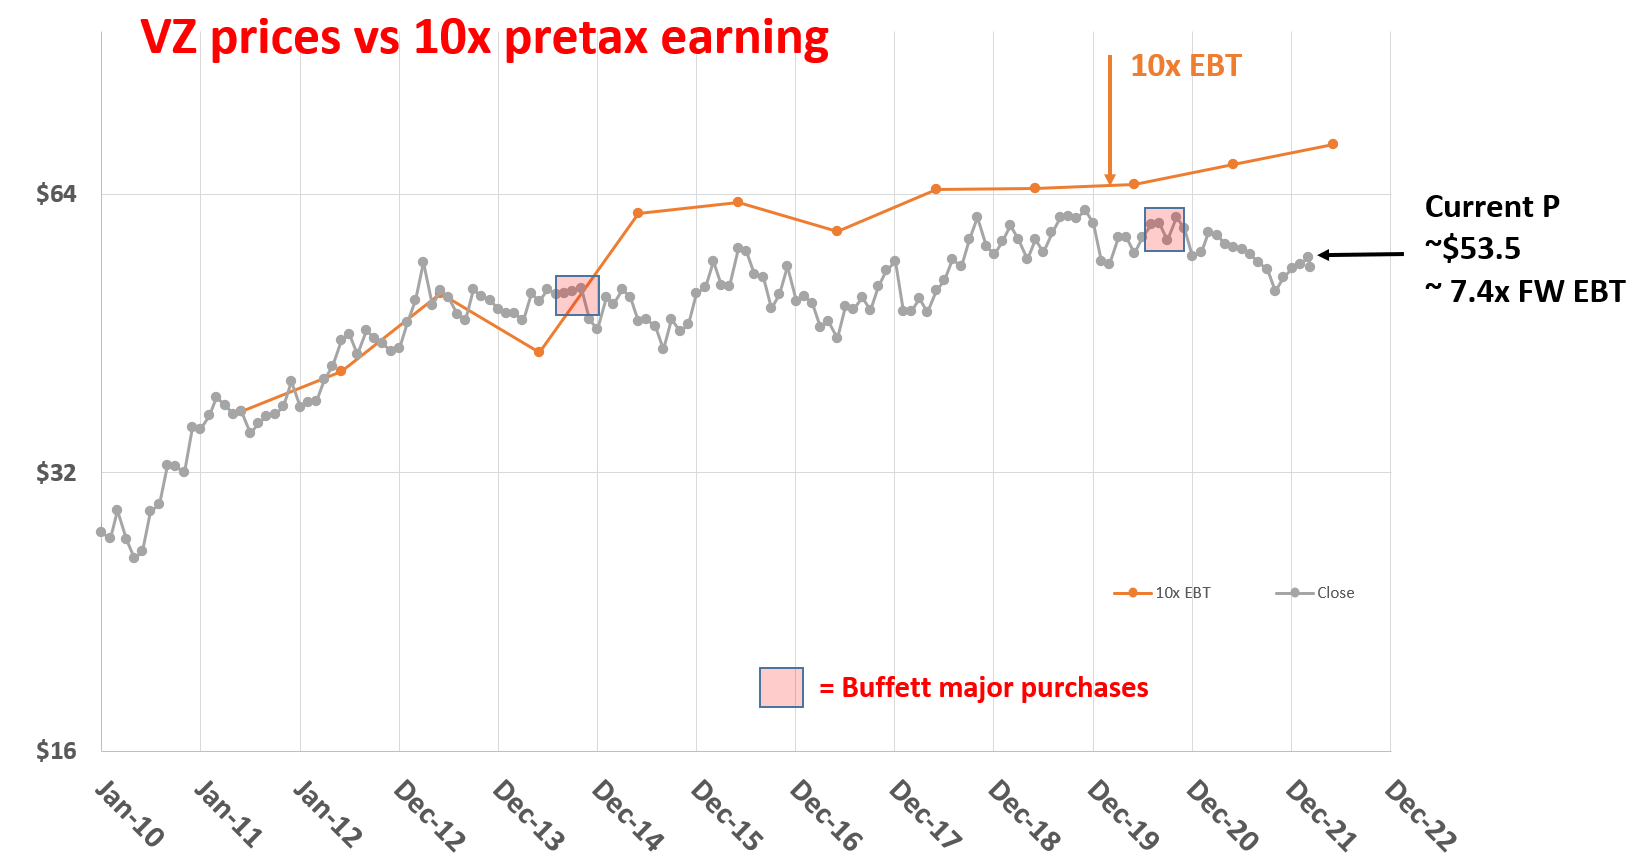
Risks and other considerations
- Interest rate risk. As aforementioned, VZ relies on debt financing and its current long-term debt is about $144B. Hence, a 1% increase in its interest rate would translate into $1.44B of additional interest expenses. Its operating cash is about $27.5B in 2021. Therefore, the additional interest expenses are about 3.8% of its operating cash, a relatively small but non-negligible risk.
- It is uncertain how VZ’s competition with two other major players, AT&T (T) and T-Mobile (TMUS), will play out. This sector is close to a competition equilibrium among these three dominant companies now. In total, they occupy more than 95% of the spectrum offered. VZ currently enjoys superior profitability among these three in terms of profit margin, operating margin, and return on equity. However, rival carriers, especially T-Mobile, have a lead in terms of deployment of new spectrum and technology to add coverage and capacity. Verizon no longer enjoys the network dominance it used to have. As a particular example, VZ has recently launched its “national” 5G mobile service, but its coverage is still limited and not truly national.
Conclusion and final thought
The thesis is that now is the best time to buy VZ with its valuation at a secular low and fundamental prospects a secular high. Specifically:
- With its scale and reach, VZ is well poised to benefit from the secular trend of our data usage. The growth opportunities are abundant as our data usage explodes and move into the symmetrical paradigm.
- And at the same time, its heavy investments in high-end technology like fiber-optic cable and 5G are beginning to pay off. Also, capital expenditures are likely to fall in the current year for VZ. Management has earmarked approximately $16.5 billion to $17.5 billion for capital projects in 2022, a decrease from $18.2 billion in 2021. The reason is that VZ now has started its progress towards lower capital intensity.
- And yet, its valuation is at a cyclical low. According to what I call Buffett’s 10x pretax rule, it is equivalent to a 13.5% equity bond. Buffett has accumulated his shares following this rule. And now it is at 7.4x FW EBT as of this writing, equivalent to purchasing an equity bond yielding 13.5%, with coupon growth built-in.
Be the first to comment