

Pgiam/iStock via Getty Images
Investment Thesis
Note: This article intends a swap transaction typically not suitable for portfolios not sheltered from US income taxes.
Knowing when and which stocks to own, actively and selectively, provides a continuing series of net capital gain opportunities delivering wealth accumulation or spendable income at rates which are multiples of what market-index ETF offer.
You can know what winning institutions know about capital-building stock situations by listening to what the markets tell as capital is being invested. Because today’s markets pay active investors for being in the right places at the right times. They feed off the indolence of passive-strategy investing buy&holders who frequently pass-up timely points of profitable position liquidation.
Increased information technology, communication capabilities, and rapidly evolving competitive practices make this century’s investing markets far more opportune with pricing activity than the 20th century offered. FOMO of a 5% annual dividend.
But an active investment strategy requires reasonably-accurate forecasts of what to expect. Fortunately the conditions creating the “hazards” feared by the buy&holders are what provide the needed forecasts. The markets themselves, in their interactions, define what the best-informed professional practitioners see as coming-price limits. In both directions.
Instead of forecasts by analysts of what may be hoped for as price/earnings targets to be sought, the markets define ranges within which prices are reasonably being expected. Ranges warning of currently unmaintainable excesses, and of price depressions unlikely to present buying bargains for long.
But if this is not a suitable practice for your situation, continue to ignore it. We are pleased to have your persistent support, rather than competition which might erode our wealth-building productivity.
Risk and Reward Balances Among Communication Services Producers
Let’s look at an “Opportunity Set” of comparable companies ranging from most to least attractive to consider in one particular area of activity today – Communications. One best-appraised buy is Verizon Communications Inc. (NYSE:VZ). Another is T-Mobile US, Inc. (TMUS). Here in Figure 1 is how the markets currently appraise their Reward ~ Risk trade-offs.
Figure 1
blockdesk.com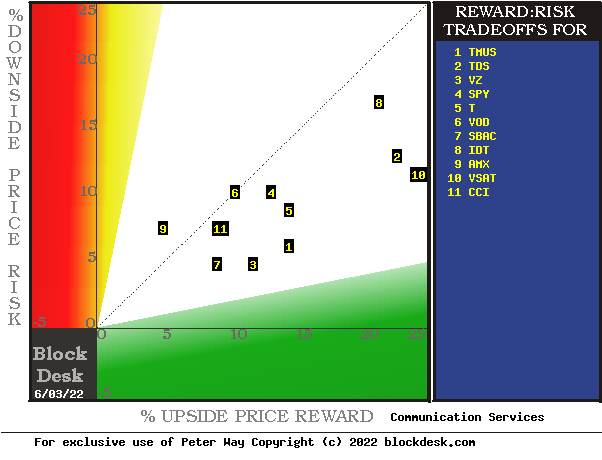
(used with permission)
Upside price rewards are from the behavioral analysis (of what systems require to be done, not of emotional investor errors) by Market-Makers [MMs] as they protect their at-risk capital from possible damaging future price moves. Their potential reward forecasts are measured by the green horizontal scale.
The risk dimension is of actual price drawdowns at their most extreme point while being held in previous pursuit of upside rewards similar to the ones currently being seen. They are measured on the red vertical scale.
Both scales are of percent change from zero to 25%. Any stock or ETF whose present risk exposure exceeds its reward prospect will be above the dotted diagonal line. Capital-gain attractive to-buy issues are in the directions down and to the right.
Our principal interest is in VZ at location [3]. A “market index” norm of reward~risk tradeoffs is offered by SPY at [4]. Most appealing by this Figure 1 view is TMUS.
Description of Subject Companies
Verizon Communications Inc., through its subsidiaries, offers communications, technology, information, and entertainment products and services to consumers, businesses, and governmental entities worldwide. As of December 31, 2021, it had approximately 115 million wireless retail connections, 7 million wireline broadband connections, and 4 million Fios video connections. 27 million wireless retail postpaid connections and 477 thousand wireline broadband connections. The company was formerly known as Bell Atlantic Corporation and changed its name to Verizon Communications Inc. in June 2000. Verizon Communications Inc. was incorporated in 1983 and is headquartered in New York, New York.
Source: Yahoo Finance
yahoo finance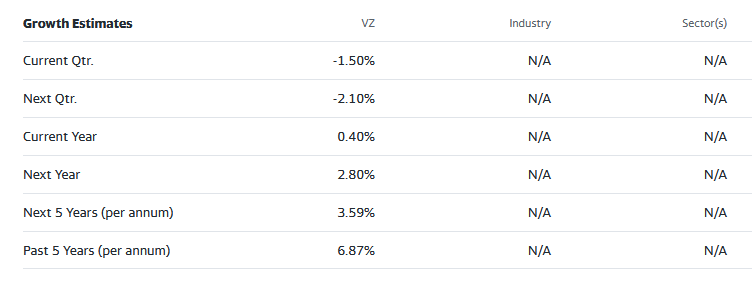
T-Mobile US, Inc., together with its subsidiaries, provides mobile communications services in the United States, Puerto Rico, and the United States Virgin Islands. The company offers voice, messaging, and data services to 108.7 million customers in the postpaid, prepaid, and wholesale markets. The company was founded in 1994 and is headquartered in Bellevue, Washington.
Source: Yahoo Finance
Yahoo Finance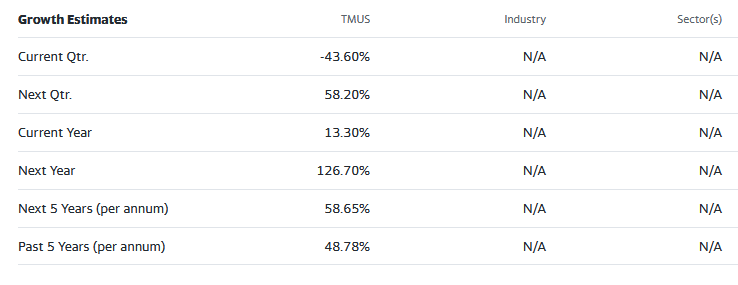
These growth estimates have been made by and are collected from Wall Street analysts to suggest what conventional methodology currently produces. The typical variations across forecast horizons of different time periods illustrate the difficulty of making value comparisons when the forecast horizon is not clearly defined.
The Figure 1 map provides a good visual comparison of the two most important aspects of every equity investment in the short term. There are other aspects of comparison which this map sometimes does not communicate well, particularly when general market perspectives like those of SPY are involved. Where questions of “how likely’ are present other comparative tables, like Figure 2, may be useful.
Figure 2
blockdesk.com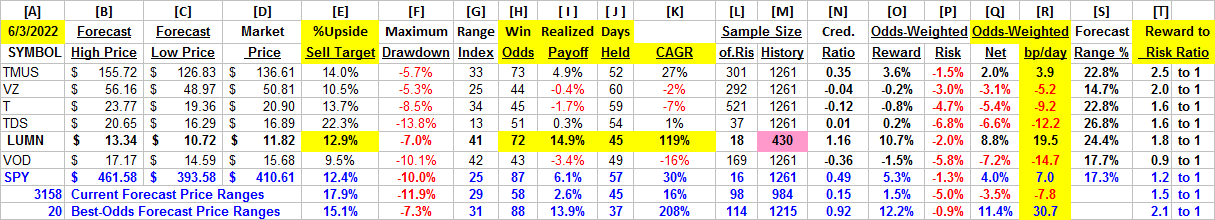
(used with permission)
Why do all this math?
Figure 2’s purpose is to attempt universally comparable answers, stock by stock, of a) How BIG the prospective price gain payoff may be, b) how LIKELY the payoff will be a profitable experience, c) how SOON it may happen, and d) what price drawdown RISK may be encountered during its holding period.
Readers familiar with our analysis methods after quick examination of Figure 2 may wish to skip to the next section viewing price range forecast trends for TMUS.
Column headers for Figure 2 define investment-choice preference elements for each row stock whose symbol appears at the left in column [A]. The elements are derived or calculated separately for each stock, based on the specifics of its situation and current-day MM price-range forecasts. Data in red numerals are negative, usually undesirable to “long” holding positions. Table cells with yellow fills are of data for the stocks of principal interest and of all issues at the ranking column, [R]. Cells with pink fills, like column [M] row LUMN warn of deficiencies from minimum standards. In this case, less than 3 years of forecasts history at 252 market days per year.
The price-range forecast limits of columns [B] and [C] get defined by MM hedging actions to protect firm capital required to be put at risk of price changes from volume trade orders placed by big-$ “institutional” clients.
[E] measures potential upside risks for MM short positions created to fill such orders, and reward potentials for the buy-side positions so created. Prior forecasts like the present provide a history of relevant price draw-down risks for buyers. The most severe ones actually encountered are in [F], during holding periods in effort to reach [E] gains. Those are where buyers are emotionally most likely to accept losses.
The Range Index [G] tells where today’s price lies relative to the MM community’s forecast of upper and lower limits of coming prices. Its numeric is the percentage proportion of the full low to high forecast seen below the current market price.
[H] tells what proportion of the [L] sample of prior like-balance forecasts have earned gains by either having price reach its [B] target or be above its [D] entry cost at the end of a 3-month max-patience holding period limit. [ I ] gives the net gains-losses of those [L] experiences.
What makes TMUS most attractive in the group at this point in time is its ability to produce earnings most consistently at its present operating balance between share price risk and reward, the Range Index [G]. Credibility of the [E] upside prospect as evidenced in the [I] payoff is shown in [N].
Further Reward~Risk tradeoffs involve using the [H] odds for gains with the 100 – H loss odds as weights for N-conditioned [E] and for [F], for a combined-return score [Q]. The typical position holding period [J] on [Q] provides a figure of merit [fom] ranking measure [R] useful in portfolio position preferencing. Figure 2 is row-ranked on [R] among alternative candidate securities, with TMUS in top rank.
Along with the candidate-specific stocks these selection considerations are provided for the averages of some 3100 stocks for which MM price-range forecasts are available today, and 20 of the best-ranked (by fom) of those forecasts, as well as the forecast for S&P500 Index ETF (SPY) as an equity-market proxy.
As shown in column [T] of figure 2, those levels vary significantly between stocks. What matters is the net gain between investment gains and losses actually achieved following the forecasts, shown in column [I]. The Win Odds of [H] tells what proportion of the Sample RIs of each stock were profitable. Odds below 80% often have proven to lack reliability.
Recent Forecast Trends of Primary Subjects
Figure 3
blockdesk.com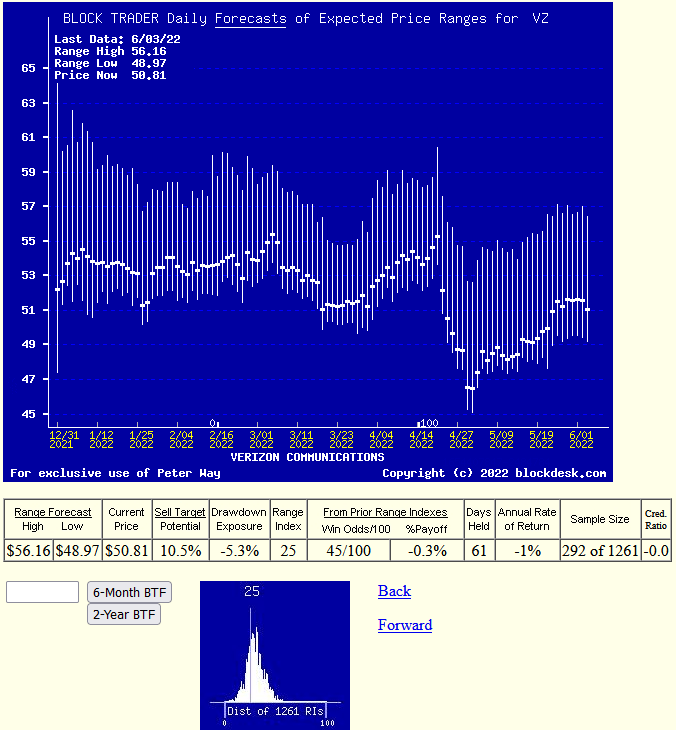
(used with permission)
Figure 4
blockdesk.com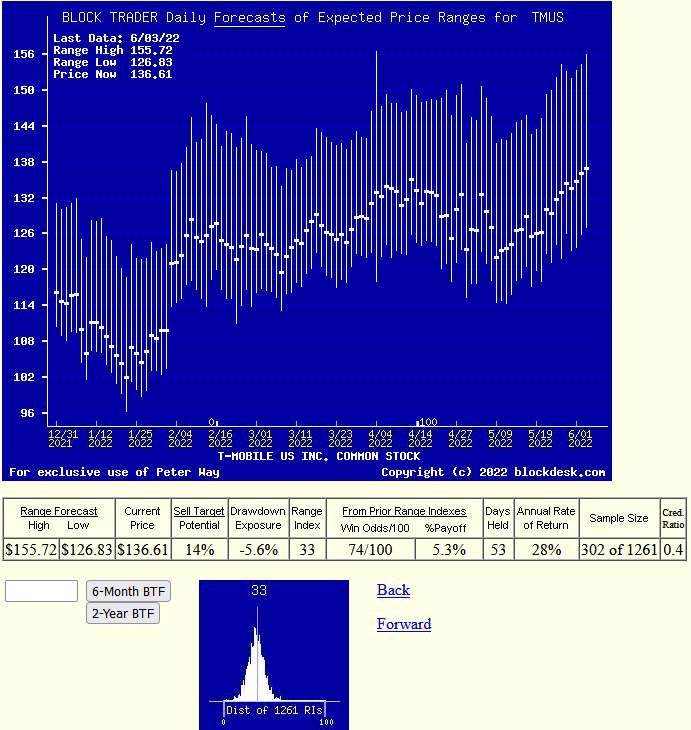
(used with permission)
Many investors confuse any picture of time-repeating stock prices with typical “technical analysis charts” of past stock price history. Instead, Figure 3’s vertical lines are a daily-updated visual record of price range forecast limits expected in the coming few weeks and months. The heavy dot in each vertical is the stock’s closing price on the day the forecast was made.
That market price point makes an explicit definition of the price reward and risk exposure expectations which were held by market participants at the time, with a visual display of the vertical balance between risk and reward.
The measure of that balance is the Range Index (RI). Here in TMUS, 33% of the full forecast range of $127 to $156 lies between the current price of $137 and $127. With today’s RI there is twice as much upside price change in prospect as downside. Three out of every four prior forecasts like today’s RI balance have been profitable, leaving some 80 of the earliers with losses. The net of that has been to reduce forecast potentials of +14% upsides to net accomplishments of +5.3% gains in 53 market days, or about 11 weeks. So history’s advantage could be repeated 4-5 times a year, which compounds into a CAGR of +28% which compares to a 5% dividend yield on VZ.
But is still a shade short of forecast expected capital gain rewards from the market-index ETF SPY.
Conclusion
Based on direct comparisons with other Communication Services industry investment alternatives, there are several clear reasons to prefer a capital-gain seeking buy in T-Mobile US, Inc.
Be the first to comment