

wildpixel/iStock via Getty Images
Introduction
Presumably, it might be tempting for investors to jump back into the S&P 500 or other large-cap equity funds following the recent tumultuous year. Whether you believe that the bottom for the S&P 500 had already occurred in July, or you believe that the bottom has yet to occur, small-cap value funds may be a better bet following the 2022 drawback. Small-cap value stocks have appeared to recover more quickly and have provided greater total returns for investors following severe market corrections. Additionally, U.S. small-cap value stocks appear to have been more reliable during prolonged periods of sideways trading. Therefore, for investors seeking capital appreciation, I think it is worth considering adding a small-cap value fund such as the Vanguard Small-Cap Value ETF (NYSEARCA:VBR) to your portfolio given the yield curve begins to flatten.
U.S. Small-Cap Value Funds Versus The S&P 500’s Total Returns
On a total return basis, small-cap value funds have outperformed the S&P 500 over the last 20 years. The following chart exhibits the total return performance from both A U.S. small-cap value index and the S&P 500.
Bloomberg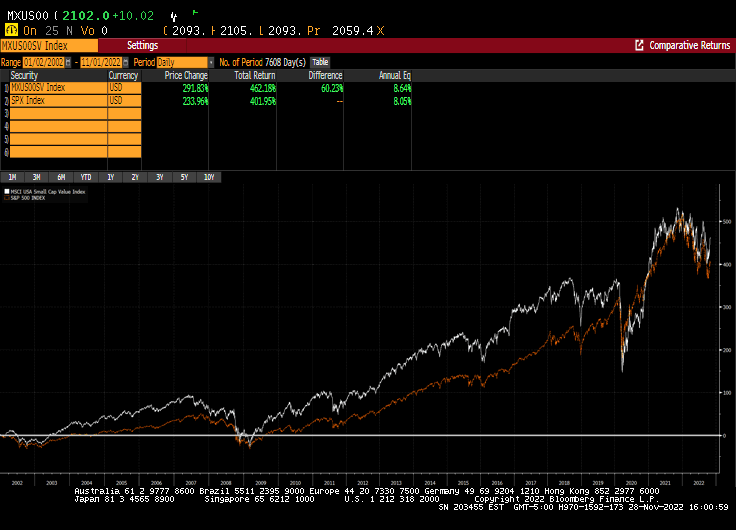
As you can see, small-cap value stocks over the last 20 years have beaten the S&P 500 by a total return differential of 60.23%. However, this doesn’t paint the entire picture, when accounting for the faster recoveries proceeding market drawdowns and their superior performance during prolonged stagnant market returns, small-cap value index funds have offered higher returns with less risk than the S&P 500.
Faster Recoveries Amid Market Drawdowns
As seen in the next few visuals, small-cap value funds have appeared to have recovered more quickly than the S&P 500. This is first exhibited following the bear market in 2000/2001 when small-cap value stocks recovered significantly faster than the S&P 500 exhibiting positive returns while the S&P 500 remained in the red.
Bloomberg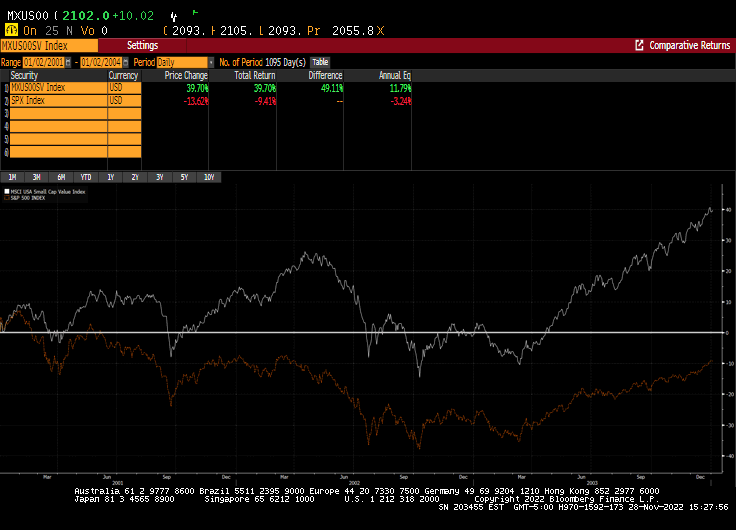
Furthermore, the 2000/2001 drawback was not the only bear market in which small-cap value funds subsequently outperformed the S&P 500. Following after both the bottoms of the 2020 and 2008 bear market, small-cap value index funds outperformed the S&P 500.
Bloomberg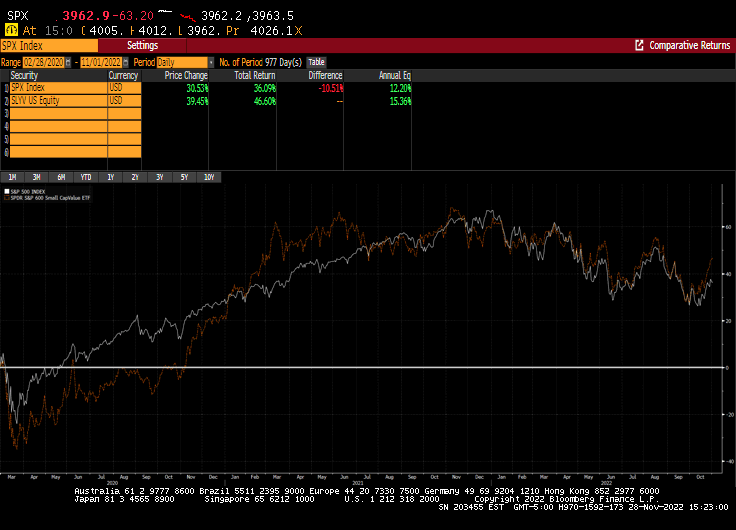
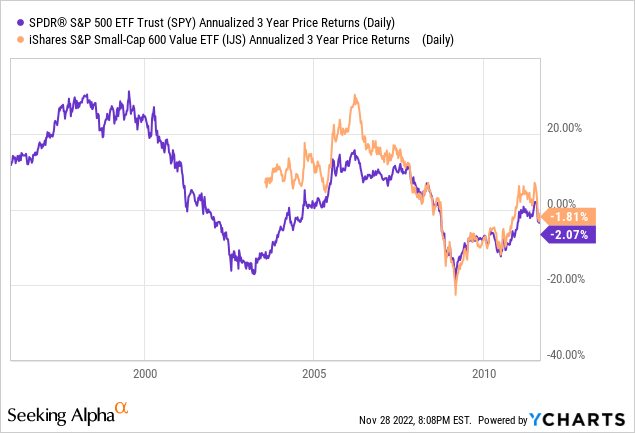
As you can see, the last 3 historical major bear markets were followed by outperformance by small-cap value index funds the next 2-3 years. Including following the 2020 bear market, when the S&P’s heavyweights displayed anomalous returns. This provides empirical evidence that small-cap value funds have recovered faster from market drawbacks than the S&P 500 and exhibited higher returns following the drawback. In my opinion, this is a better indicator of risk reduction than Beta or other volatility measures. Primarily because it shows less risk towards your investment principal in the long run.
Resilience During Prolonged Sideways Markets
The next reason why I’m leaning towards small-cap value index funds amid the market recovery is that small-cap value index funds have exhibited more resilience during prolonged recoveries by major indices. The most evident empirical analysis on this claim is the returns from 1999-2009, which was the famous lost decade for investors. The S&P 500 during this decade had provided investors with a compound annual return of -1.38% per year, while small-cap value index funds provided positive returns for investors throughout the decade.
Bloomberg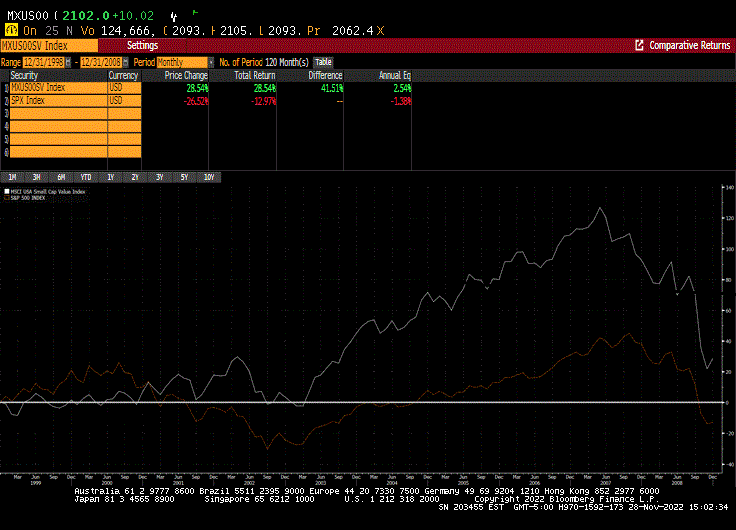
Although I am not predicting that the 2020s will in any way be a lost decade, this chart to some degree validates my previous point that small-cap value stocks have exhibited more safety, as they appear to recover faster and provide better returns amid systematic underperformance.
Risks: Yield Curve Inversion Must Subside Before Investors Hop Into High Beta
The 10-2 year yield spread has been one of the most prominent leading economic and stock market indicators. The yield spread between short and long-term government securities is shown below.
US Treasury Yield Curve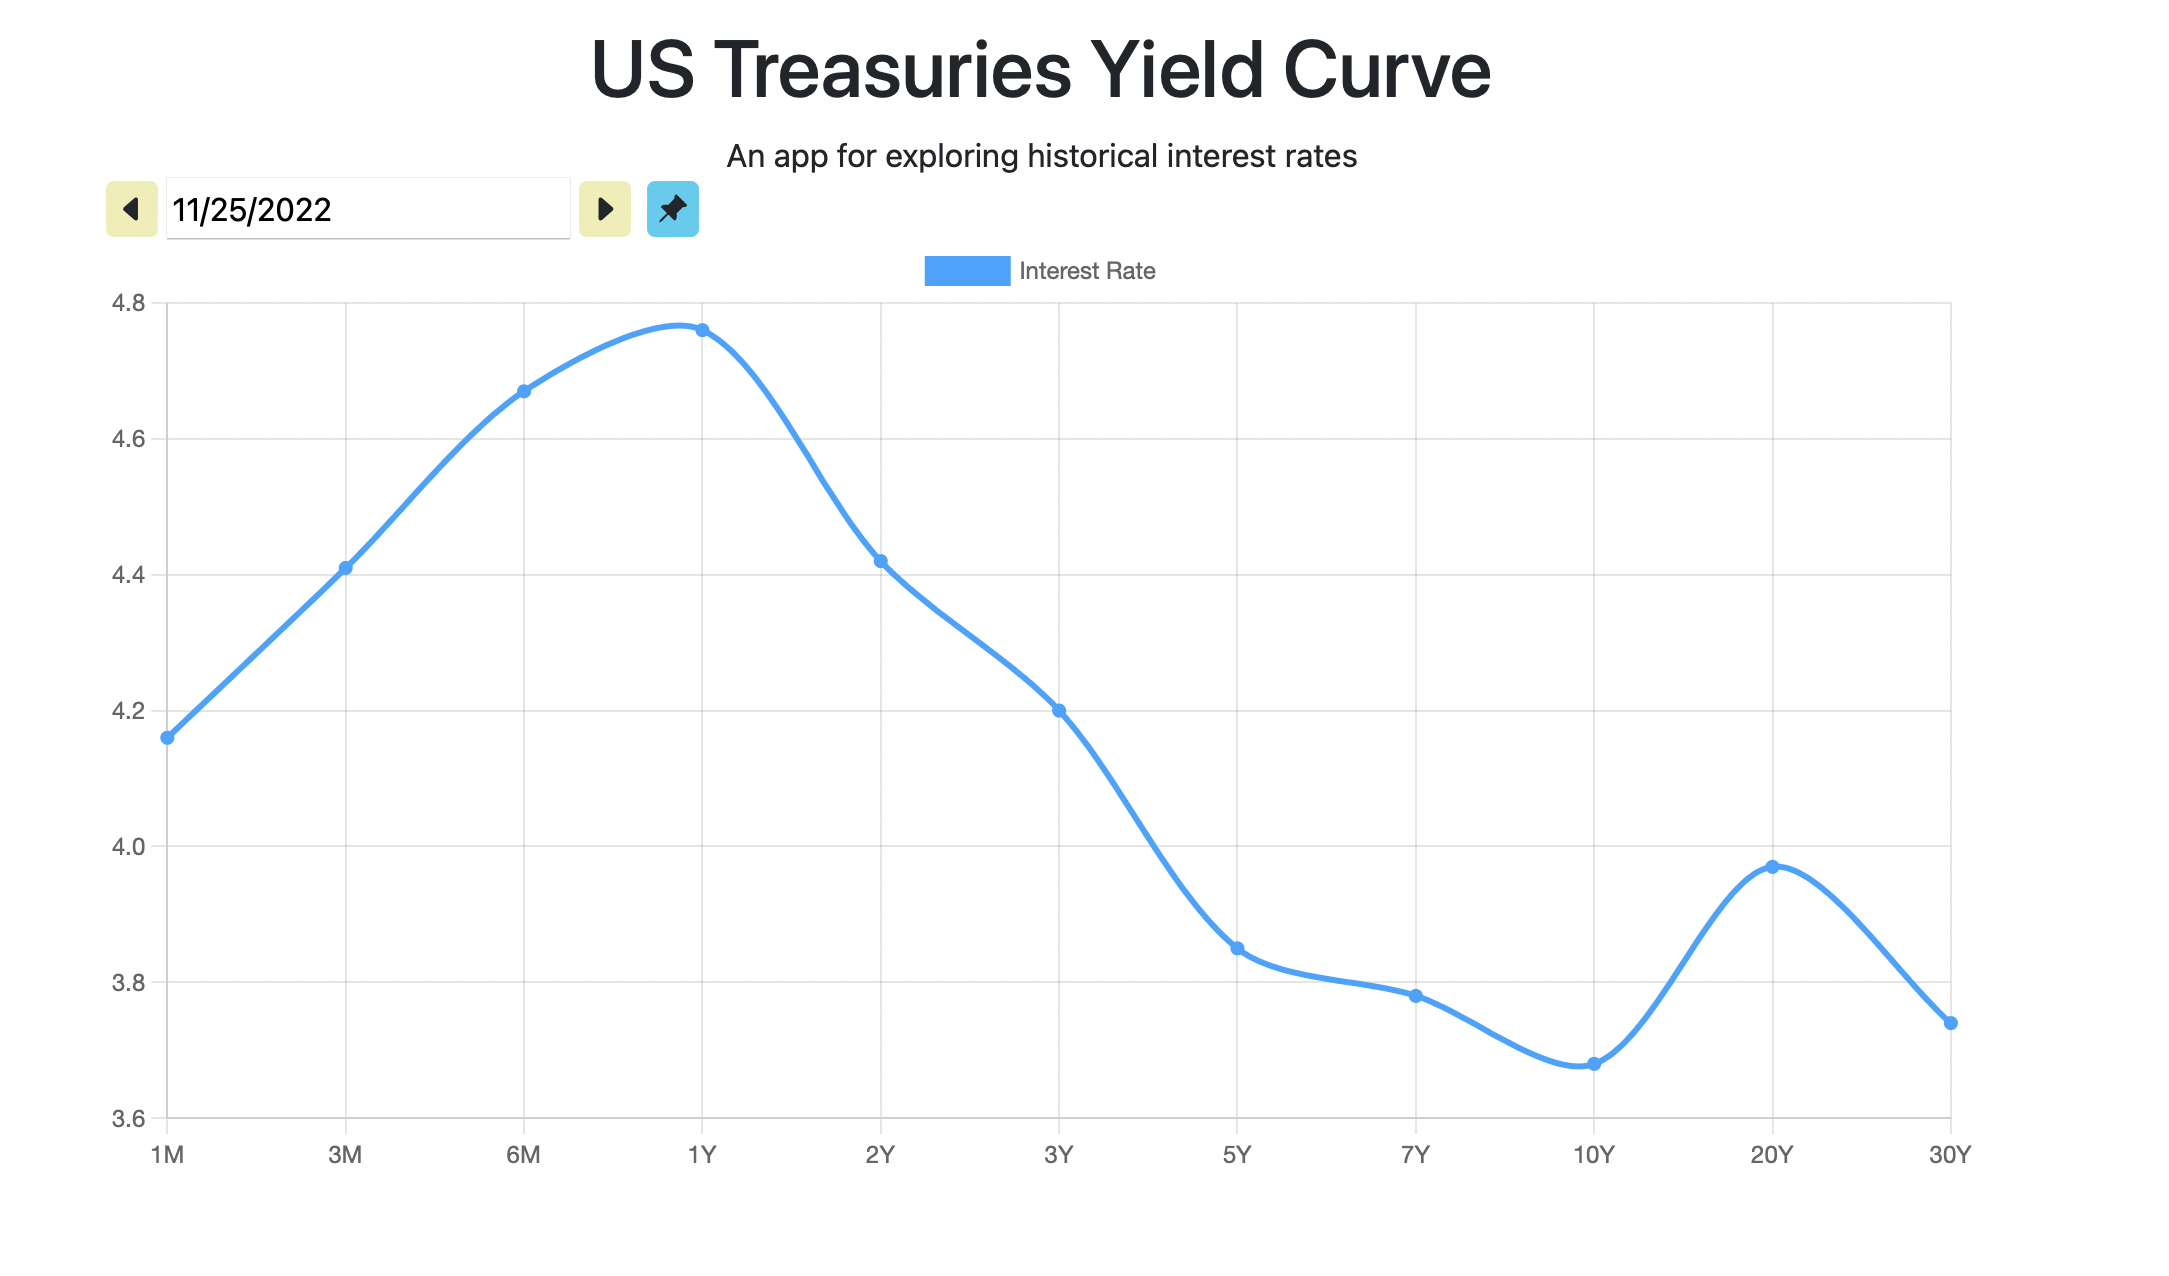
Evidently, we currently have an inverted 2-year, 10-year yield spread, which is an indicator of a future stock market drawdown. Although this indicator alone doesn’t predict recessions or stock market drawdowns, when combined with weakness in commodity prices, major companies such as Amazon (AMZN) announcing layoffs, and the Federal Reserve’s recent rate hikes, the realm of probabilities is weighing towards a recession. Additionally, the yield curve is an important indicator because we will most likely not see the yield curve steepen upward until a central bank pivot eventuates, which is when equity markets in my opinion will truly begin to rally upward again. Until the yield curve inversion undoes itself, investors should remain out of high-beta investments.
Conclusion
Small-cap value funds on an extra long-term basis have outperformed the S&P 500. In addition, despite the higher volatility that comes with these funds, they’ve exhibited greater resilience amid systematic risk events with faster recoveries and outperformance following bear markets. Furthermore, the Vanguard Small-Cap Value ETF is a small-cap value index ETF with a highly favorable expense ratio of 0.07%. Therefore, this ETF is a great substitute for S&P 500 index funds when the risk-on mindset presents itself.
Be the first to comment