

syahrir maulana
There are a few flavors of small caps from which investors can select. The popular (or at least most quoted) play is the Russell 2000 by way of the iShares ETF (IWM). Another is the S&P SmallCap 600 ETF through Vanguard’s (VIOO) or via the SPDR ETF (SLY). There’s also a Dow Jones small-cap index. Among Bogleheads, though, the Vanguard Small-Cap ETF (NYSEARCA:VB) is usually the go-to.
According to Vanguard, VB “tracks the performance of the CRSP US Small Cap Index, which measures the investment return of small-capitalization stocks”. “CRSP” stands for the Center for Research in Security Prices – an affiliate group of the University of Chicago. The index and the ETF both have more than 1500 holdings with a median market cap of $5.6 billion, according to ETFdb. The iShares Russell 2000 ETF (IWM), by contrast, has 1,985 holdings with a median market cap of just $3.1 billion. So you get a bit of a larger-cap spin with VB vs IWM.
You also capture good value with VB. The P/E ratio of the portfolio, according to Vanguard, is just 13.6x and its dividend yield is 1.47%. At just a 5 basis point expense ratio, you get broad exposure with strong liquidity through VB. The sector composition is about what you would expect with a domestic small-cap index fund – less weight in Tech vs a large-cap fund.
VB Sector Exposure: TMT Less vs Large Caps
Vanguard Group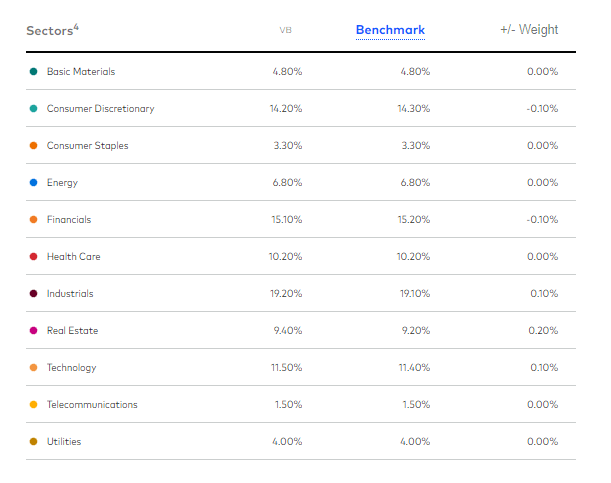
On valuation, domestic small caps look downright cheap. According to Yardeni Research, the S&P 600 small-cap index features a forward P/E ratio of just 11.3x. It’s important to know that this index includes only profitable companies and is larger compared (by median market cap) than the CRSP index. Valuations appear to be the best since the GFC lows and you have to go back to before 2000 to see a lower P/E than that. Of course, it remains to be seen whether forward earnings estimates will verify.
U.S. Small Cap Stocks Are Cheap
Yardeni.com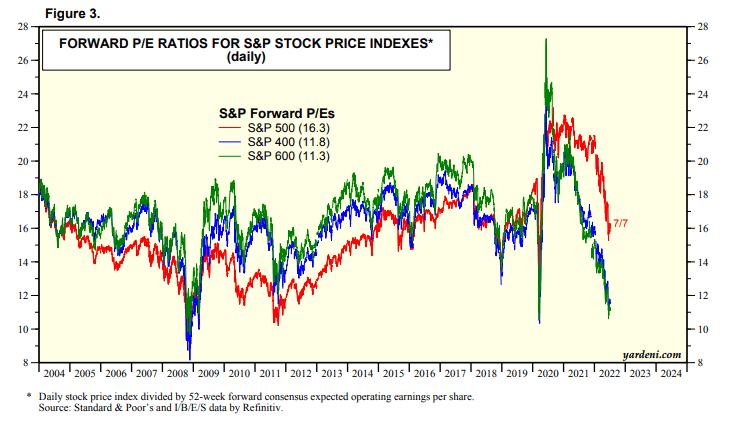
But there’s no doubt a lot of the air has been let out of the small-cap bubble. At current valuations, Bank of America Global Research estimates that returns over the coming decade will average roughly 12% based on today’s starting P/E. That’s a massive CAGR. Admittedly, Vanguard’s own 10-year return outlook for domestic small caps is just 2.3% to 3.3%, according to its May outlook.
Low Valuations = High Future Returns
BofA Global Research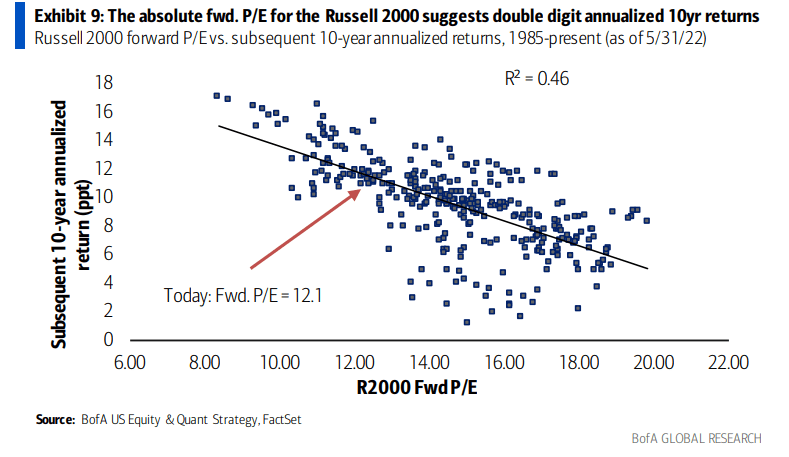
Many investors wonder if the current period is like the 1970s stagflation environment. If that’s the case, small caps could be a place to hide. Consider the below graph from BofA – U.S. small caps returned a staggering 35% per year, on average, from 1975 through 1981. Moreover, a strong U.S. dollar today might favor firms with strictly domestic sales versus large multinational corporations with significant foreign currency exposure.
The Stagflation Analog: Own the Smalls
Stockcharts.com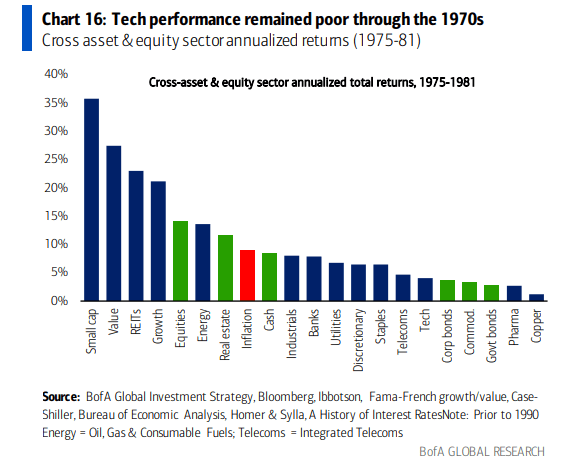
The Technical Take
Turning to the charts, VB held its 2018 and early 2020 peaks as support during this recent 50% correction off the March 2020 low through November 2021 rally. It’s a key level, and perhaps a spot where long-term investors and swing traders alike might consider scooping up shares. Short-term investors might look to go long with a stop under the $170 low recently while those with a long-time horizon are well served to establish a position at these cheap levels.
VB: 50% Retracement, Holding Key 2018 and 2020 Support
Stockcharts.com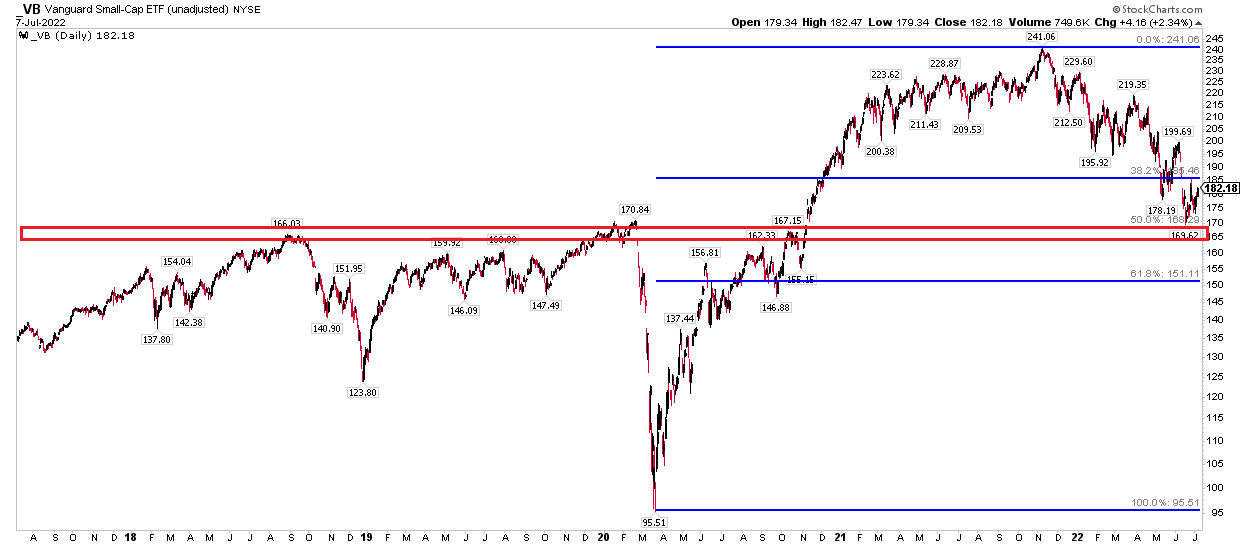
The Bottom Line
VB is a liquid and low-cost way to play domestic small-cap stocks. The ETF tracks the lesser-known CRSP small-cap index, not the Russell 2000 or S&P versions. Valuations suggest owning U.S. small-cap stocks here might pay significant returns going forward. Moreover, the current environment of high inflation, rising interest rates, and a strong USD could be bullish catalysts along with a favorable technical setup on the chart.
Be the first to comment