

insta_photos
The VanEck Vectors BDC Income ETF (NYSEARCA:BIZD) is a business development company, or BDC, index ETF. BIZD’s underlying companies focus on business loans to small and medium sized enterprises, a lucrative, high-yielding, but relatively risky niche. BIZD offers investors a strong, growing 9.2% yield, and a cheap valuation. The fund is a buy, but relatively risky, so only appropriate for more aggressive investors and retirees.
BIZD – Basics
- Investment Manager: VanEck
- Dividend Yield: 9.20%
- Management Fee: 0.40%
- Total Returns CAGR (Inception): 5.79%
BIZD – Overview
BIZD is a U.S. BDC index ETF. BDCs are financial institutions which provide funds, usually loans but sometimes equity, to small and medium sized U.S. enterprises. BDCs are generally quite diversified, although less so than the average mega-cap bank. As an example, Ares Capital (ARCC), the fund’s largest holding, has the following portfolio.
ARCC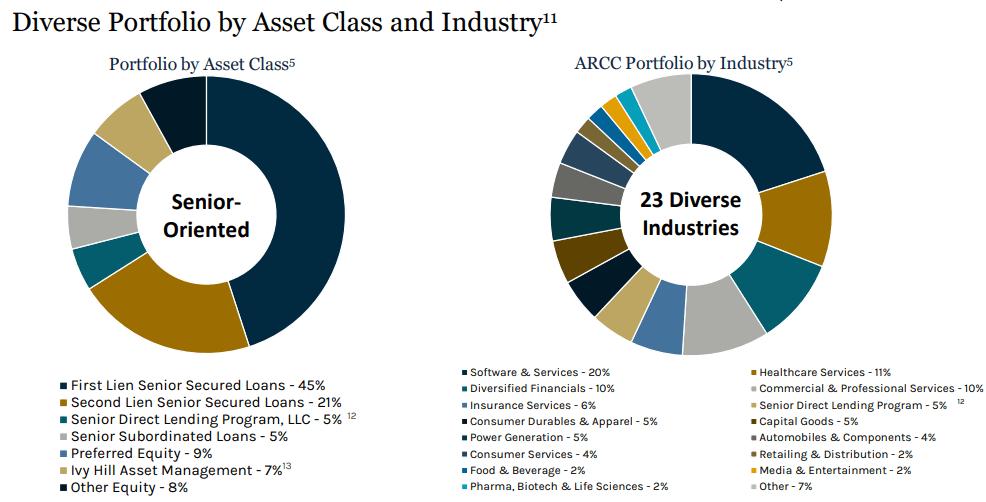
As can be seen above, ARCC focuses on loans, with these accounting for 84% of the company’s portfolio. Most of these loans, upwards of 70%, are senior secured loans, almost all of which are variable rate loans. Meaning, the company’s loan portfolio sees higher rates when interest rates are rising, as they currently are. Equity accounts for 8% of the company’s portfolio, with preferred shares accounting for the remaining 9%. Concentration is quite low, with the company investing in dozens of industries, hundreds of issues, and with no position accounting for more than 1% of the company’s portfolio. ARCC’s portfolio is relatively high-yielding, with a weighted average yield of 8.7%, due to the company’s focus on smaller, riskier issuers.
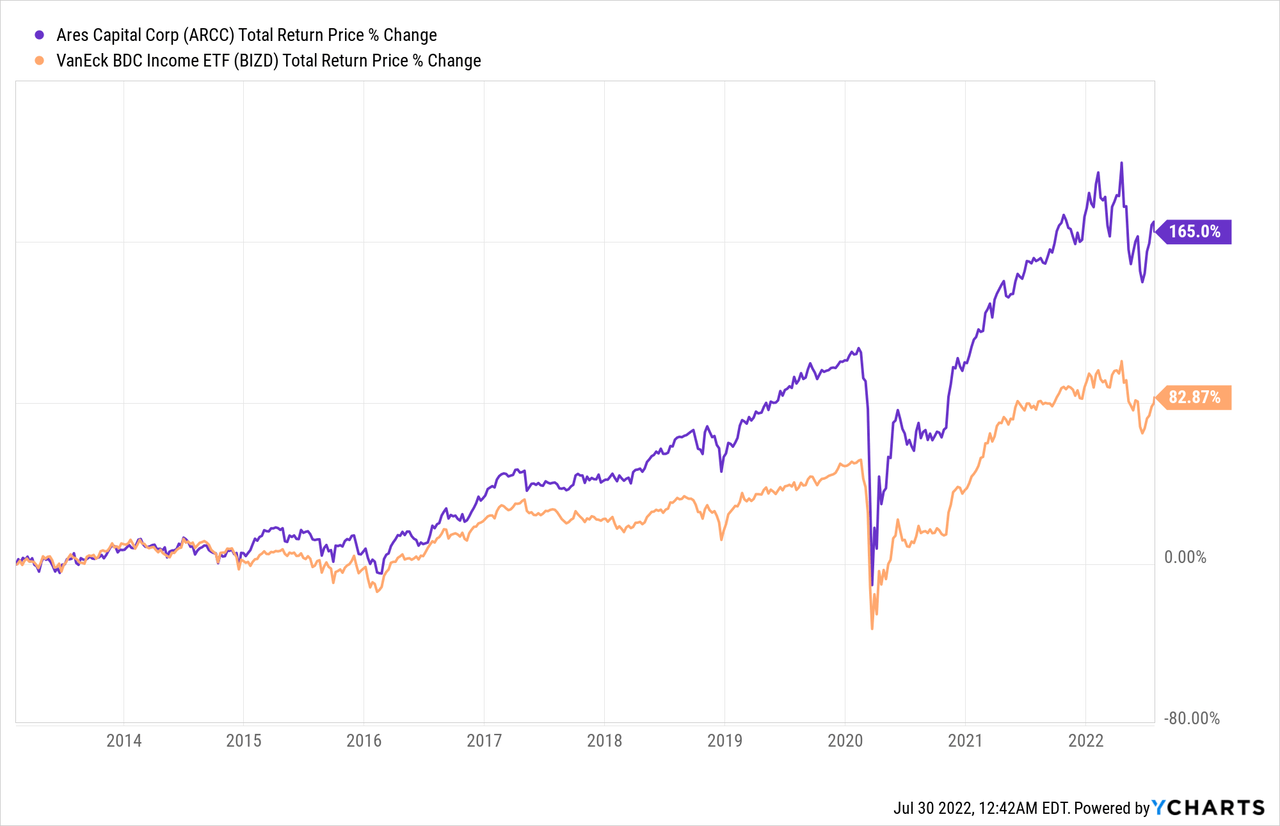
ARCC is broadly representative of the fund’s underlying holdings. BIZD holdings focus on senior secured / variable rate loans, with smaller investments in equities. BIZD holdings tend to have diversified portfolios, with low concentration. Yields tend to be high, but credit quality is comparatively low. On the other hand, ARCC is somewhat better managed than its peers, as evidenced by the company’s industry-beating returns.
BIZD itself tracks the MVIS US Business Development Companies Index, a broad-based market-cap index of U.S. BDCs. It is a simple index, investing in all applicable companies subject to a basic set of industry, revenue source, liquidity, size, and other assorted criteria. BDCs are a relatively niche industry, which results in a relatively concentrated fund, with below-average diversification. BIZD invests in just 25 different holdings, with the top ten of these accounting for 75% of the value of the fund. These are as follows.
BIZD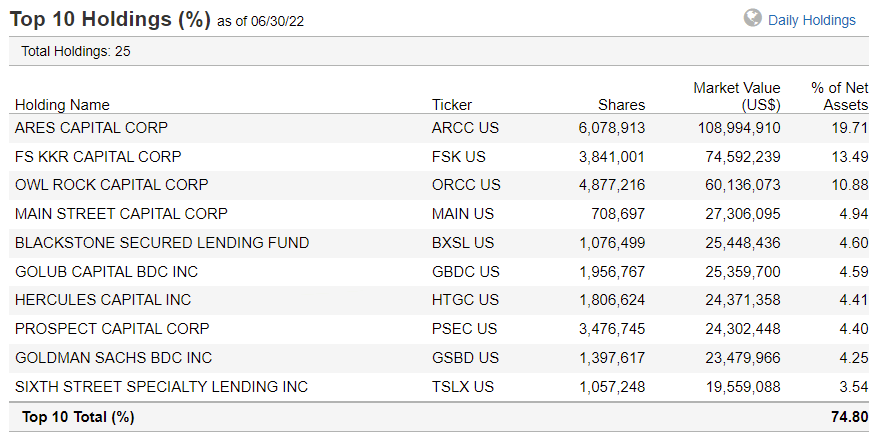
Diversification is somewhat low, especially considering the significant positive correlation between the fund’s underlying holdings. Concentration and lack of diversification increase risk and volatility, and expose the fund and its investors to the possibility of significant under and over-performance. This is generally not the case for more diversified equity index funds. BIZD is a relatively risky investment, definitely riskier than average. As such, position sizes should be kept relatively small too, in my opinion at least.
BIZD’s expenses are somewhat different than average, and the source of a lot of confusion for many investors. For regulatory reasons, BDCs and BDC funds must include their operational expenses, meaning salaries and the like, when calculating expense ratios. This serves to balloon reported expense ratios, with BIZD itself sporting a massive 10.1% expense ratio. Although said expense ratio is accurate, it is not comparable to that of most funds, nor is it particularly material to investors. BIZD also reports a management fee, which measures the actual expenses charged by the fund to shareholders, and currently stands at 0.40%. Said management fee is comparable to the expense ratio reported by most other funds, and much more material to shareholders.
BIZD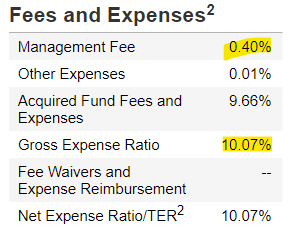
BIZD – Investment Thesis
BIZD’s investment thesis is quite simple, and centers on the fund’s strong, growing 9.2% yield, and its cheap valuation. Let’s have a look at each of these two points.
Strong, Growing 9.2% Yield
BIZD’s underlying holdings focus on loans to relatively small, risky issuers. These loans tend to carry high interest rates, which leads to significant income for the fund, and significant dividends for its investors. BIZD itself yields 9.2%, an incredibly strong yield, and significantly higher than most asset classes, including equities and bonds.
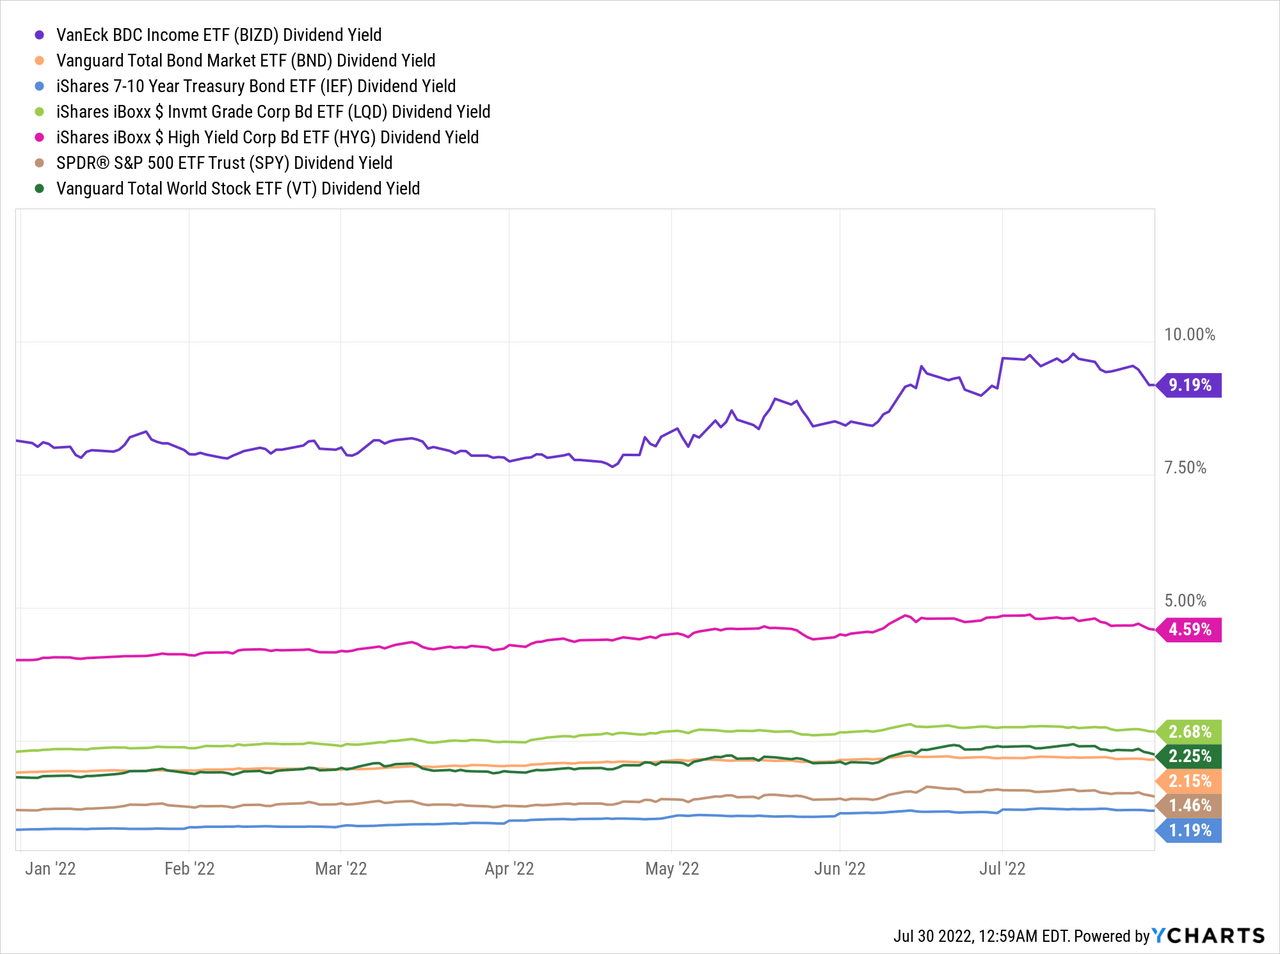
BIZD’s yield will also likely see some growth in the coming months, as the Federal Reserve is hiking rates, which should lead to higher interest rates on BDC loans, ultimately resulting in higher income for the fund and higher dividends for shareholders. As should be clear from the description, this is a relatively long, fraught process, so growth should be uneven, and might take months to materialize, but should materialize.
Some of BIZD’s underlying holdings have already reported higher interest rates on their loan portfolios due to rising interest rates. As an example, ARCC’s management mentioned in their latest earnings call that yields on their loan portfolio have increased 0.60% in the latest quarter, due to rising rates. Higher interest rates on ARCC’s loan portfolio should ultimately increase ARCC’s earnings, leading to higher dividends, leading to higher income for BIZD, leading to higher dividends for BIZD and its shareholders.
BIZD’s dividends have already seen some growth, with the fund hiking its quarterly dividend by more than 17% this past quarter. Annualize the latest quarterly dividend, and you get a 10.2% yield, a whole percentage point higher than the fund’s current TTM dividend yield. ETF dividends tend to be volatile, so I wouldn’t put too much importance on a single quarterly dividend payment, but the situation seems broadly positive.
BIZD’s strong, growing 9.2% yield is a significant benefit for the fund and its shareholders, and the fund’s core investment thesis.
Cheap Valuation
BIZD is currently trading with a relatively cheap valuation. The fund sports a PE ratio of 6.4x, and a PB ratio of 1.0x, both significantly lower than that of most broad-based equity indexes, as well as financial industry indexes. It is an incredibly cheap valuation, although the fund does tend to trade with lower multiples than its peers.
Fund Filings – Chart by author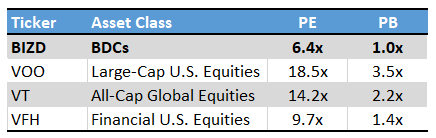
BIZD’s cheap valuation could lead to some capital gains for shareholders if valuations were to normalize, a benefit for the same. As valuations are not significantly below their historical averages, the potential for significant gains is reduced, but some gains are still possible.
BIZD – Looking Back
I wanted to have a quick look at my previous article on BIZD. In that article, I was neutral about the fund, due to concerns about valuations and yield. Since then, fund fundamentals have materially improved, as dividends and yields have risen, prospective dividend growth has increased, while valuations have softened. Improved fundamentals have made me reassess the situation, hence the change in rating.
As an aside, the neutral rating was (mostly) the wrong call, as most equity indexes have suffered moderate losses since, while BIZD is flattish. Was not expecting an equity bear market, hence BIZD’s outperformance.
BIZD Previous Article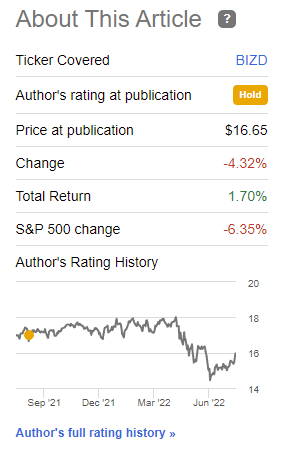
Conclusion
BIZD’s strong, growing 9.2% yield and cheap valuation make the fund a buy.
Be the first to comment