

sankai
By Mark Barnes, PhD, and Christine Haggerty, Global Investment Research
While still a source of outperformance this year, the global rotation into Value struggled for traction in Q3, thwarted by a summer rally in long-time laggard Quality.
As highlighted in our latest Equity Factor Insights report, in most markets, Value performed modestly worse than the broad-market benchmarks in the global Q3 rout, while Quality did modestly better.
Regional Value returns relative to benchmarks (LC, rebased)
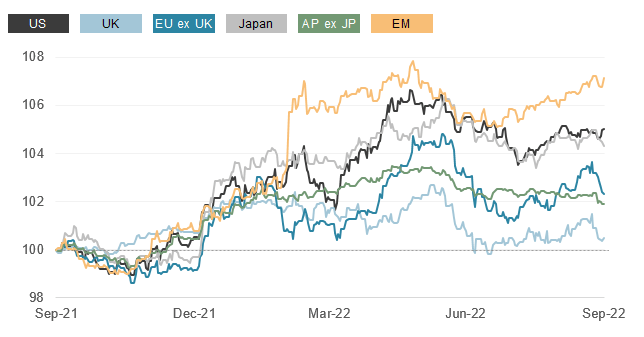
Source: FTSE Russell. Data as of September 30, 2022. Past performance is no guarantee to future results. Please see the end for important disclosures.
This performance was a striking about-face from the trends prevailing in the previous quarters, as illustrated below by the relative factor returns averaged across the six regions we analyzed. Despite recent setbacks, Value, Yield and Low Vol have retained their 12-month leadership.
Factor returns relative to benchmark (LC %) – Average across regions*
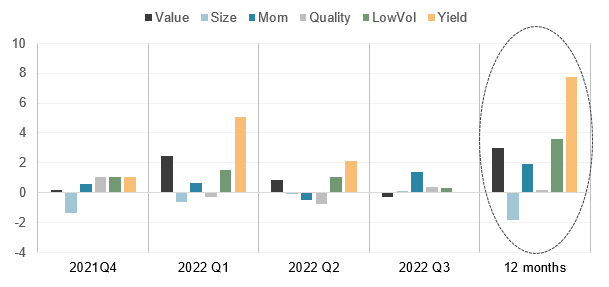
Source: FTSE Russell.*Combined average of factor performance across FTSE USA, FTSE UK, FTSE Europe ex UK, FTSE Japan, FTSE Developed Asia Pacific ex Japan and FTSE Emerging indexes. Data as of September 30, 2022. Past performance is no guarantee of future results. Please see the end for important legal disclosures.
Interest rates drive the action
Both Value and Quality have been hostage to the extreme shifts in interest-rate expectations over the past several months.
Bond yields eased in the early months of the quarter amid investor hopes that rapidly deteriorating economic indicators would prompt an earlier end to central bank tightening policies. The pullback paved the way for a strong relief rally in growth stocks, which dominate the Quality factor.
But those hopes and the Quality rebound were soon quashed as central banks, led by the US Fed, remained steadfast in their anti-inflation efforts, fueling a renewed surge in bond yields and a brutal equity-market selloff in September. Nonetheless, Quality maintained a modest lead in most markets for the quarter as a whole.
US Treasury bond yields (%)
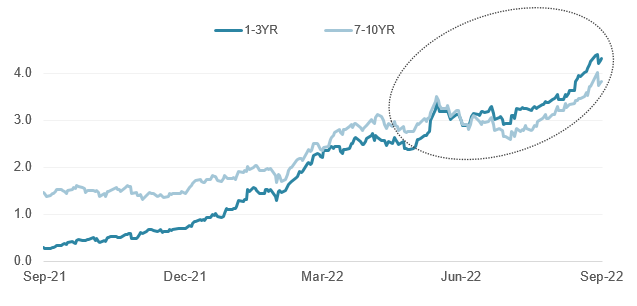
Source: FTSE Russell / Refinitiv. Data through September 30, 2022. Past performance is no guarantee of future results. Please see the end for important legal disclosures.
The recent back-and-forth between Value and Quality reflects their compositional differences and the differing ways they typically respond to macroeconomic shifts.
Growth-dominant Quality typically suffers in rising-rate environments. That is because the factor’s main constituents tend to be valued largely on their earnings prospects far into the future. When rates rise, the present value of those future earnings declines.
By contrast, Value stocks are more weighted to Financials and to cyclically sensitive stocks valued on their more immediate earnings streams and, thus, tend to perform better than Quality in rising-rate environments, particularly those resulting from improving economic and profit outlooks.
But that is not what has been happening this year. The surge in bond yields this year has come largely in reaction to persistently high inflation and the increasingly aggressive central bank efforts to tame it. Increases in short-dated US Treasury bond yields have outpaced those of long-dated equivalents since June, causing the yield curve to become deeply inverted.
US Treasury yield spreads (%)
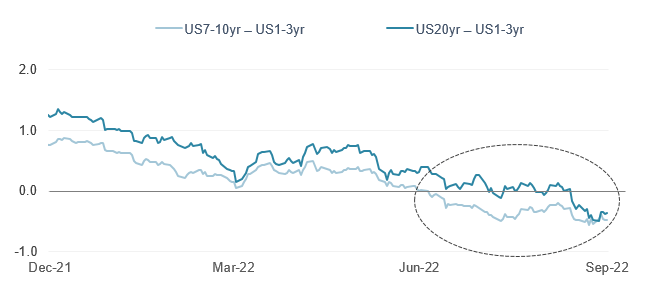
Source: FTSE Russell / Refinitiv. Data through September 30, 2022. Past performance is no guarantee of future results. Please see the end for important legal disclosures.
Yield curve inversion – a game-changer for Value
The steady flattening of the US yield curve this year has been a headwind for Value, which has long been positively correlated to shifts in the slope of the US yield curve in most equity markets and has grown even more so recently. An inverted yield curve is a classic market signal of an impending recession and of deep investor pessimism − hardly a backdrop conducive to risk-taking in general and bargain-hunting in particular.
24-month correlations of Value returns to shifts in the slope of the US Treasury yield curve (10yr − 2yr)
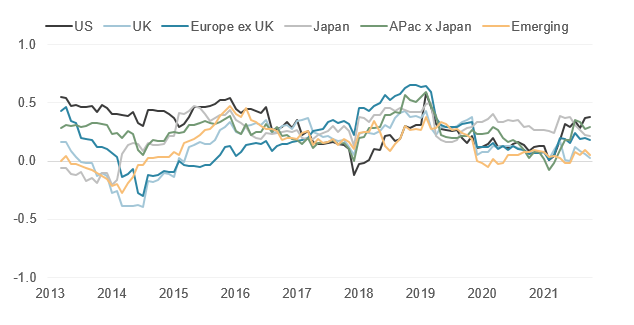
Source: FTSE Russell / Refinitiv. Data through September 30, 2022. Past performance is no guarantee of future results. Please see the end for important legal disclosures.
This analysis is particularly relevant to the performances of Financial stocks. Much of the perceived benefits of rising rates for these firms, particularly banks, assume a positive sloping yield curve, as these institutions borrow money at lower short-term rates and lend at higher long-term rates. But an inverted yield curve turns that profit equation on its head, diminishing the typically favorable impact of rising rates on Financial stock returns and, thus, on Value generally.
© 2022 London Stock Exchange Group plc and its applicable group undertakings (the “LSE Group”). The LSE Group includes (1) FTSE International Limited (“FTSE”), (2) Frank Russell Company (“Russell”), (3) FTSE Global Debt Capital Markets Inc. and FTSE Global Debt Capital Markets Limited (together, “FTSE Canada”), (4) FTSE Fixed Income Europe Limited (“FTSE FI Europe”), (5) FTSE Fixed Income LLC (“FTSE FI”), (6) The Yield Book Inc (“YB”) and (7) Beyond Ratings S.A.S. (“BR”). All rights reserved.
FTSE Russell® is a trading name of FTSE, Russell, FTSE Canada, FTSE FI, FTSE FI Europe, YB and BR. “FTSE®”, “Russell®”, “FTSE Russell®”, “FTSE4Good®”, “ICB®”, “The Yield Book®”, “Beyond Ratings®” and all other trademarks and service marks used herein (whether registered or unregistered) are trademarks and/or service marks owned or licensed by the applicable member of the LSE Group or their respective licensors and are owned, or used under licence, by FTSE, Russell, FTSE Canada, FTSE FI, FTSE FI Europe, YB or BR. FTSE International Limited is authorised and regulated by the Financial Conduct Authority as a benchmark administrator.
All information is provided for information purposes only. All information and data contained in this publication is obtained by the LSE Group, from sources believed by it to be accurate and reliable. Because of the possibility of human and mechanical error as well as other factors, however, such information and data is provided “as is” without warranty of any kind. No member of the LSE Group nor their respective directors, officers, employees, partners or licensors make any claim, prediction, warranty or representation whatsoever, expressly or impliedly, either as to the accuracy, timeliness, completeness, merchantability of any information or of results to be obtained from the use of FTSE Russell products, including but not limited to indexes, data and analytics, or the fitness or suitability of the FTSE Russell products for any particular purpose to which they might be put. Any representation of historical data accessible through FTSE Russell products is provided for information purposes only and is not a reliable indicator of future performance.
No responsibility or liability can be accepted by any member of the LSE Group nor their respective directors, officers, employees, partners or licensors for (a) any loss or damage in whole or in part caused by, resulting from, or relating to any error (negligent or otherwise) or other circumstance involved in procuring, collecting, compiling, interpreting, analysing, editing, transcribing, transmitting, communicating or delivering any such information or data or from use of this document or links to this document or (b) any direct, indirect, special, consequential or incidental damages whatsoever, even if any member of the LSE Group is advised in advance of the possibility of such damages, resulting from the use of, or inability to use, such information.
No member of the LSE Group nor their respective directors, officers, employees, partners or licensors provide investment advice and nothing in this document should be taken as constituting financial or investment advice. No member of the LSE Group nor their respective directors, officers, employees, partners or licensors make any representation regarding the advisability of investing in any asset or whether such investment creates any legal or compliance risks for the investor. A decision to invest in any such asset should not be made in reliance on any information herein. Indexes cannot be invested in directly. Inclusion of an asset in an index is not a recommendation to buy, sell or hold that asset nor confirmation that any particular investor may lawfully buy, sell or hold the asset or an index containing the asset. The general information contained in this publication should not be acted upon without obtaining specific legal, tax, and investment advice from a licensed professional.
Past performance is no guarantee of future results. Charts and graphs are provided for illustrative purposes only. Index returns shown may not represent the results of the actual trading of investable assets. Certain returns shown may reflect back-tested performance. All performance presented prior to the index inception date is back-tested performance. Back-tested performance is not actual performance, but is hypothetical. The back-test calculations are based on the same methodology that was in effect when the index was officially launched. However, back-tested data may reflect the application of the index methodology with the benefit of hindsight, and the historic calculations of an index may change from month to month based on revisions to the underlying economic data used in the calculation of the index.
This document may contain forward-looking assessments. These are based upon a number of assumptions concerning future conditions that ultimately may prove to be inaccurate. Such forward-looking assessments are subject to risks and uncertainties and may be affected by various factors that may cause actual results to differ materially. No member of the LSE Group nor their licensors assume any duty to and do not undertake to update forward-looking assessments.
No part of this information may be reproduced, stored in a retrieval system or transmitted in any form or by any means, electronic, mechanical, photocopying, recording or otherwise, without prior written permission of the applicable member of the LSE Group. Use and distribution of the LSE Group data requires a licence from FTSE, Russell, FTSE Canada, FTSE FI, FTSE FI Europe, YB, BR and/or their respective licensors.
Editor’s Note: The summary bullets for this article were chosen by Seeking Alpha editors.
Be the first to comment