

In highly volatile times like today, many investors are looking to maintain an equity allocation while reducing risk. Typically, this involves selecting stocks that have minimum volatility.
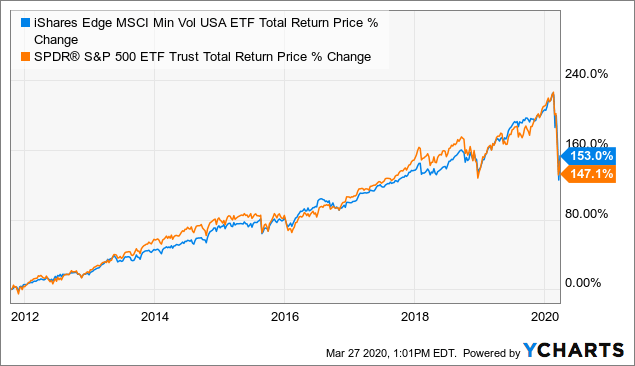
One popular ETF that is widely believed to be a “lower risk S&P 500” is the iShares Edge MSCI Min Vol USA ETF (USMV). USMV generally selects stocks with low volatility in order to create a less-volatile portfolio. However, it may come as a surprise that USMV actually performed essentially the same as the “more volatile” S&P 500 during the recent crash:
Now, we can see that USMV bounced a bit higher than SPY, but the crash in USMV may have come as a bit of a surprise given it is usually far less volatile:
 Data by YCharts
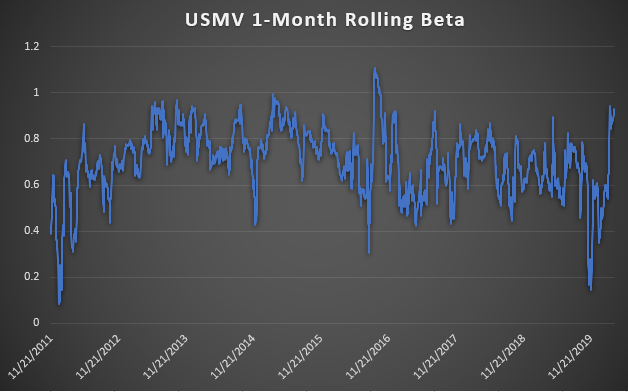
As you can see, while both funds generally have the same performance, USMV is much more linear and less volatile than SPY. In fact, USMV boasts only having a 0.65 beta to the S&P 500, but that figure tends to rise toward 1 during shocks. This means that normally a 1% move in the S&P 500 equates to a 0.65% move in USMV, but it rises to one exactly when investors want to avoid volatility. Take a look at USMV’s rolling one-month beta to the S&P 500:
 (Data – Yahoo Finance)
As you can see, its beta has spiked over recent weeks as the market has declined. We can also see a considerable spike in November 2016 which is perhaps due to election-related volatility. That said, USMV did maintain a low beta during the 2018 equity correction which resulted in its outperformance.
My core point remains, USMV does little to protect against downside risk in the markets. During small corrections, USMV tends to outperform but underperform thereafter, resulting in a generally similar performance to the S&P 500. However, during large economic shocks like today’s, the correlations in USMV’s components rise and the fund falls essentially just as much as the S&P 500. In other words, it only hides its volatility but carries the same risk.
That does not necessarily mean that USMV is a poor investment. To determine that, we must look to its fundamentals.
USMV Fundamental Risk Vs. The S&P 500
Studies show that fundamentals are a better indicator of true cash flow risk than statistical price action. From what I can tell, USMV’s methodology focuses primarily on selecting low-volatility stocks with less emphasis on fundamental factors.
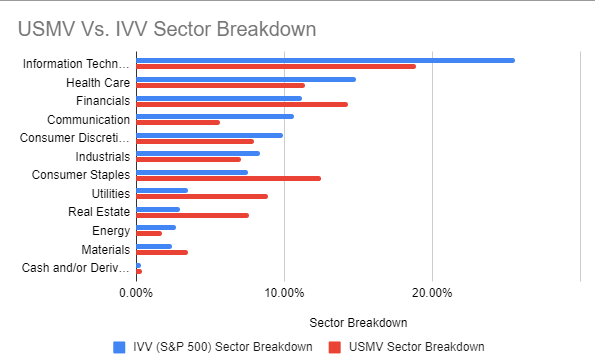
USMV does hold industries that typically carry less cyclical exposure. This includes Consumer Staples and Utilities as opposed to cyclical sectors like Energy and Materials. This is shown below compared to the iShares Core S&P 500 ETF (IVV):
(iShares)
As you can see, USMV has significantly greater holdings in the Consumer Staples, Utilities, and Real Estate sectors than does the S&P 500. Interestingly, it also carries greater exposure to Financials. Overall, this makes USMV more interest-rate sensitive than the S&P 500.
This also gives USMV a higher valuation than S&P 500 funds like IVV or SPY. USMV currently has a weighted-average P/E ratio of 19X while IVV’s is 17X. That said, USMV does have a marginally higher dividend yield of 2.1% compared to IVV at 1.9% because of USMV’s higher weighting toward dividend-paying sectors.
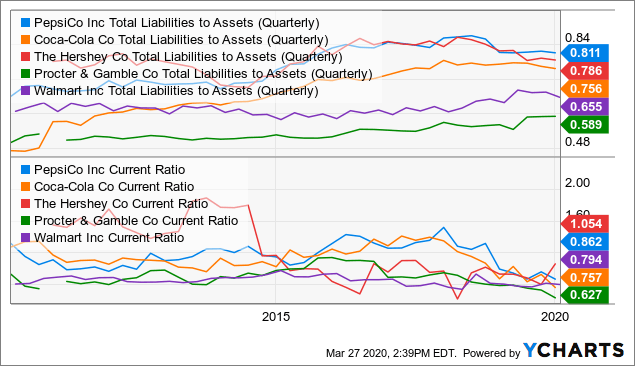
Now, the risk fundamental of many of USMV’s holdings is not stellar. To create an accurate picture of the fund, I’ll go over the fundamentals of the top holdings of each of its largest sectors. Let’s begin with consumer staples with Pepsi (PEP), Coca-Cola (KO), Hershey (HSY), Proctor & Gamble (PG), and Walmart (WMT).
Note, financial debt-to-EBITDA is generally more popular today than “old-school” total liabilities-to-assets, but it should be noted that “stock-to-flow” type metrics are generally poorer default predictors since EBITDA drops during recessions.
As you can see, each of these companies has seen its total liabilities-to-assets rise over the past decade:
 Data by YCharts
Balance sheet leverage has declined lately for most, but at the expense of much lower current assets as seen by current ratios. In fact, 4/5 of these companies have negative working capital which can prove dangerous in times like today with poor liquidity financing conditions.
We see an alarmingly similar trend in USMV’s top utility holdings like NextEra (NEE), Consolidated Edison (ED), Southern (SO), Xcel Energy (XEL), and Duke (DUK):
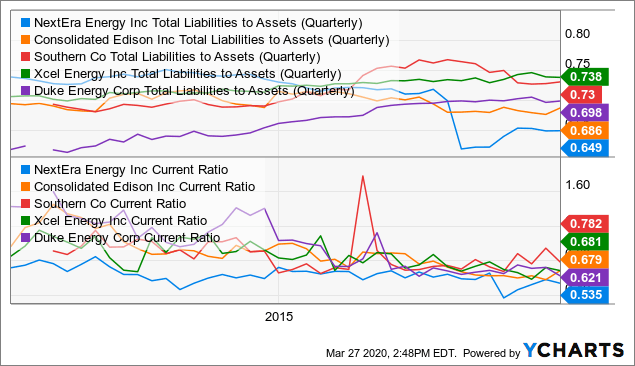 Data by YCharts
Utilities are generally prized as low-risk companies as demand for energy always exists. That said, it seems many of these companies have backed themselves into a financing corner as they have high leverage and low cash-on-hand. It is generally OK to run a current ratio below 1 as refinancing is usually available, but if cash across the financial system dries up (as is happening today), companies will be forced to borrow at much higher rates to the expense of income (and thus dividends).
Since technology stocks are generally less capital intensive than the previous two, let’s stick with valuation as our key fundamental data. Technology is the largest component in USMV, though it has less technology exposure than does the S&P 500. As you can see below, the EV/EBITDA valuation ratios of the top ten technology firms in USMV have all generally doubled (or more) over the past decade:
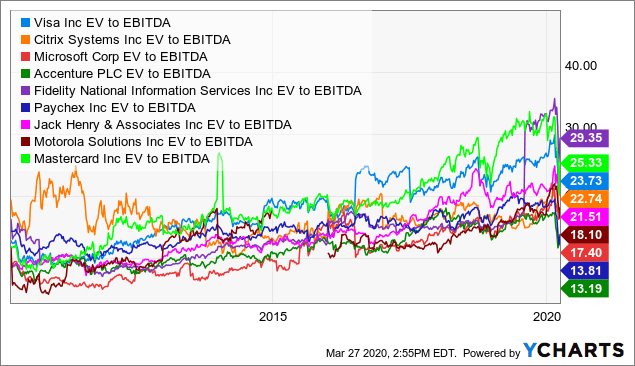 Data by YCharts
Without a doubt, technology is the most exuberantly valued sector in the U.S. While most of these companies have had decent growth over the past decade, they have had far more stock price growth than economic growth. This has resulted in extremely high valuations with most of these top-ten having EV/EBITDA ratios around 20X. 10-15X is considered more normal and implies, even after the sell-off, most technology companies remain overvalued.
In a similar, but slightly less extreme, vein we have USMV’s healthcare stocks which are also running higher-than-normal valuations:
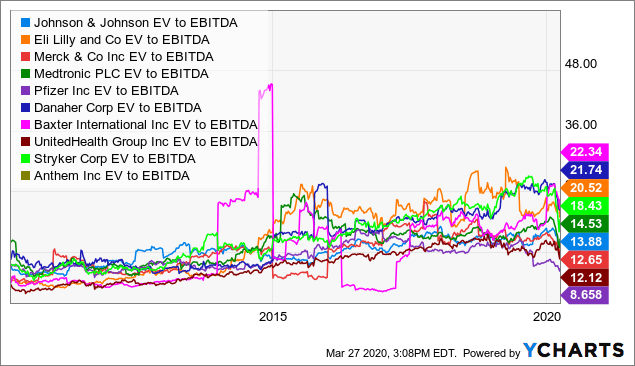 Data by YCharts
As you can see, the vast majority of USMV’s largest 10 healthcare companies are running historically rich EV/EBITDA valuations with the median being around 14X. Obviously, this is less worrisome than seen in technology, but the consistent uptrend in valuations is concerning, particularly considering the increase in regulatory risk.
The Bottom Line
Overall, we can see that, in reality, USMV is not a low-risk ETF. Granted, it probably has marginally less risk than the S&P 500 and may outperform by a point during a double-digit crash. Still, my primary concern is that USMV’s volatility is suppressed until investors need low volatility. As we recently saw, its beta rose to around 1 as the S&P 500 fell, causing USMV to decline essentially just as much as the S&P 500.
Further, while USMV’s sector exposure is generally less cyclical, accounting and valuation metrics suggest that the companies it owns carry quite a bit of risk. The more capital intensive companies like those in utilities or consumer staples have high leverage and negative working capital while the less capital intensive ones have valuations generally twice their normal level. Similar findings are likely in S&P 500 ETFs, but this goes to show that USMV focuses on the appearance of low volatility as opposed to materially lower risk.
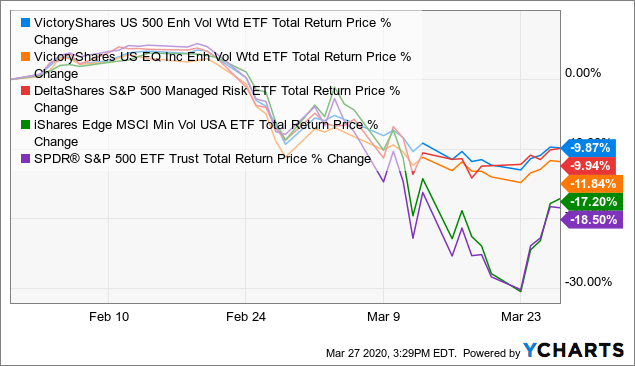
Of course, I do not want to leave investors empty-handed so I screened for the U.S. equity stocks that performed best during the recent sell-off. This brought me to an interesting group called “Managed Risk” ETFs that decrease equity exposure during times of high volatility and vice versa, resulting in lower drawdowns. There are three that popped up on my radar:
- VictoryShares US 500 Enhanced Volatility Wtd ETF – (CFO)
- VictoryShares US EQ Income Enhanced Volatility Wtd ETF – (CDC)
- DeltaShares S&P 500 Managed Risk ETF – (DMRL)
As you can see below, each of these three ETFs outperformed considerably during the sell-off and experienced a much less substantial increase in volatility:
 Data by YCharts
Overall, I believe that investors looking for low-risk equity exposure should look to those three funds rather than minimum volatility ETFs like USMV.
Interested In My More-Exclusive Research?
My fellow contributor BOOX research and I run the Core-Satellite Dossier here on Seeking Alpha. The marketplace service provides an array of in-depth portfolios designed using the academically-backed Core-Satellite approach. This involves creating a base long-term portfolio (the core) and generating alpha using unique well-researched tactical trades (the satellite).

As an added benefit, we’re allowing each new member one exclusive pick where they can have us provide in-depth research on any company or ETF they’d like. You can learn about what we can do for you here.
Disclosure: I/we have no positions in any stocks mentioned, and no plans to initiate any positions within the next 72 hours. I wrote this article myself, and it expresses my own opinions. I am not receiving compensation for it (other than from Seeking Alpha). I have no business relationship with any company whose stock is mentioned in this article.
Be the first to comment