

The Dollar has turned back higher, with the DXY starting to march back towards the March high at 102.99. As we have been discussing this week, the wild swings since February are likely to soon give-way to a tradeable trend.
The Euro, which is accounts for a hefty 57% of the DXY index, is trading around the trend-line running up from 2000 when looking at the EUR/USD since it came into existence, but goes back to the early 1980s when accounting for the constituents that make up the Euro. A break of 10637 could have momentum taking the Euro sharply lower.
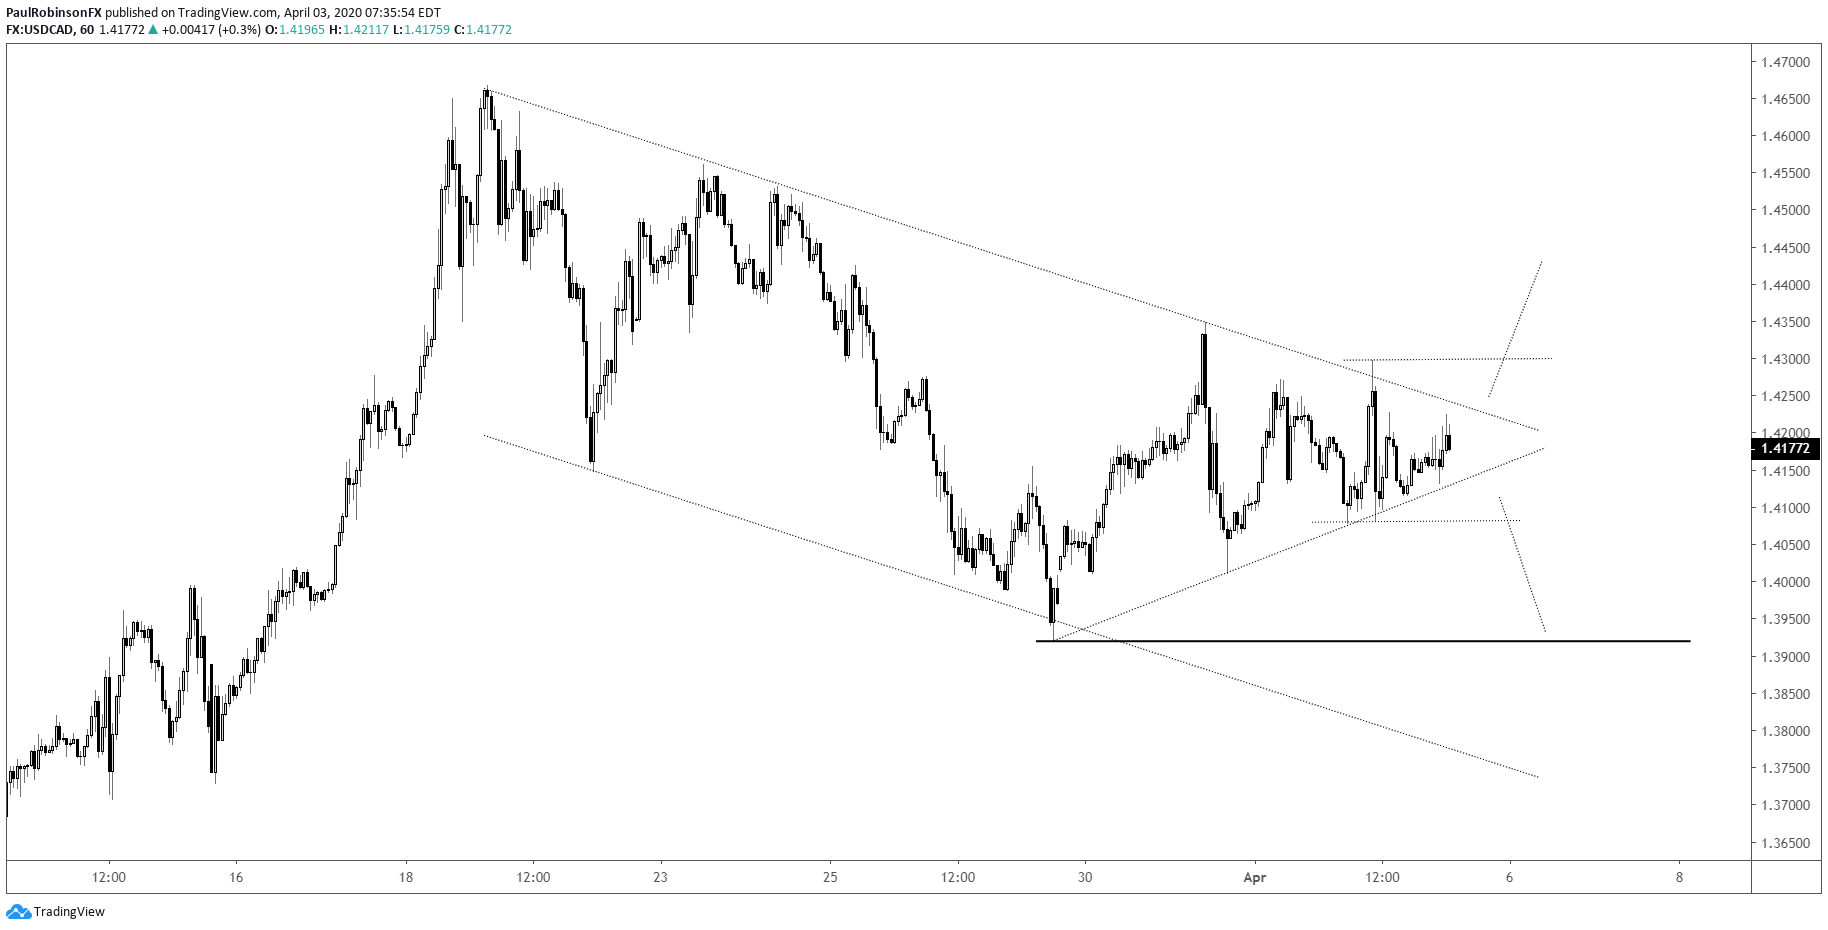
USD/CAD looks like it could hold steady to higher as long as it maintains 13920. The hourly chart shows a triangle developing that could have price either breaking higher in-line with the trend since the beginning of the year, or testing the 13920-support level. This should resolve itself quite soon given the proximity of the pattern to the apex.

Recommended by Paul Robinson
Start correcting trading mistakes today.
USD/CAD hourly chart
For the full discussion check out the video above.
Resources for Index & Commodity Traders
Whether you are a new or an experienced trader, DailyFX has several resources available to help you; indicator for tracking trader sentiment, quarterly trading forecasts, analytical and educational webinars held daily, and trading guides to help you improve trading performance.
We also have a series of guides for those looking to trade specific markets, such as the S&P 500, Dow, DAX, gold, silver, crude oil, and copper.
—Written by Paul Robinson, Market Analyst
You can follow Paul on Twitter at @PaulRobinsonFX
Be the first to comment