

US Dollar Price and Chart Analysis
Recommended by Nick Cawley
Get Your Free JPY Forecast
The Japanese Yen is back in the headlines again as it slumps further against the US dollar. The pair are now testing the 145.90 level, and a break higher would see USD/JPY trade at levels not seen since August 1998. The Bank of Japan last intervened in the FX market on September 22, when USDJPY was trading around 145.70, buying approximately $21 billion of Yen to stabilize the currency. The Japanese central bank’s action drove the USD/JPY back down to around 140.00 before the market decided to test the BoJ again and pushed the pair back higher. The Japanese Yen has been weakening against a robust US dollar ever since.
Bank of Japan (BoJ) – Foreign Exchange Market Intervention
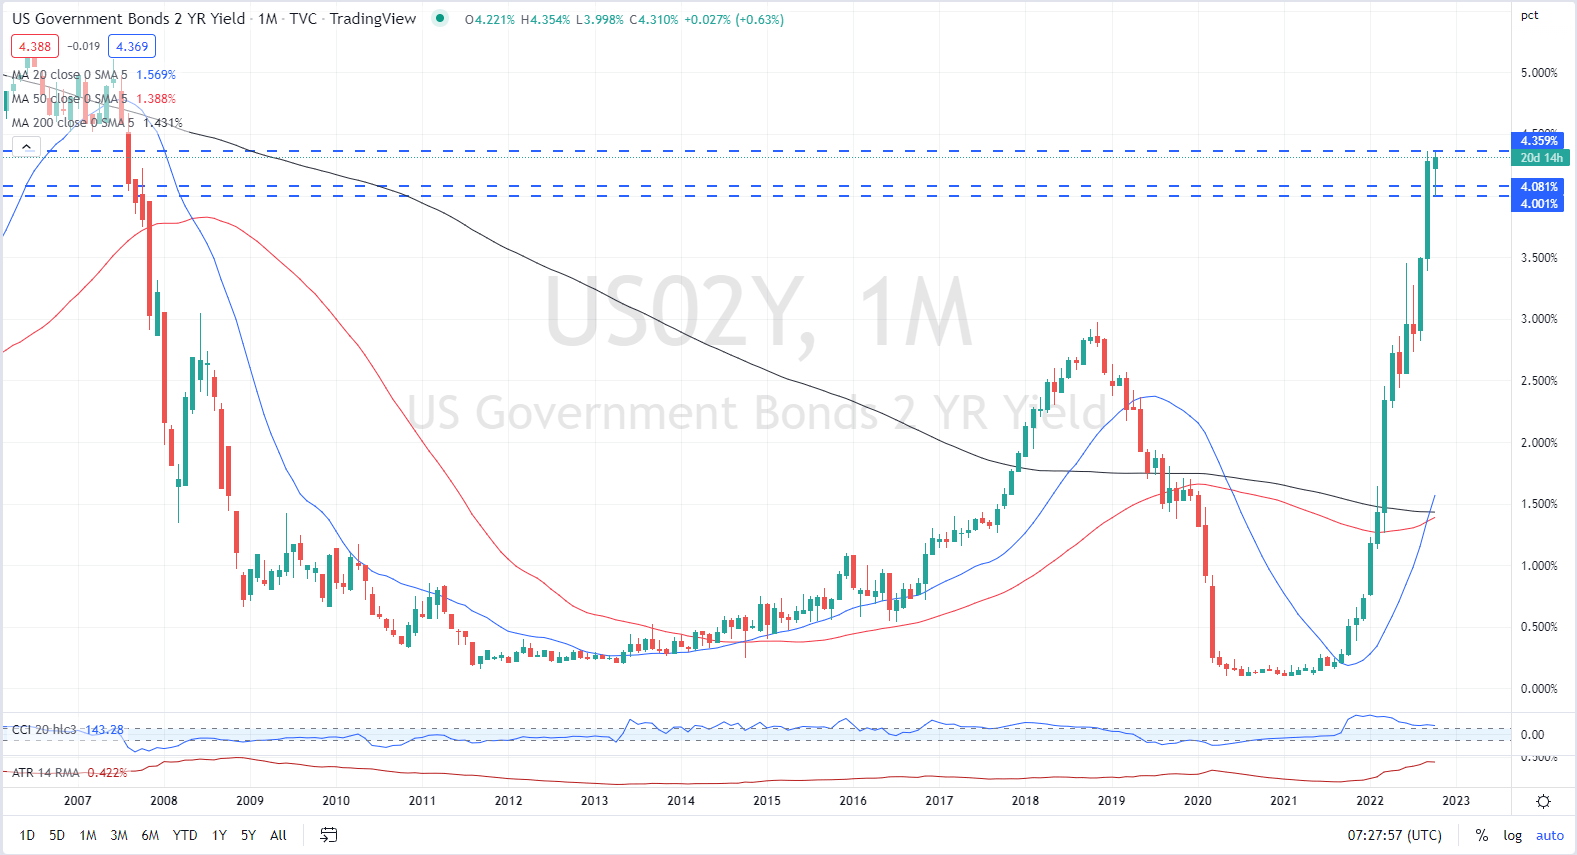
US Treasury yields, a driver of US dollar strength, continue to move higher on expectations that the Federal Reserve will carry on hiking US rates aggressively. The UST 2-year is currently trading with a yield of 4.36%, a level last seen in August 2007.
US Treasury 2-Year Yield Monthly Chart October 11, 2022
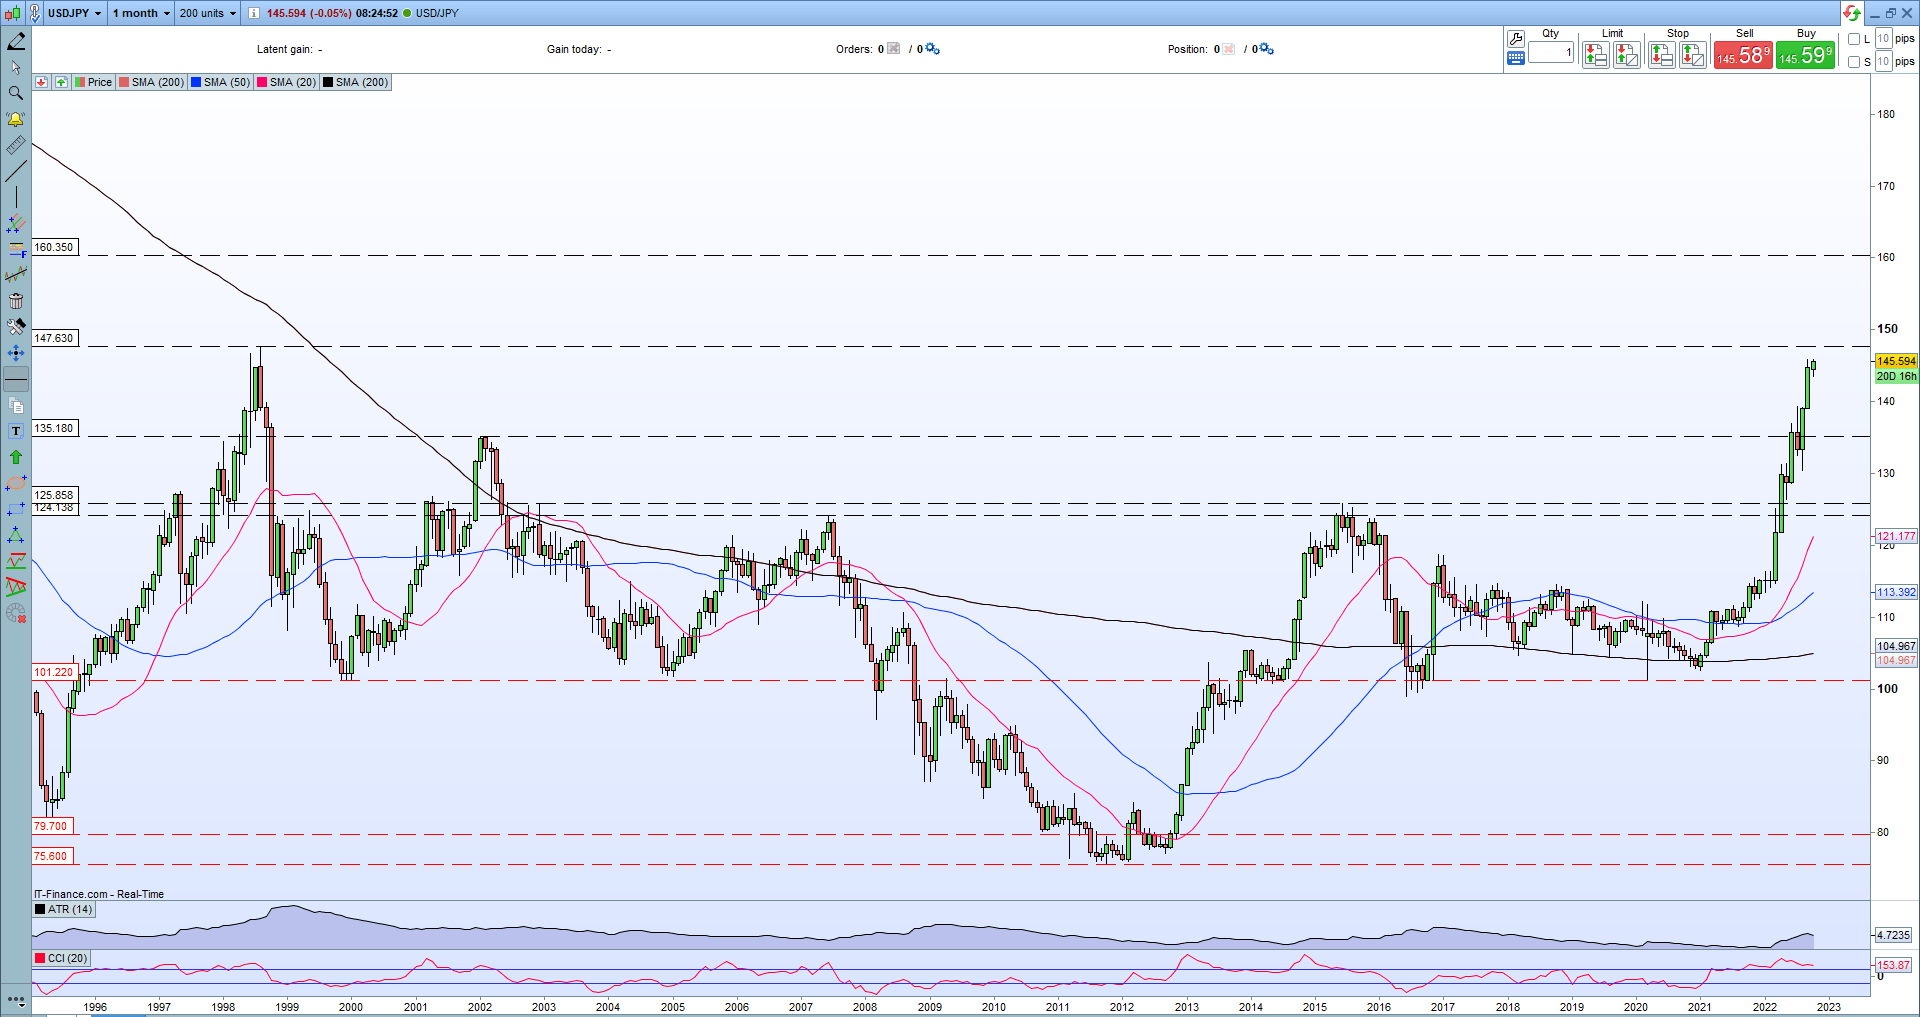
If the Bank of Japan decides to stand back from the FX market at these levels, USD/JPY can easily move to test the August 1998 high at 147.63. If this level is broken, finding resistance from charts going back over two decades becomes difficult with only the 150 ‘big figure’ level sticking out. The Japanese Yen has depreciated over 25% against the dollar this year and US authorities will be keen to see this depreciation halt to prevent Japan from getting too much of a trade advantage due to its weak currency. It may well be that we are nearing the USD/JPY high.
USD/JPY Daily Price Chart – October 11, 2022
For all market-moving data releases and economic events see the real-time DailyFX Calendar.
Retail trader data show that 20.64% of traders are net-long with the ratio of traders short to long at 3.85 to 1.The number of traders net-long is 10.57% higher than yesterday and 7.21% higher from last week, while the number of traders net-short is 6.16% higher than yesterday and 10.81% higher from last week.
We typically take a contrarian view to crowd sentiment, and the fact traders are net-short suggests that USD/JPY prices may continue to rise. Positioning is less net-short than yesterday but more net-short from last week. The combination of current sentiment and recent changes gives us a further mixed USD/JPY trading bias.
| Change in | Longs | Shorts | OI |
| Daily | 7% | 4% | 5% |
| Weekly | 15% | 8% | 9% |
What is your view on the USD/JPY – bullish or bearish?? You can let us know via the form at the end of this piece or you can contact the author via Twitter @nickcawley1.
Be the first to comment