

Swiss Franc Technical Forecast – Talking Points
- USD/CHF may see bearish pressure build after SMA crossover
- EUR/CHF returns to former triangle support and 100-day SMA
- CHF/JPY’s recent run higher threatened by bearish RSI divergence
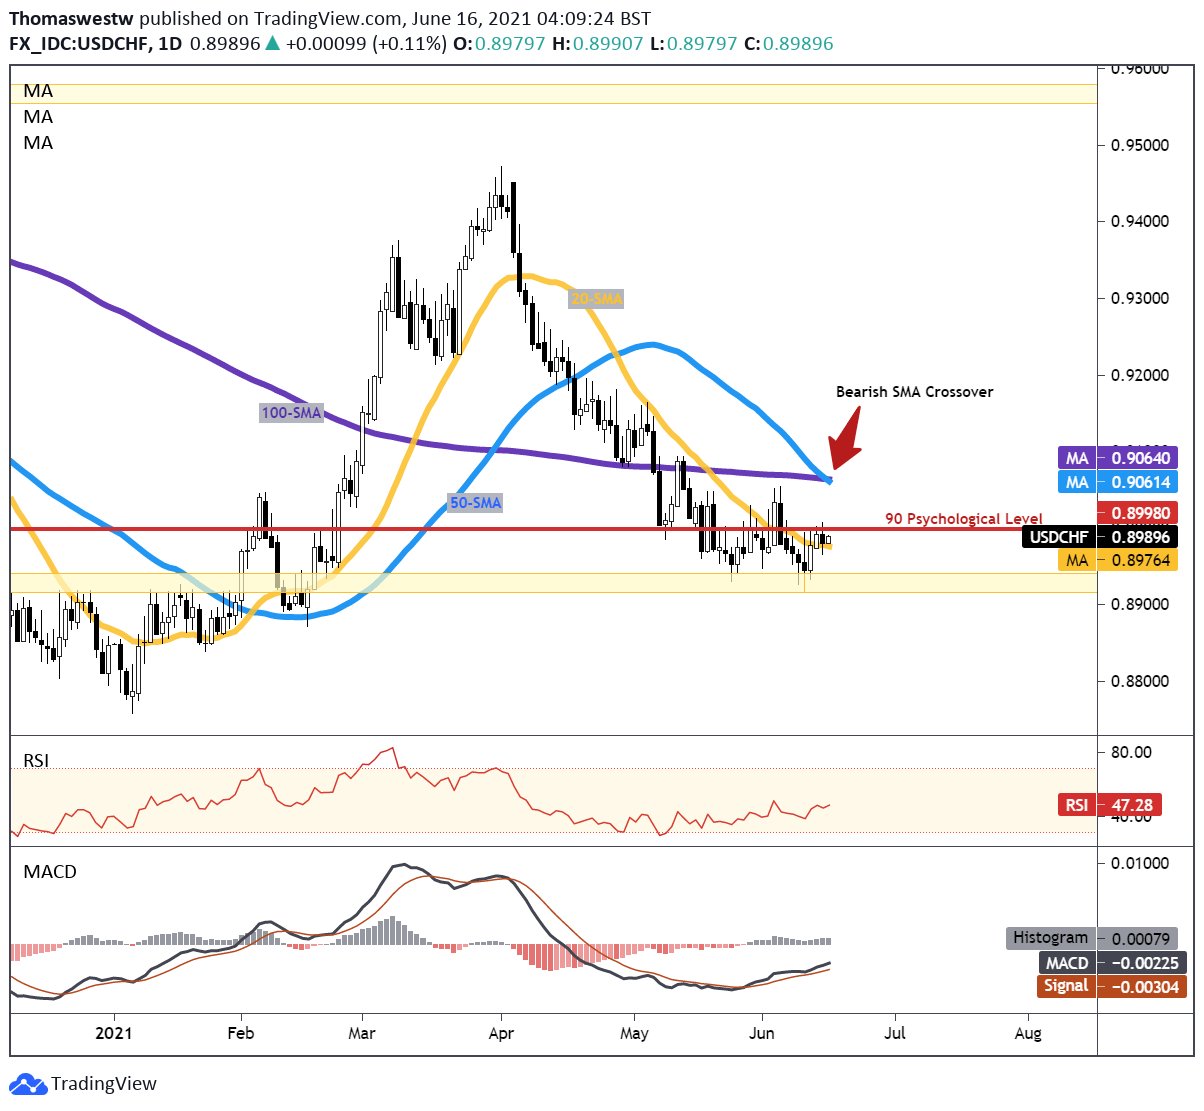
USD/CHF Technical Forecast
The Swiss Franc appears ready to continue appreciating against the US Dollar after a bearish technical crossover between the 50-day and 100-day Simple Moving Averages (SMA) occurred in USD/CHF this week. The currency pair has been on the move lower since its April multi-month swing high. Since then, USD/CHF has fallen just over 5% and currently sits just above the 20-day SMA.
While the SMA crossover puts a bearish spin on technical sentiment, a short-term move higher isn’t off the cards given the rising MACD and Relative Strength Index (RSI). However, the psychologically imposing 0.90 level appears to be offering a degree of resistance against price recently. Overall, the path lower appears to be the most likely outcome given the technical landscape.
USD/CHF Daily Chart
Chart created with TradingView
EUR/CHF Technical Forecast
The Swiss Franc has made progress against the Euro in recent months, with EUR/CHF down over 2% from the March swing high. The drop has eaten all gains seen from an Ascending Triangle breakout that occurred in February. The triangle’s rising support level appears to have stepped back in to underpin prices.
Moreover, the 100-day SMA (purple line) appears to be offering a degree of confluent support, with prices recently bouncing off the moving average. Short-term momentum still appears negative, however, with the 50-day SMA (blue line) turning lower. A break below the 100-day moving average would likely see an extended selloff occur.
EUR/CHF Daily Chart
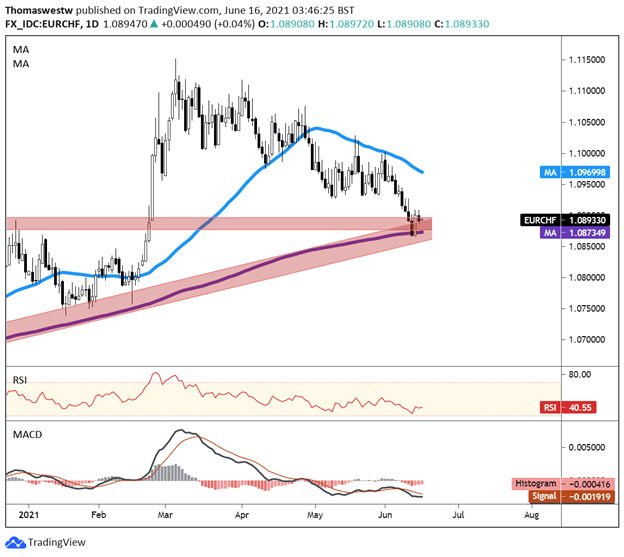
Chart created with TradingView
CHF/JPY Technical Forecast
The Swiss Franc has been on a tear against the Japanese Yen since earlier this year when the currency pair broke out from a Descending Triangle. However, the recent swing highs have been accompanied by negative divergences from both the Relative Strength Index and MACD oscillators. That indicates a possible weakening in upside pressure.
That said, the pair may stall out in the near future. Downside protection may be offered by the 20-day SMA (yellow line), which has recently stepped in to underpin price. A break lower may see a shift in direction, possibly reversing some or all of the past months’ gains. The 38.2% and 61.8% Fibonacci retracement levels offer possible support zones if that scenario plays out.
CHF/JPY Daily Chart

Chart created with TradingView
Swiss Franc TRADING RESOURCES
— Written by Thomas Westwater, Analyst for DailyFX.com
To contact Thomas, use the comments section below or @FxWestwateron Twitter
Be the first to comment