Canadian Dollar Talking Points
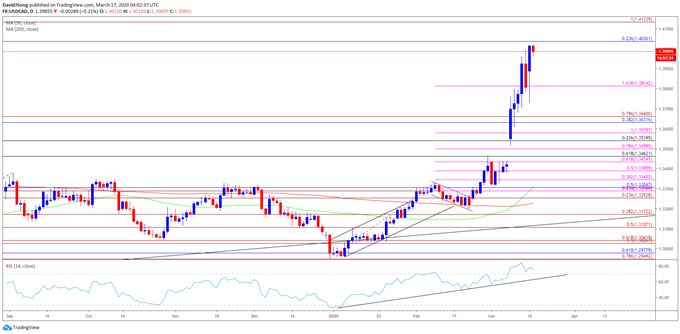
USD/CAD gives back the advance following the emergency Federal Reserve rate cut, and the exchange rate may face a larger pullback over the coming days as price appears to be deviating with the Relative Strength Index (RSI).
USD/CAD Rate Outlook Mired by RSI Divergence
USD/CAD pulls back from a fresh yearly high (1.4019) even though the Bank of Canada (BoC) plans to support the Canada Mortgage Bond (CMB) market, with the central bank targeting “purchases of up to $500 million per week.”
The BoC states that the “operations will be conducted twice weekly and will continue for as long as market conditions warrant,” and the central bank may take additional steps to insulate the Canadian economy as “the first quarter of 2020 will be weaker than the Bank had expected.”
In turn, Governor Stephen Poloz and Co. may deliver another rate cut at the next meeting on April 15 as the “Governing Council stands ready to adjust monetary policy further if required,” and the central bank may come under pressure to deploy unconventional tools as the benchmark interest rate approaches the record-low of 0.25%.
It remains to be seen if the BoC will implement a zero-interest rate policy (ZIRP) along with non-standard measures to combat the coronavirus as Canada closes its borders, but the Canadian Dollar may face a more bearish fate as there appears to be a shift in USD/CAD behavior, with the exchange rate trading at its highest level since 2016.
In turn, USD/CAD may continue to extend the advance from the 2020 low (1.2957) as a bull flag formation unfolds, but the exchange rate appears to be deviating with the Relative Strength Index (RSI) as the oscillator fails to clear the high from earlier this month.


Recommended by David Song
Forex for Beginners
Sign up and join DailyFX Currency Strategist David Song LIVE for an opportunity to discuss potential trade setups.
USD/CAD Rate Daily Chart
Source: Trading View
- Keep in mind, the near-term strength in USD/CAD emerged following the failed attempt to break/close belowthe Fibonacci overlap around 1.2950 (78.6% expansion) to 1.2980 (61.8% retracement), with the yearly opening range highlighting a similar dynamic as the exchange rate failed to test the 2019 low (1.2952) during the first full week of January.
- There appears to be shift in USD/CAD behavior as the exchange rate breaks out of the range from the fourth quarter of 2019 and clears the October high (1.3383), with the Relative Strength Index (RSI) highlighting a similar dynamic as the oscillator continues to track the upward trend from earlier this year.
- A break/close above 1.4040 (23.6% retracement) opens up the 1.4130 (100% expansion) region, but the RSI appears to be diverging with the exchange rate as the oscillator fails to clear the high from earlier this month even though USD/CAD climbs to a fresh yearly high (1.4019).
- In turn, a textbook RSI sell-signal may emerge over the coming days if the indicator falls back from overbought territory and slips below 70.


Recommended by David Song
Traits of Successful Traders
— Written by David Song, Currency Strategist
Follow me on Twitter at @DavidJSong


Be the first to comment