

Nasdaq (US Tech 100) News and Analysis
- US Q2 earnings season kicks off with the large banks before big tech later this month
- Key Nasdaq technical levels considered ahead of the earnings reports
US Earnings Season (Q2) Kicks off with the Banks Before Big Tech
This week Thursday and Friday we have Q2 earnings reports of the big banks with the likes of JP Morgan and Morgan Stanley on Thursday and Citigroup and Wells Fargo on Friday. Earnings season this time around has split opinion with some forecasting positive figures while other researchers, like Factset, reduced earnings growth rates for the wider S&P Index to 4.3%, marking the lowest figure since the last quarter of 2020.
Large US Tech Earnings Announcements Appear Towards the End of July
|
Date |
19 July |
20 July |
26 July |
26 July |
27 July |
28 July |
28 July |
4 Aug |
|
Stock |
Netflix |
Tesla |
Alphabet (Google) |
Microsoft |
Meta |
Apple |
Intel |
Amazon |
|
*Timing |
AMC |
AMC |
AMC |
AMC |
AMC |
AMC |
AMC |
E |
*PMO = Pre Market Open, AMC = After Market Close, E = Estimated/unconfirmed
Risk appetite has waned in the last few days as concerns around new Chinese lockdowns emerged once more as the government continues its Covid-zero policy. The IMF added to the seemingly somber mood by cutting its US growth forecast to 2.3% from 2.9% in June, stoking recession fears and boosting the US dollar. Fears that aggressive interest rate hikes will dampen economic activity has gained momentum but the resilient labor market continues to tell a different story. It must be noted that the labor market is usually one of the last indicators to turn, nevertheless the Fed are expected to hike interest rate by another 75 basis points later this month. Higher interest rates result in lower equity valuations as future cash flows are discounted at a larger rate, which may see stocks on the back foot for some time to come unless major earnings surprise to the upside.
Key Nasdaq Technical Levels ahead of Earnings Season
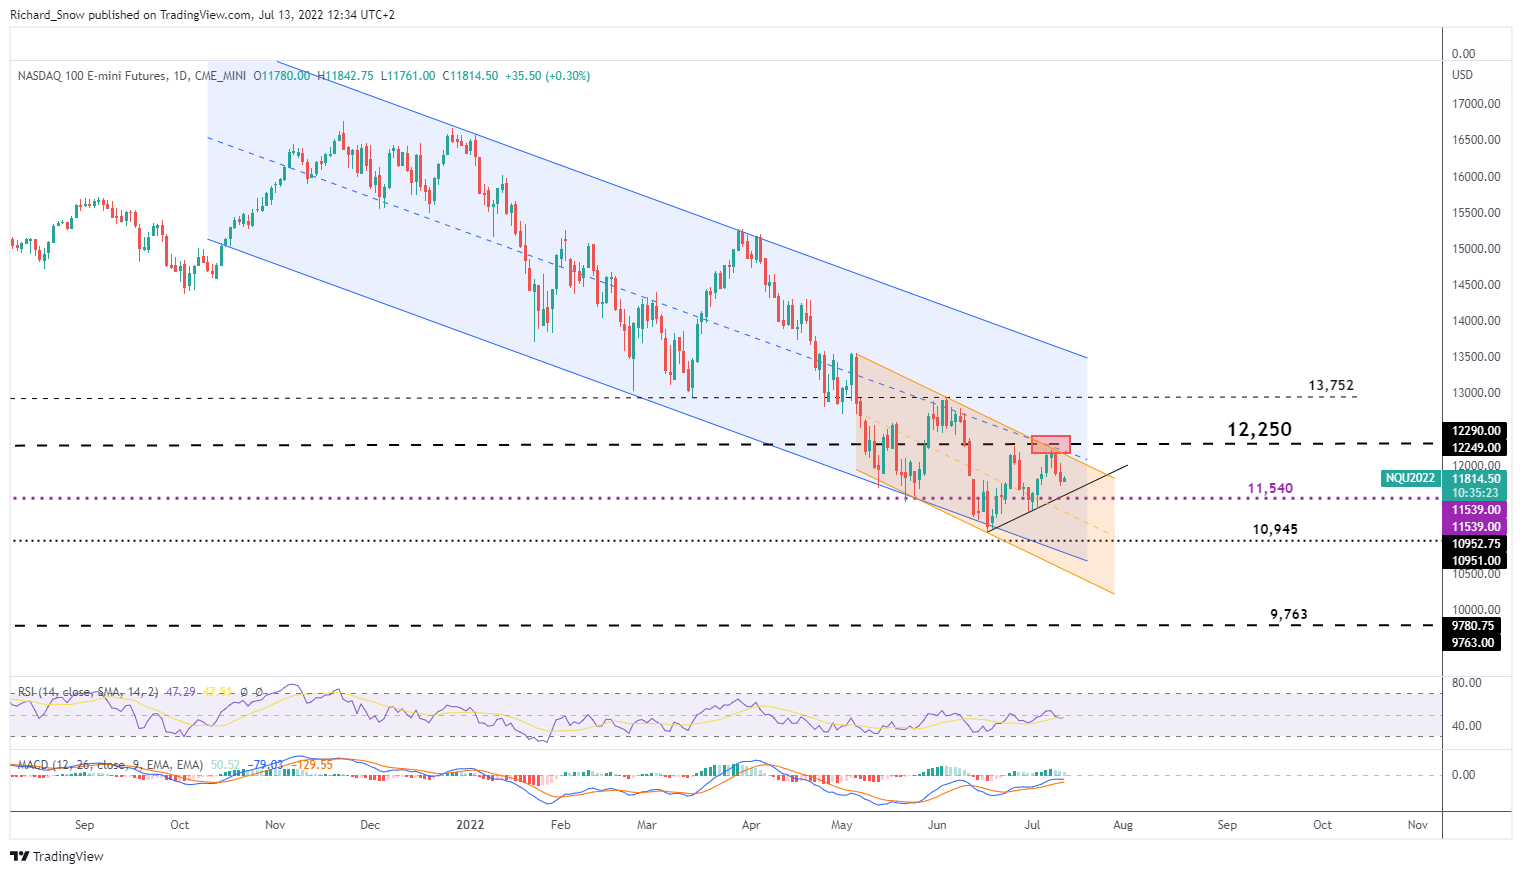
Nasdaq technical continue to track sways in risk sentiment as price action bounced lower off a rather well-defined zone of resistance at 12,250. This area comprises of the 12,250 level – which acted as a pivot point in 2020 and 2021 – as well as the upper bound of the shorter-term descending channel (orange) and finally, the mid-line of the longer-term descending channel (blue).
It marks the second time that price action was unable to trade and hold above 12,259, adding to the bearish narrative. Thus far bullish impulses have not lasted long at all and a break below the ascending trendline and move below 11,540 could signal another drop towards the recent low of 11,070. The appearance of an evening star at that crucial 12,250 zone adds to the bearish outlook.
US Tech 100 Daily Chart
Source: TradingView, prepared by Richard Snow
— Written by Richard Snow for DailyFX.com
Contact and follow Richard on Twitter: @RichardSnowFX
Be the first to comment