

Mexican Peso Technical Price Outlook: USD/MXN Trade Levels
- Mexican Peso updated technical trade levels – Weekly & Daily Charts
- USD/MXN breakout fails at record intraday highs
- Immediate long-bias at risk below uptrend resistance / 2017 high
The Mexican Peso has collapsed vs the US Dollar with a major breakout in USD/MXN taking price into three-year highs. The advance faltered today just pips above a key resistance range before pulling back and while the broader outlook remains tilted to the topside, the immediate advance may be vulnerable while below this threshold . These are the updated targets and invalidation levels that matter on the USD/MXN weekly price chart. Review my latest Strategy Webinar for an in-depth breakdown the setupswe’re tracking this week.
Starts in:
Live now:
Mar 10
( 02:03 GMT )
Live Weekly Strategy Webinars on Mondays at 12:30GMT
AUD/USD Trading Preparation for the Week Ahead
Mexican Peso Price Chart – USD/MXN Weekly
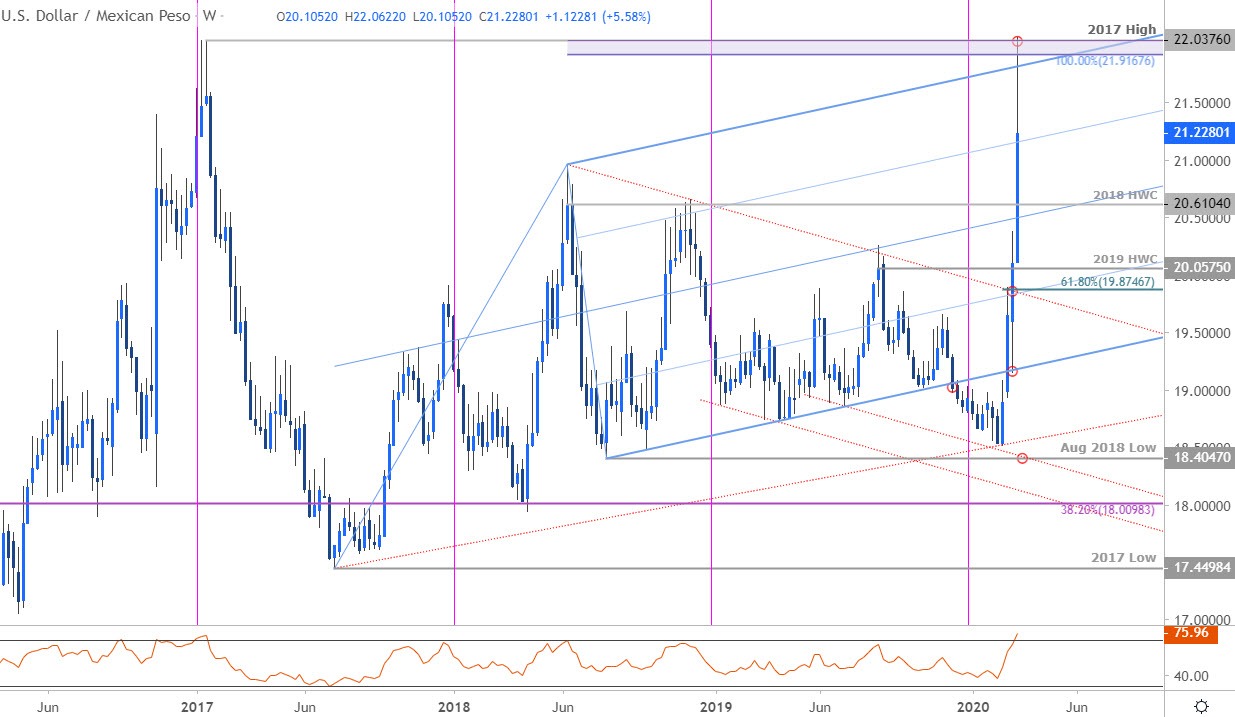
Chart Prepared by Michael Boutros, Technical Strategist; USD/MXN on Tradingview
Notes: In my last Mexican Peso Price Outlook we noted that USD/MXN was, “broad consolidation formation since the start of the year and we’re looking for a reaction here- from a trading standpoint, the immediate focus is on a breakout of the January range for guidance..” A topside breach of the yearly opening-range highs into the close of February fueled a rally of more than 19% off the yearly lows.
The advance failed today on this last stretch at a key resistance threshold at 21.9167–22.0376 – a region defined by the 2017 high and the 100% extension of the 2017 advance. Note that the upper parallel of an ascending pitchfork formation comes in just lower and although price saw an intraweek breach, the focus remains on the weekly close in relation to 75% parallel of this slope for guidance.
Initial weekly support now seen at the 2018 high week close at 20.6104 backed by 20.0575. Broader bullish invalidation now raised to the 61.8% retracement of the yearly range at 19.8747.

Recommended by mich
Download Our Latest Quarterly US Dollar Price Forecasts!
Bottom line: The peso price sell-off has responded to a key technical confluence and the immediate USD/MXN rally may be vulnerable IF prices closes below up-slope resistance. From a trading standpoint, a good spot to reduce long-exposure / raise protective stops – be on the lookout for possible downside exhaustion on a test of the median-line for guidance. Ultimately, a larger peso recovery may offer more favorable entries closer to up-trend support. I’ll publish an updated Mexican Peso Price Outlook once we get further clarity on the near-term USD/MXN technical trade levels.
For a complete breakdown of Michael’s trading strategy, review his Foundations of Technical Analysis series on Building a Trading Strategy
—
Key US / Mexico Data Releases

Economic Calendar – latest economic developments and upcoming event risk.
Previous Weekly Technical Charts
— Written by Michael Boutros, Technical Strategist with DailyFX
Follow Michael on Twitter @MBForex
Be the first to comment