

US Dollar (DXY) Daily Price and Analysis
The multi-month US dollar rally continues in early trade with the greenback racking up impressive gains against a wide range of currencies. While the US dollar has been primarily supported over the recent months by rising interest rate expectations and government bond yields, today’s move higher is being helped by a risk-off move into the greenback as global equity markets continue to crumble.
With the FOMC meeting on May 4, there is a Fed blackout period this week with no commentary from any of the Fed board members, in complete contrast to the last couple of weeks when hawkish Fed commentary hit the screens every day. There will also be renewed focus on the US equity market with a wide range of heavyweight companies releasing their Q1 results over the next few days. Equity indices continue to fall today with many breaking noted support levels.
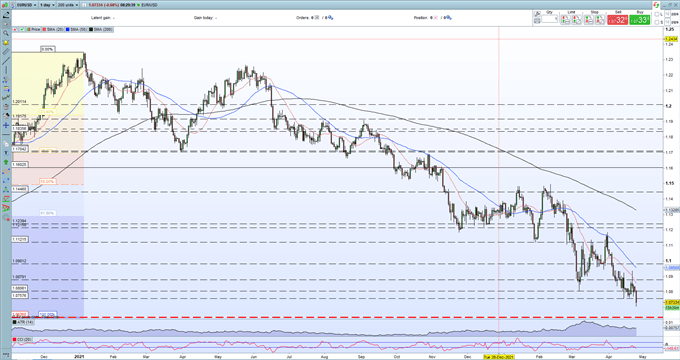
The Euro is falling further against the US dollar and is close to giving back all of the 17 big-figure rally seen between March 2020 and January 2021. The next level of support for the pair sits at 1.0636 and this may hold in the short term, especially as Euro interest rate expectations continue to grow. While the ECB is still behind the Fed, any indication that the European Central Bank will tighten monetary conditions further will help stem any move lower, at least in the short term.
EUR/USD Daily Price Chart – April 25, 2022
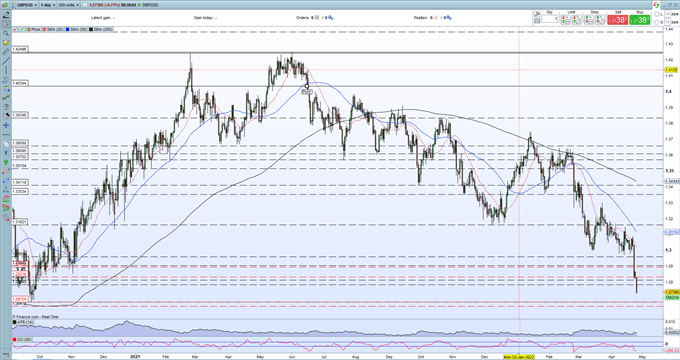
The British Pound is also under pressure against the US dollar with the pair down by three big figures since last Friday. While the US dollar is behind a majority of this move, ongoing ‘partygate’ problems for PM Boris Johnson and weak economic data last week will not have helped the British Pound.Cable now trades below 1.2750 and is closing in on the September 2020 swing low at 1.2675.
GBPUSD Daily Price Chart – April 25, 2022
Retail trader data show 82.09% of traders are net-long with the ratio of traders long to short at 4.58 to 1. The number of traders net-long is 2.01% lower than yesterday and 19.04% higher from last week, while the number of traders net-short is 5.54% higher than yesterday and 29.91% lower from last week.
We typically take a contrarian view to crowd sentiment, and the fact traders are net-long suggests GBP/USD prices may continue to fall. Positioning is less net-long than yesterday but more net-long from last week. The combination of current sentiment and recent changes gives us a further mixed GBP/USD trading bias.
What is your view on the US Dollar – bullish or bearish?? You can let us know via the form at the end of this piece or you can contact the author via Twitter @nickcawley1.
Be the first to comment