

US Dollar Price, Chart, and Analysis
- US 10-year bond yields are back above 1.55%.
- Surging oil and gas prices fuel inflation worries.
The ongoing surge in oil and gas prices continues to roll over into the US dollar space with US Treasury yields jumping sharply as markets continue to price in higher inflation expectations in the weeks and months ahead. The ongoing supply-demand mismatch in the energy market has seen both oil and natural gas cash and futures hit multi-year highs prompting fears of slower growth and higher consumer prices.
Surging US Crude Oil Price Adds to Downward Pressure on Stocks, Bonds and Gold Price
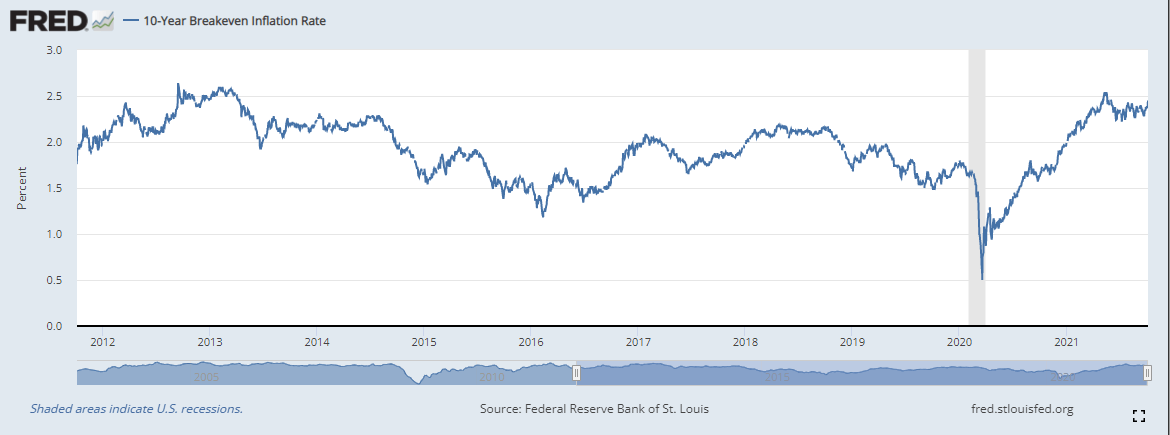
One measure of US inflation expectations, the 10-Year Breakeven Inflation Rate, is now trading around 2.45%, the highest level since May this year and just a few basis points away from highs last seen in late 2012/early 2013.
10-Year US Breakeven Inflation Rate
The ongoing surge in US Treasury yields – the 10-year nominal is now quoted at 1.55% – is pushing the greenback higher with the US dollar basket (DXY) within touching distance of levels last seen in September 2020. In addition to heightened inflation fears, the latest US Jobs Report is released on Friday, with expectations that the Fed will finally announce a formal timetable for scaling back its bond-buying program. The Federal Reserve’s dual mandate of price stability and maximum sustainable employment will likely force the Fed to start tightening monetary policy if Friday’s NFP number – released at 13:30 BST – is close to market expectations of 473k new jobs created. While US rate hikes are not expected until 2024, slowing down and closing the QE program over the next few months will rein in liquidity and push US Treasury yields higher. The impact of the recent surge in oil and gas prices on growth may not be enough to derail the Fed from finally announcing a bond tapering timetable.
Keep up to date with all market-moving data releases and events by using the DailyFX Calendar
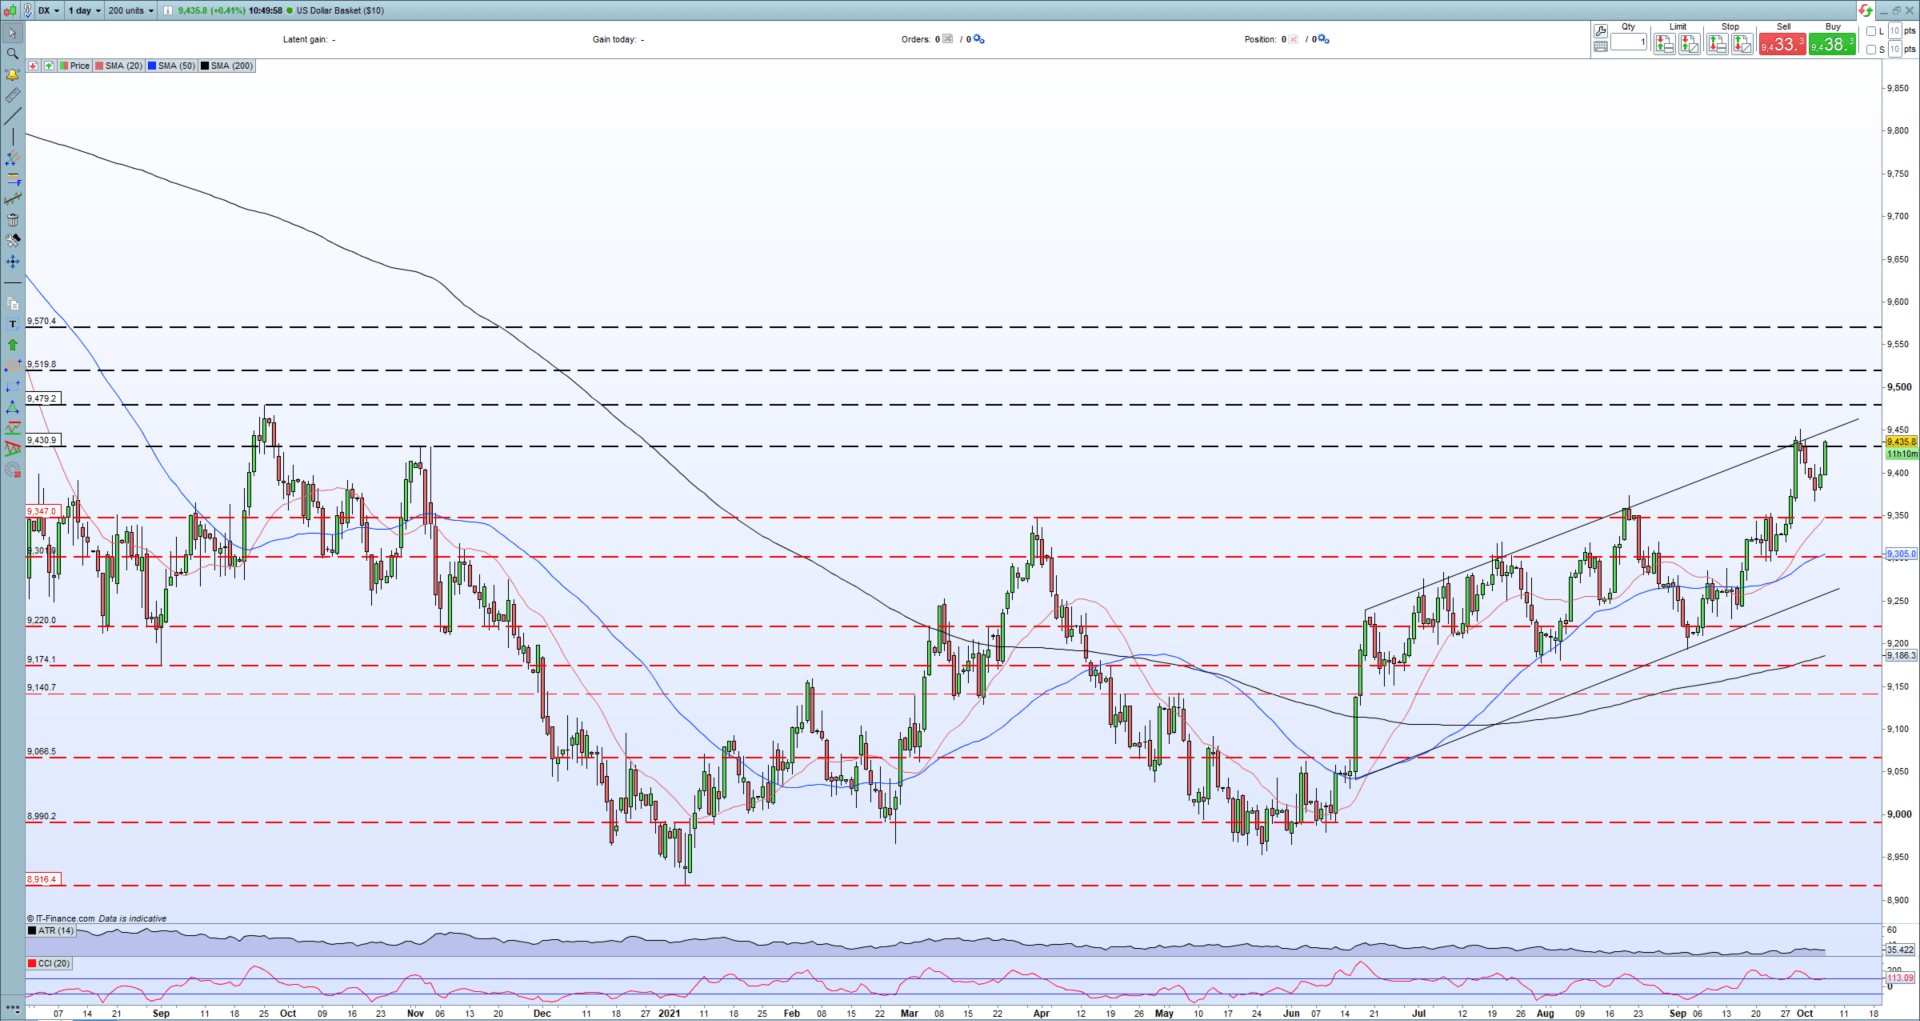
The US dollar basket (DXY) continues to trade within a well-defined channel with any sell-offs bought back quickly, helping to form a series of higher highs since mid-May. Trend resistance has acted as a brake on the move higher but as long as the trend remains intact, then the US dollar will continue to move higher. All three simple moving averages are positive and are supporting the move.
US Dollar (DXY) Daily Price Chart October 6, 2021
What is your view on the US Dollar – bullish or bearish?? You can let us know via the form at the end of this piece or you can contact the author via Twitter @nickcawley1.
Be the first to comment