

US Dollar Talking Points:
- The US Dollar set a fresh 20-year high yesterday with another topside test of the 105 psychological level.
- Today marks the start of the two-day FOMC meeting with tomorrow bringing the accompanying rate decision and press conference. Making the rounds yesterday was a Wall Street Journal report indicating that 75 basis point hike may be on the table for tomorrow and this had a noticeable impact on markets, the USD included.
- The analysis contained in article relies on price action and chart formations. To learn more about price action or chart patterns, check out our DailyFX Education section.
This theme certainly has taken its time. It was late last November when Chair Powell had moved to retire the word ‘transitory’ as it had become evident that inflation wasn’t going to just go away on its own. At the time, the most recent CPI print had come in at a whopping 6.8%, continuing the trend that was evident throughout the year. The Fed continually dismissed this as being related to supply chain disruptions, which were related to Covid; and despite the fact that CPI had crossed 5% in May the bank was still harboring hope that things would just correct themselves without the Fed needing to pull away the punch bowl.
But, as the end of Powell’s first term drew near the head of the FOMC all-of-the-sudden had a change-of-heart about the matter, and started talking about the need to address inflation.
This was seven months ago, and at this point the Fed has hiked rates on two separate occasions for a total of 75 basis points. Inflation, at this point, has shown little responsiveness as we just saw another 40-year-high print on CPI last Friday.
On the FX front, there was another item of interest late last week that continues to produce some impact and that was the European Central Bank rate decision. The ECB is facing a similar problem as the Fed last year, with Euro-area inflation climbing above 8%. So at last week’s rate decision the expectation was that the ECB would start to shift their stance towards fighting that inflation, to some degree, to avoid falling into the same position that the Fed finds itself this year. But the ECB didn’t really sound too hawkish, instead highlighting a 25 basis point hike in July which may be followed by a 50 bp move in September; neither of which seem very likely to arrest the inflation that’s already showing in the economy.
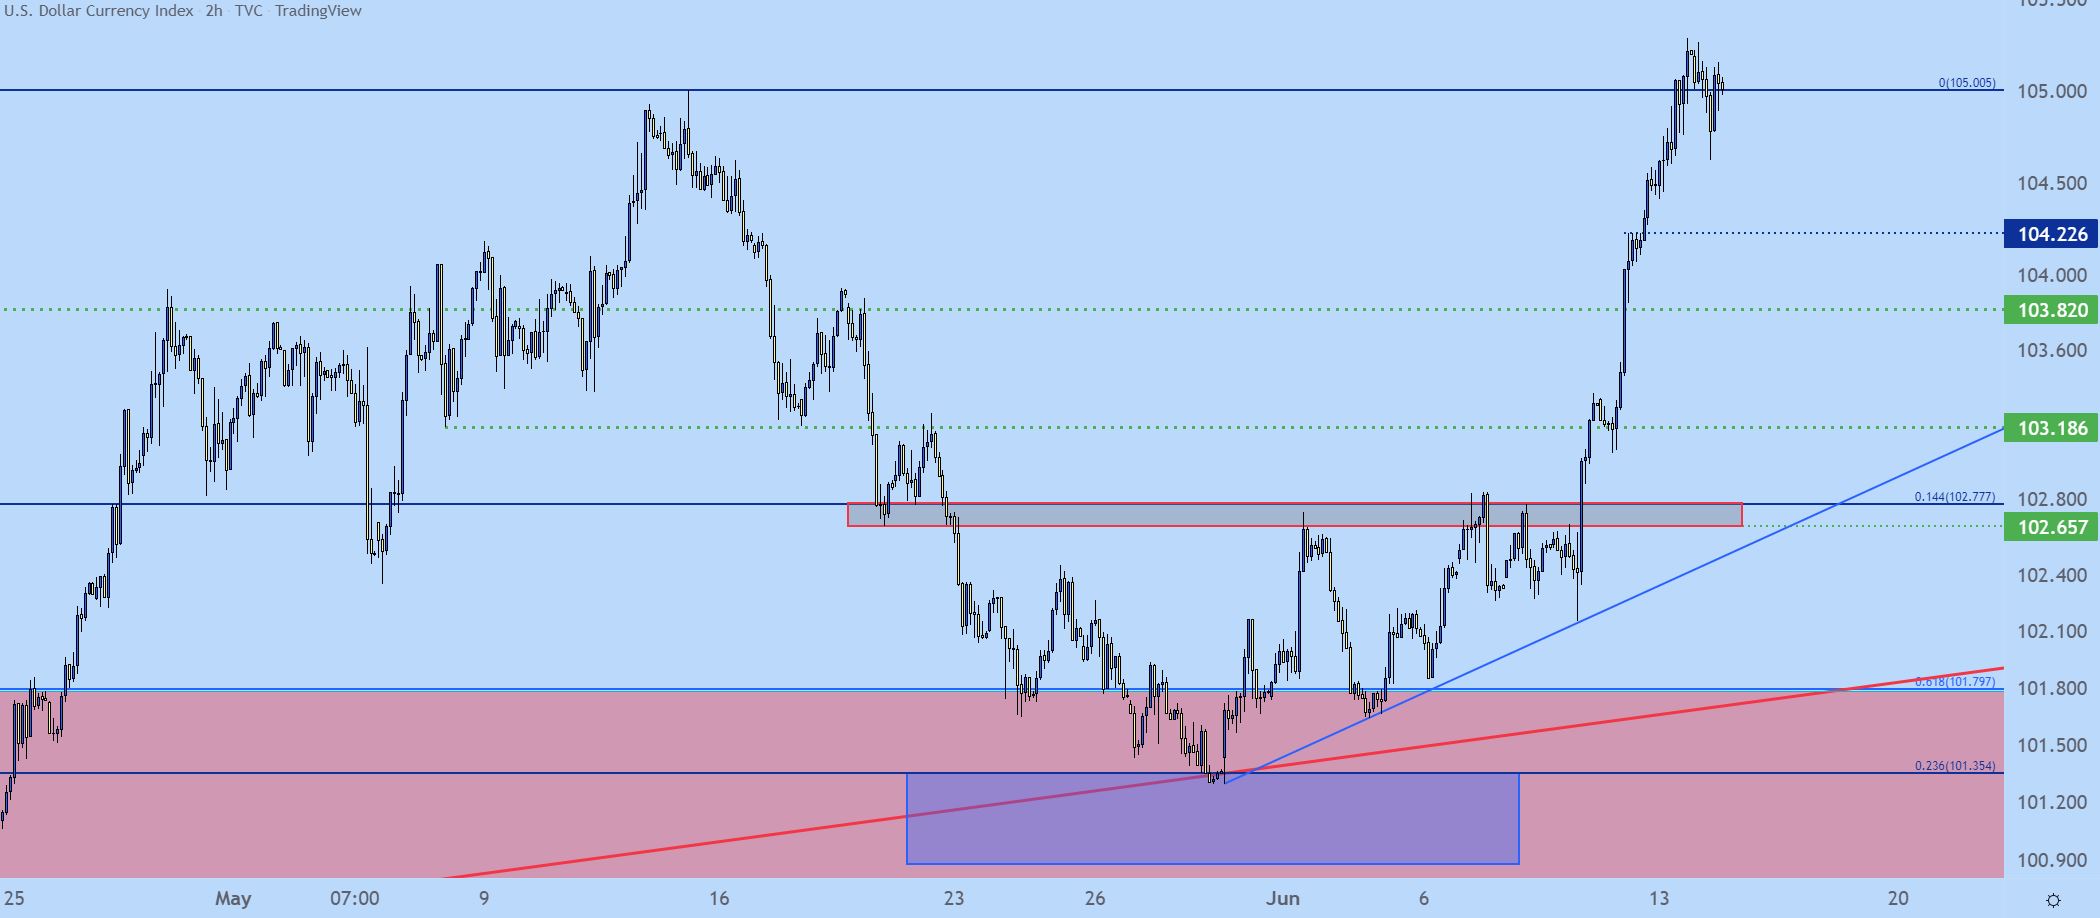
The response there was significant. The Euro began to drop and the US Dollar surged-higher, breaking out of an ascending triangle formation that I had talked about just after the rate decision had completed.
That formation filled in and buyers continued to press the bid through Monday trade, helping the Greenback to set another fresh 20-year high in yesterday’s session.
US Dollar Two-Hour Price Chart
Chart prepared by James Stanley; USD, DXY on Tradingview
US Dollar Longer-Term
Taking a step back to the daily chart and we can see USD perched at this fresh high with only a minimum of pullback so far.
US Dollar Daily Price Chart
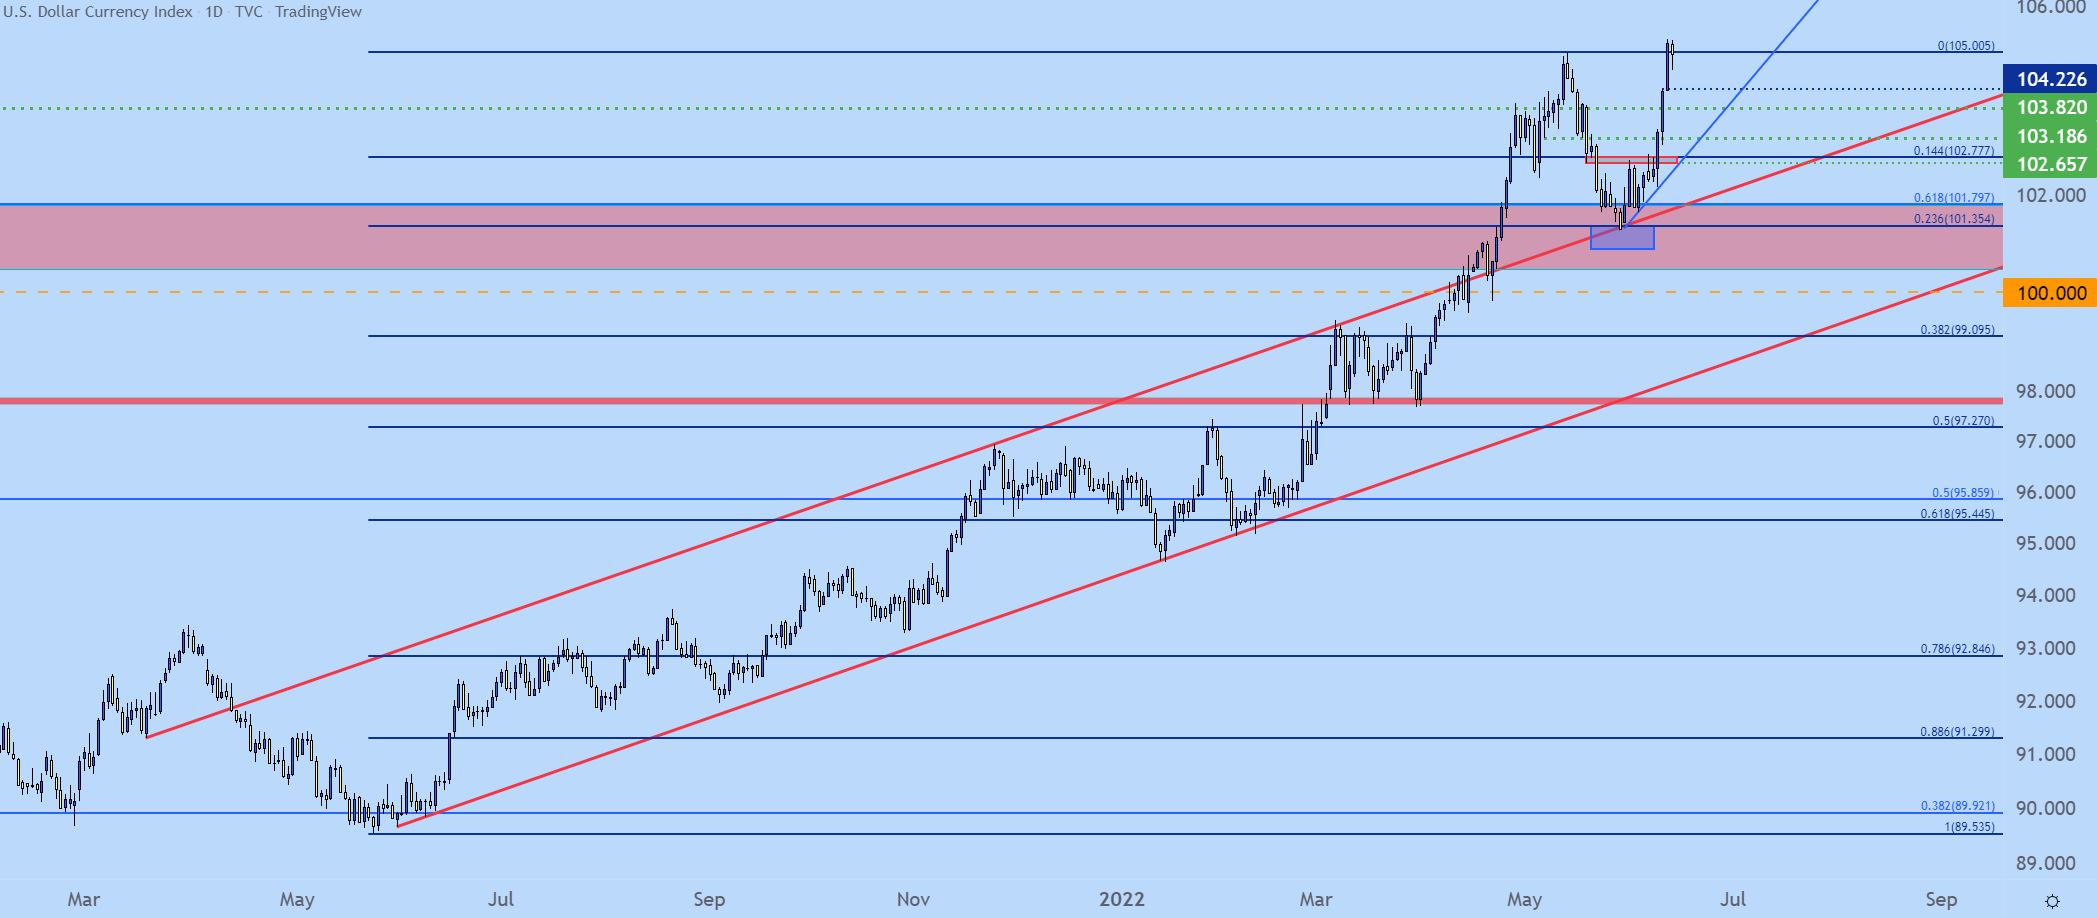
Chart prepared by James Stanley; USD, DXY on Tradingview
EUR/USD
For traders that are plotting breakout continuation in USD, they’re likely also looking for continued breakdown in EUR/USD.
That ECB rate decision brought the bears into the matter as it became apparent that the bank wasn’t yet ready to kick into a more-hawkish gear to fight off inflation. And there are other risks, as well, given the ongoing battle in Ukraine which keeps some inflation pressures in the equation regardless, such as with wheat or energy.
There’s already some banks out there calling for parity, as of this morning, which has been a notorious trap in the past on EUR/USD. But, given how quickly bears have come back into the pair, the current 19-year low at 1.0340 seems exposed to breakout potential as we near tomorrow’s FOMC rate decision.
Last week’s candle completed an evening star formation in the pair which is often followed with the aim of bearish reversals. In this case, it would be a reversal of the short-term pullback theme that found resistance around the psychological level of 1.0750.
EUR/USD Weekly Price Chart
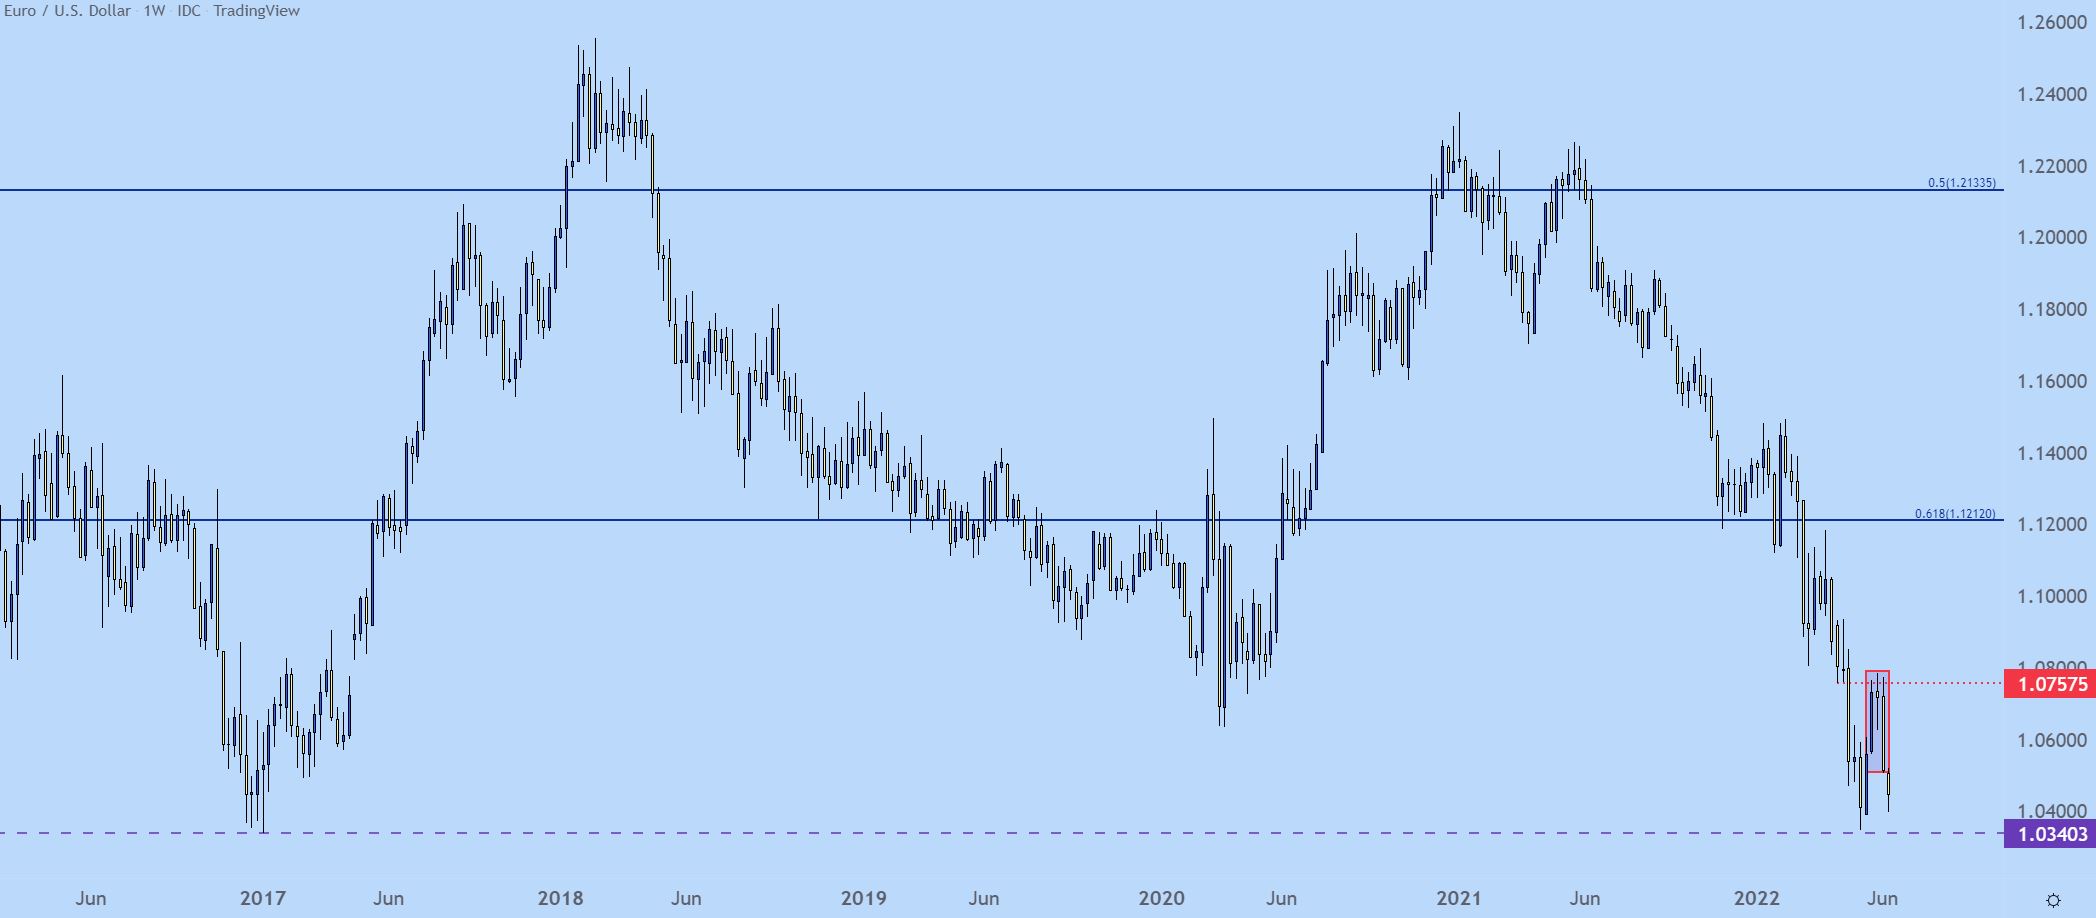
Chart prepared by James Stanley; EURUSD on Tradingview
GBP/USD Slices Through Key Support
As I had written ahead of that CPI report last week, GBP/USD had an item of encouragement for bulls in the fact that price had held a spot of support for a couple of weeks prior. That support ran from 1.2452-1.2500.
But as the USD surged on the back of that inflation report GBP/USD plunged through that support zone, and at this point the pair is now trading at fresh two-year-lows, closing in on a test of the 1.2000 psychological level, which is confluent with the 61.8% Fibonacci retracement of the 2020-2021 major move.
At this point price action is the proverbial falling knife. Trying to catch it could prove problematic. But, that confluent zone of support a little lower on the chart may be enough to stem the tide of sellers, which could allow for a short-squeeze/pullback type of scenario.
And, of note, there’s a Bank of England rate decision on the economic calendar for Thursday, less than 24 hours after the Fed.
GBP/USD Daily Chart
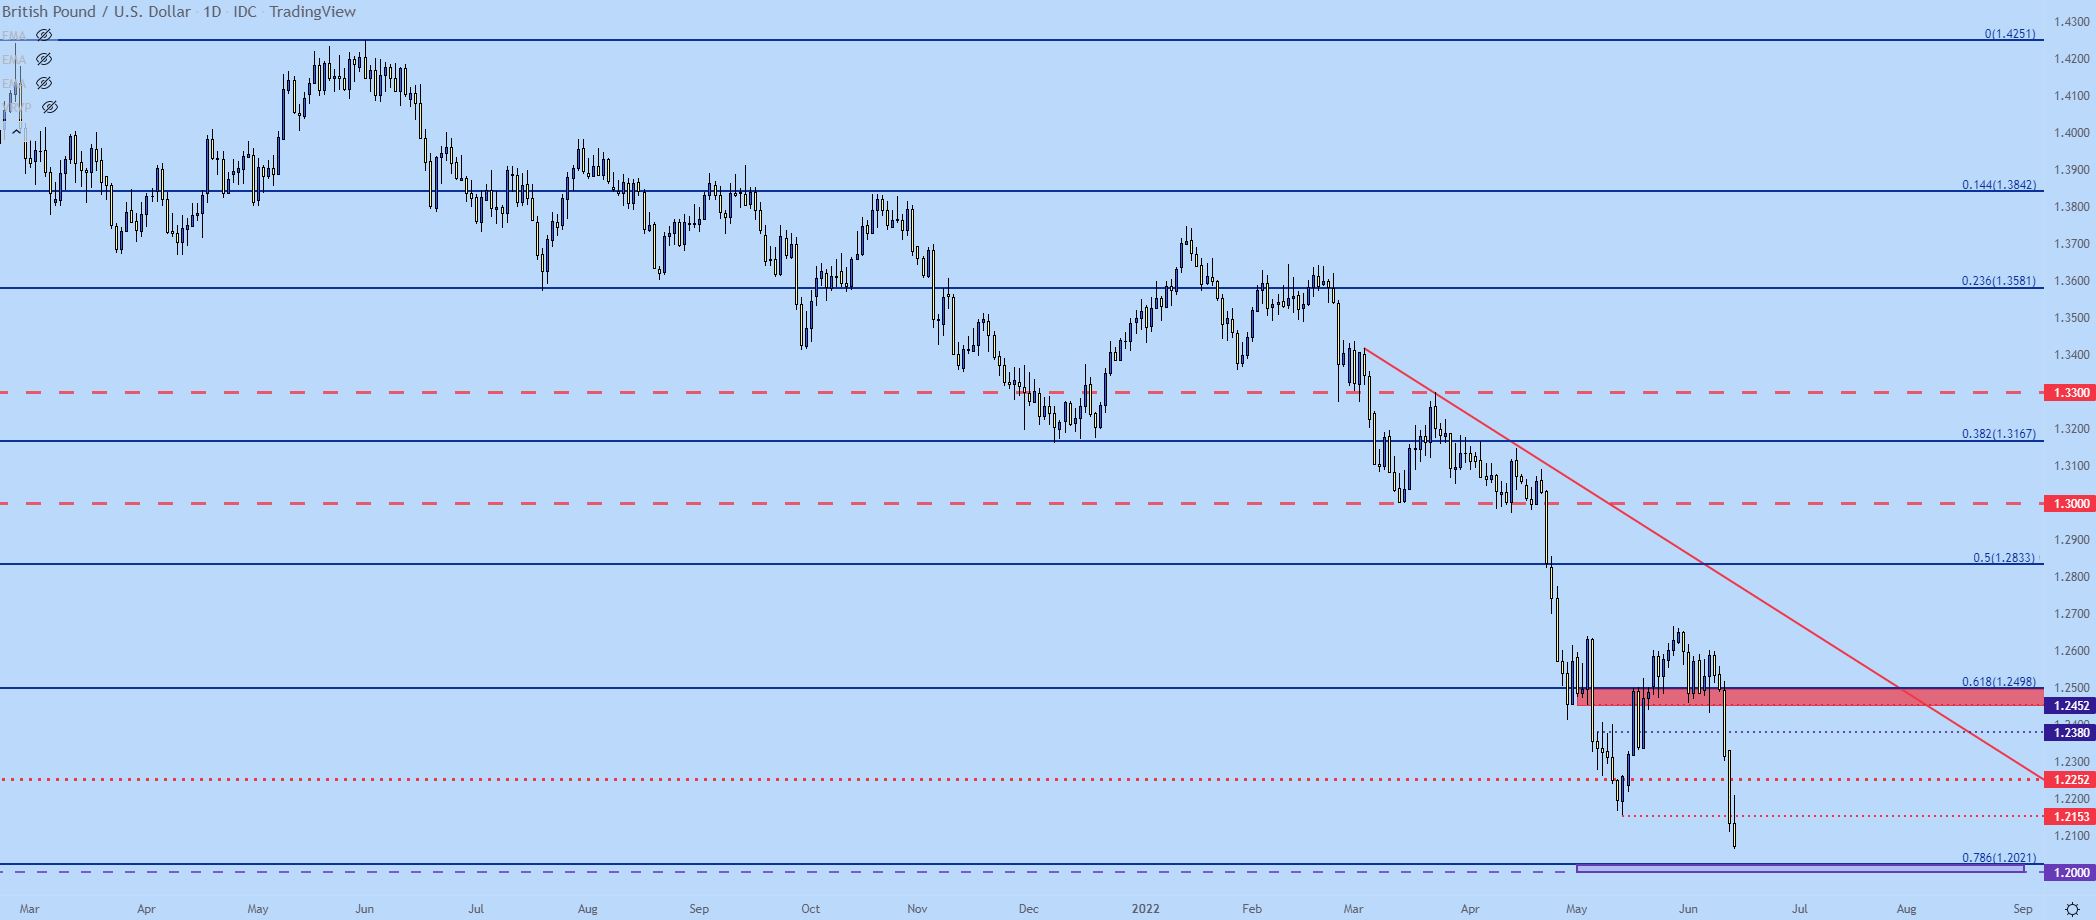
Chart prepared by James Stanley; GBPUSD on Tradingview
AUD/USD
The RBA hiked rates by 50 basis points early last week. But, one look at the weekly chart shows a market that’s clearly bearish on the matter as the past two weeks have produced a sharp reversal of the gains from the prior three weeks.
This exposes the current yearly low in the pair at .6830, and this also threatens to invalidate a bull flag formation that’s been setting up on the longer-term AUD/USD chart. A breach of the low opens the door for a run down to the 61.8% retracement of the 2020-2021 major move.
AUD/USD Weekly Chart
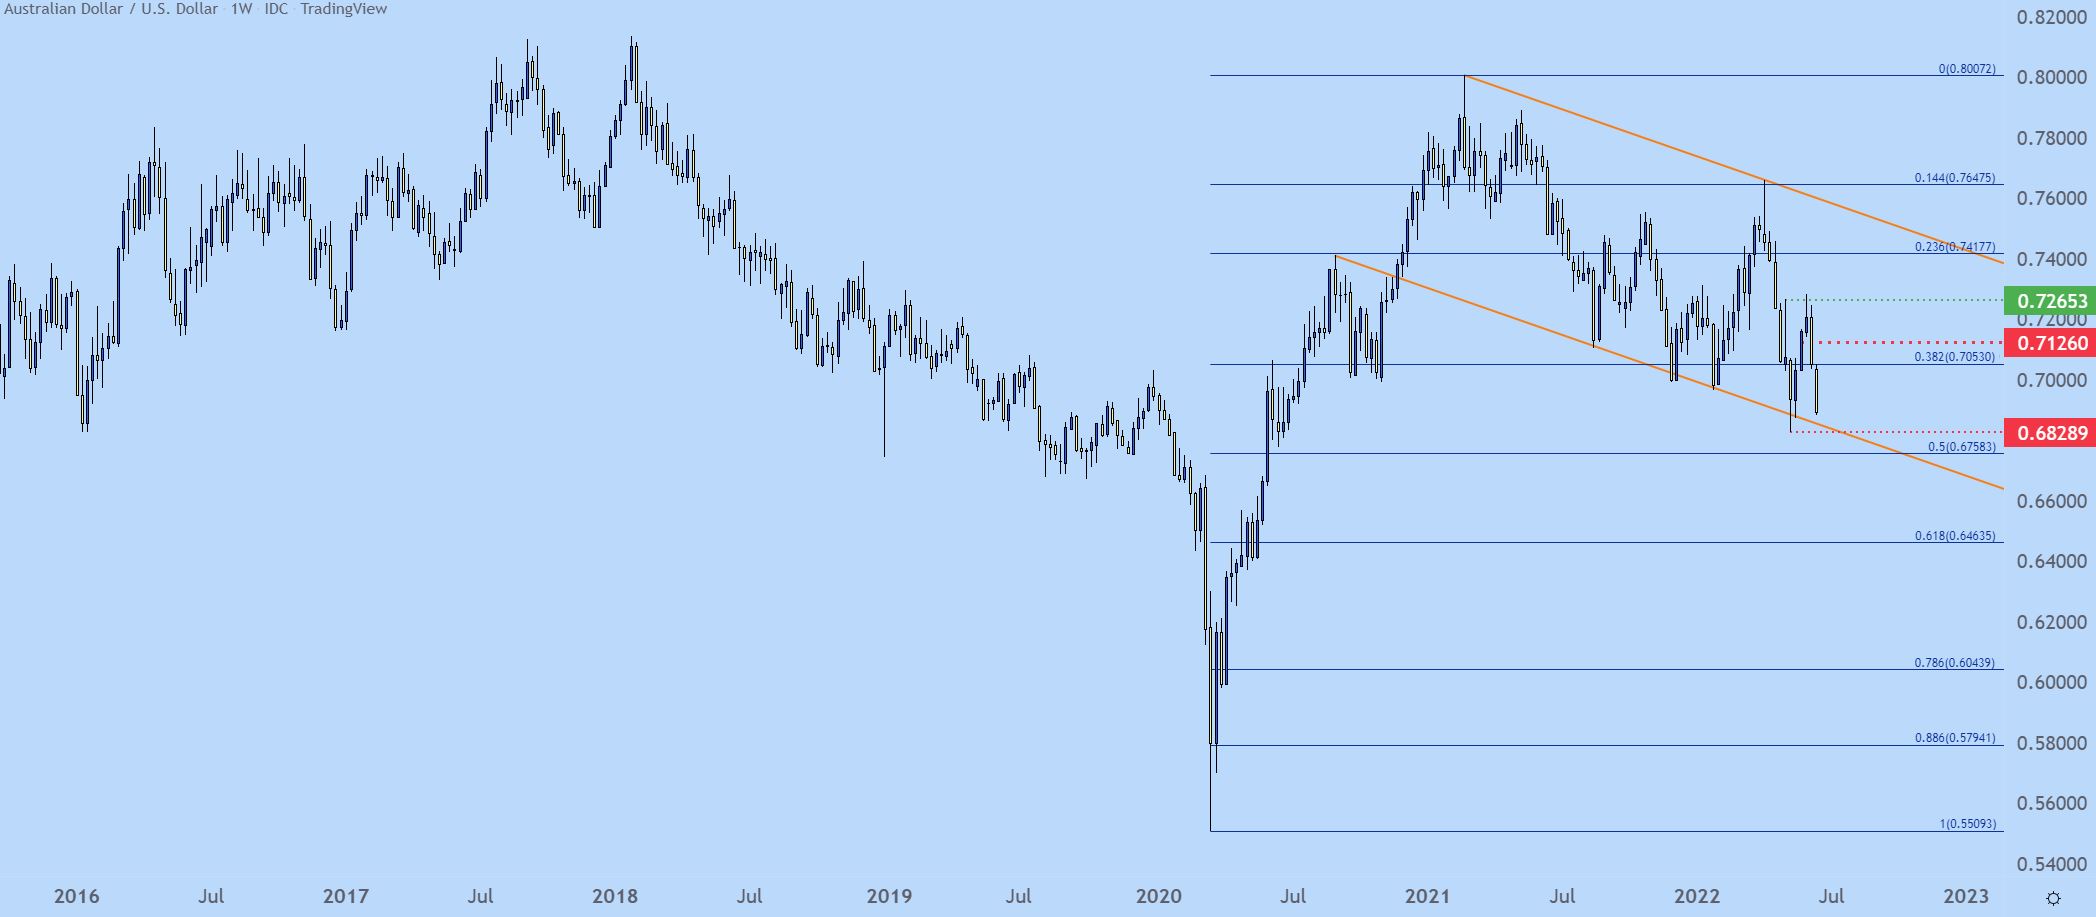
Chart prepared by James Stanley; AUDUSD on Tradingview
USD/JPY
The Bank of Japan meets on Thursday evening/Friday morning in Asia, and the big question is the BoJ’s tolerance towards all of the Yen-weakness that we’ve seen of recent.
As I had highlighted early last week, BoJ Governor Kuroda had seemingly opened the door to another run of Yen-weakness, saying that the bank wanted to see ‘stable’ inflation above 2%. At that point, there was but one inflation print that had come in over that marker and it was the most recent month at 2.5%, so markets were very much expecting the BoJ to remain loose and passive towards the matter.
Accordingly, Yen-weakness came back in a big way last week and USD/JPY shot-up to another 20 year high. Eventually, price trickled up to the 135.00 level which has stalled the advance for now. From the daily chart below, we can see the tension visibly displayed as the past three daily candles are highlighting varying forms of indecision.
USD/JPY Daily Price Chart
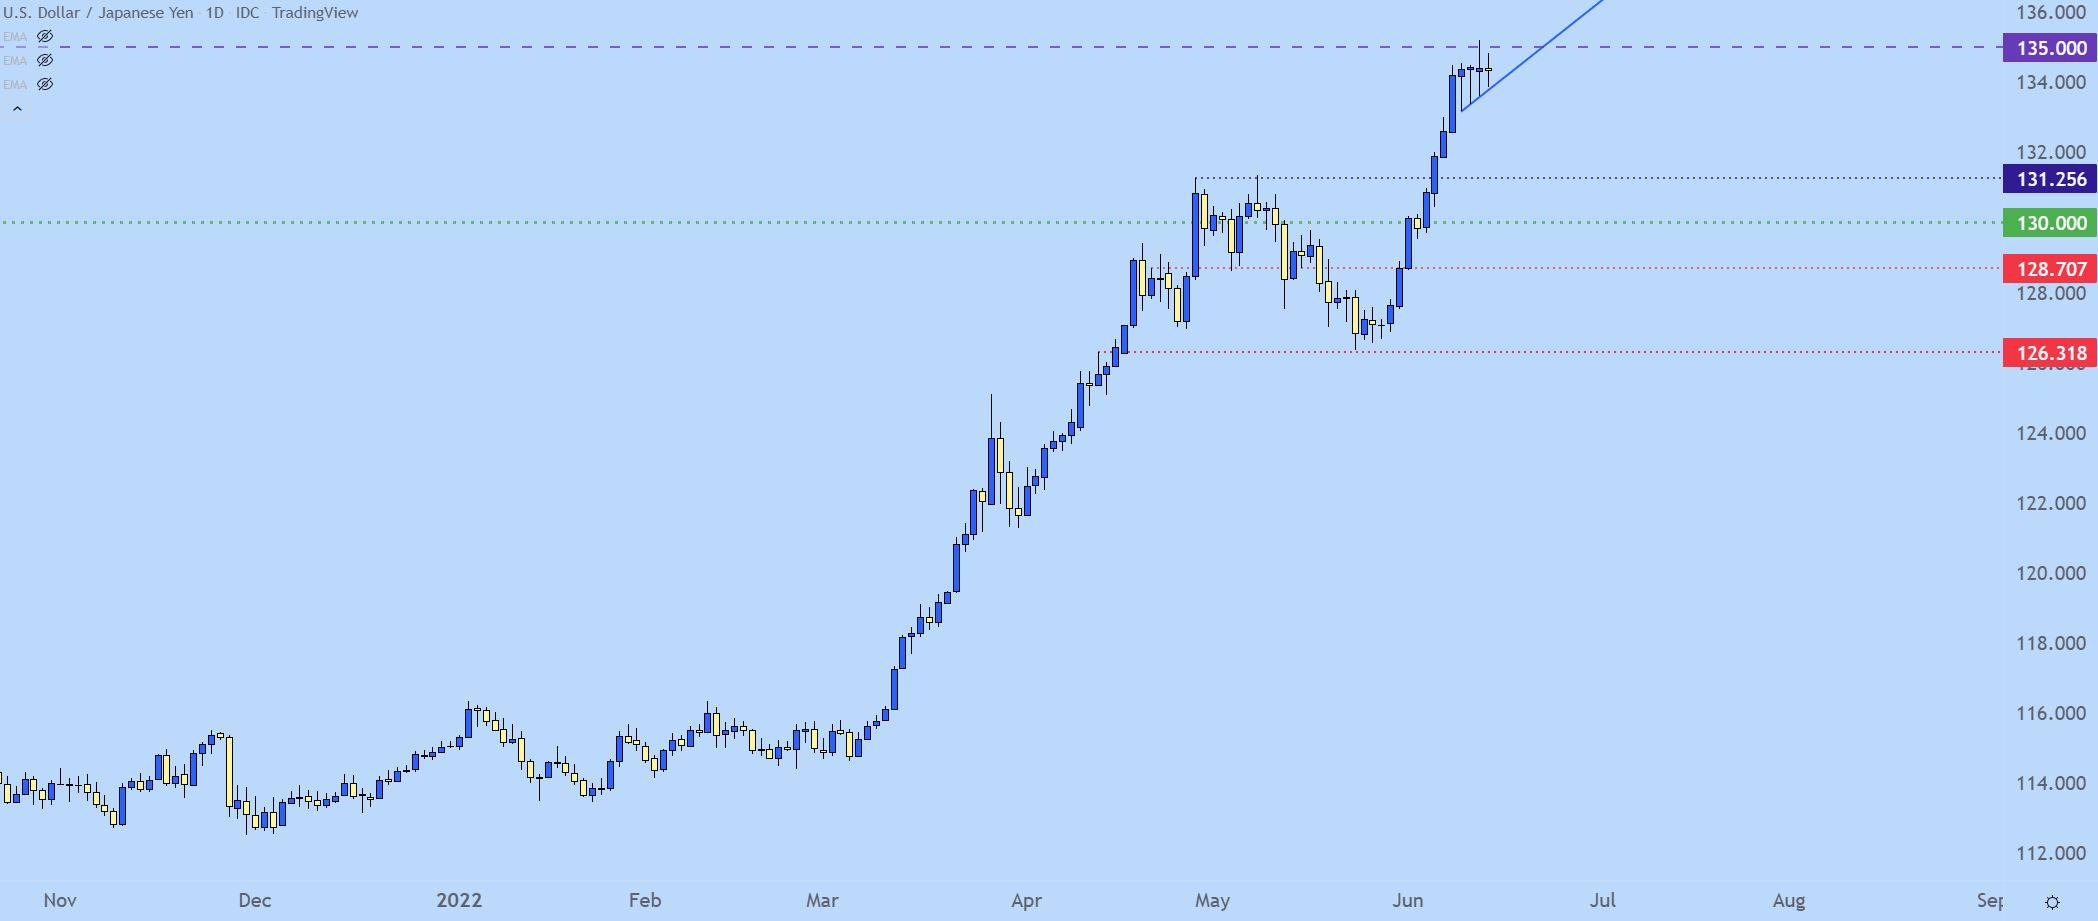
Chart prepared by James Stanley; USDJPY on Tradingview
USD/JPY Shorter-Term
Going down to a tighter time frame and we can see the build of an ascending triangle formation with respect to that resistance at 135.00.
This keeps the door open for topside breakout potential as we near the FOMC rate decision which is then followed by the BoJ on Thursday of this week.
USD/JPY Hourly Price Chart
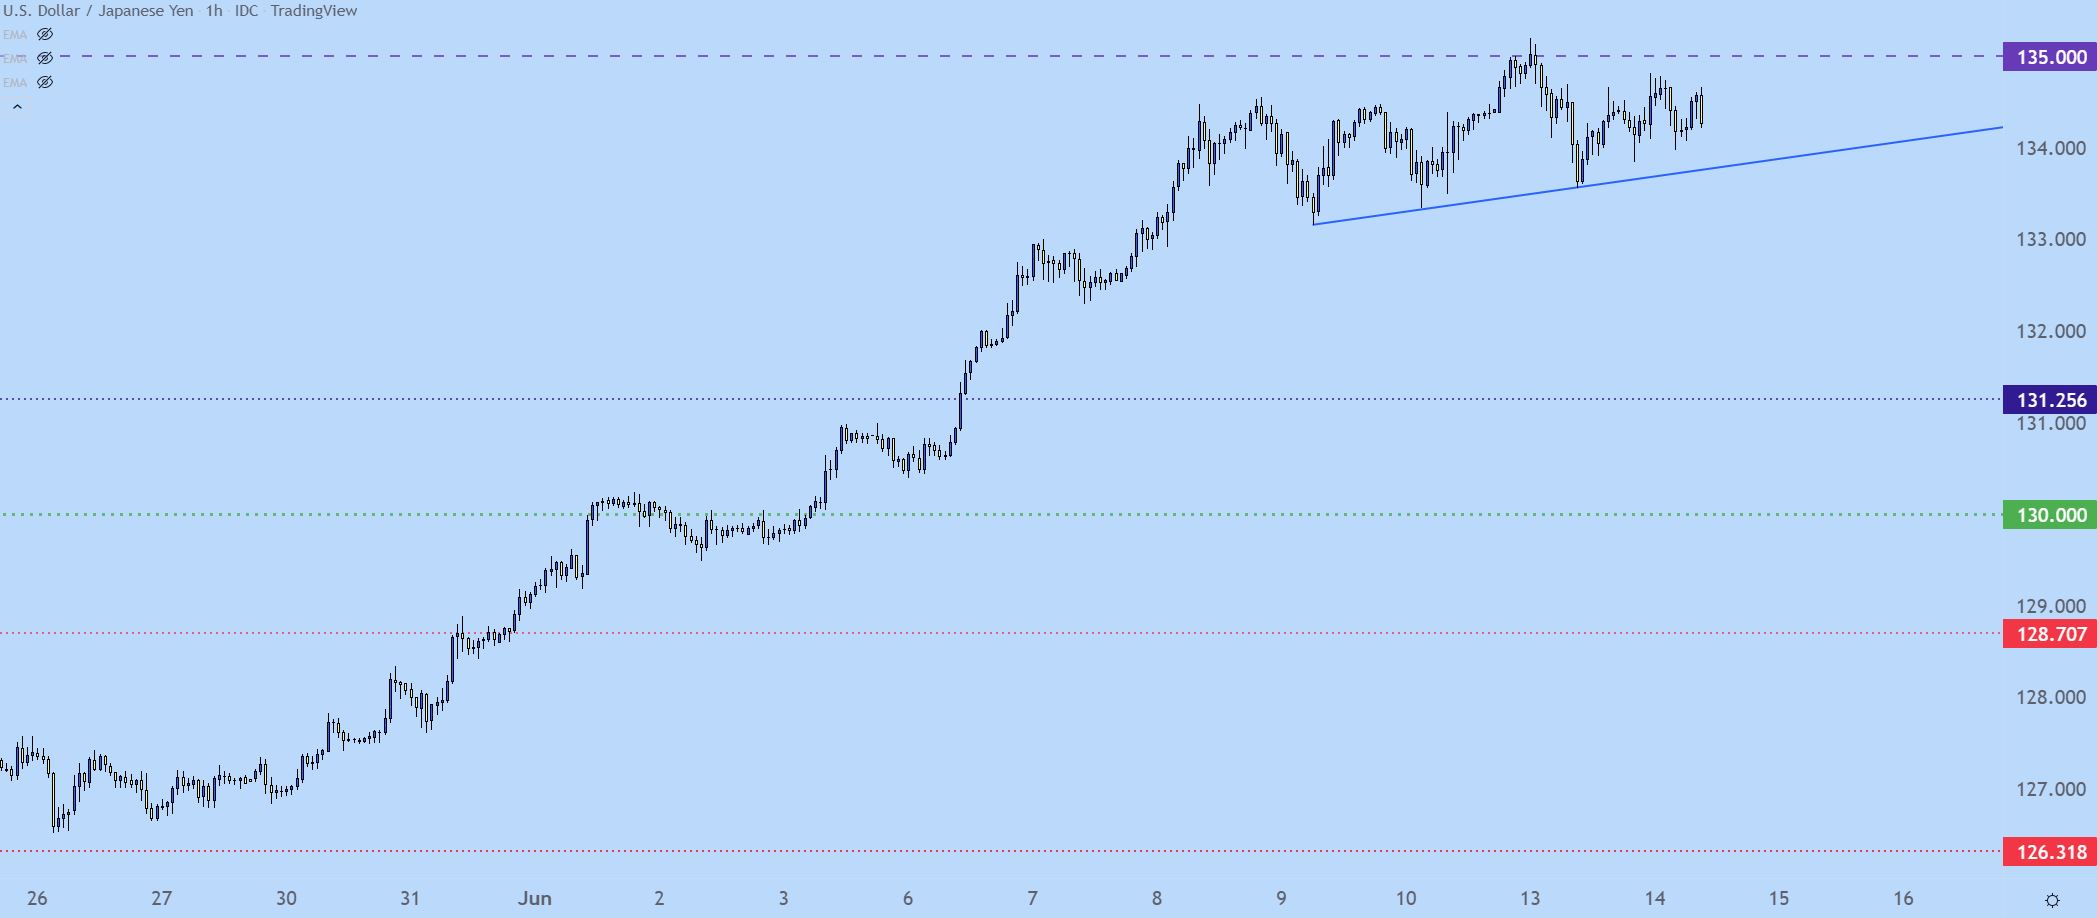
Chart prepared by James Stanley; USDJPY on Tradingview
— Written by James Stanley, Senior Strategist for DailyFX.com
Contact and follow James on Twitter: @JStanleyFX
Be the first to comment