

US Dollar, DXY, Yields, JPY, EUR, USD/CNY, AUD, CAD, NOK, NZD – Talking Points
- The US Dollar is at 20-year highs, but DXY index is lacking follow through
- Commodities and a bloc of related currencies have been pummelled in the fallout
- USD is making multi-year peaks against most currencies. Can DXY burst higher?
The US Dollar soared on Monday and into Tuesday as US nominal and real yields continued to escalate higher. The strength of the ‘big dollar’ was most felt against commodities and their related currencies.
Bizarrely, the DXY index, the most popular US Dollar index, has barely nudged a new high at the start of this week. This largely due to the Euro and Japanese Yen being relatively unscathed in the Dollar blitz so far, but that may not last.
US Dollar Index (DXY)Against US 10-Year Nominal and Real Yields
The People’s Bank of China (PBOC) allowed the Yuan to weaken to its lowest level since November 2020 on Monday. USD/CNY is now closing in on levels above 6.7300, well up from 6.3600 seen 3-weeks ago.
The world’s second-largest economy has allowed its currency to depreciate, and this could have further ramification for regional USD appreciation. The willingness of Japanese officials to jawbone USD/JPY lower could become less apparent.
Rising external yields are often associated with bouts of Yen depreciation and the resolve of the Bank of Japan to maintain domestic yield curve control may come under further scrutiny. A pop higher in USD/JPY cannot be ruled out.
USD traded at levels not seen since 2020 against AUD, CAD, NZD and NOK – otherwise known as the ‘commodity bloc’.
These currencies are susceptible to swings in risk appetite as their underlying economies are seen to be tied to global growth prospects due to their significant export of commodities.
Energy, industrial metals, precious metals and soft (agricultural) commodities are all under pressure in this round of US Dollar strengthening.
It should be noted though that the underlying problems with supply of most of these commodities have not gone away. Most particularly, the war in the Ukraine is ongoing and doesn’t look like abating any time soon.
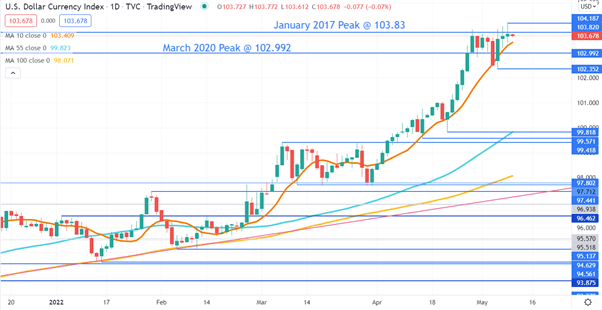
US Dollar Index (DXY) Technical Analysis
The US Dollar index made a 20-year high at the end of April, but it has failed to follow through and appears to be stalling near the twin peaks of January 2017 and March 2020.
The DXY index is a US Dollar index that is weighted against EUR (57.6%), JPY (13.6%), GBP (11.9%), CAD (9.1%), SEK (4.2%) and CHF (3.6%).
As discussed above, EUR and JPY have not lost as much ground against the USD of late and this can explain the consolidation of the DXY.
The recent high of 104.187 may offer resistance. A break below the 10-day simple moving average (SMA) may indicate a turn in bullish momentum and support might be at last week’s low of 102.352.
— Written by Daniel McCarthy, Strategist for DailyFX.com
To contact Daniel, use the comments section below or @DanMcCathyFX on Twitter
Be the first to comment