

US Dollar Forecast Overview:
- The US Dollar (via the DXY Index) has been trading in an ever-tightening range, with implications for pairs like EUR/USD and USD/JPY.
- EUR/USD’s symmetrical triangle can break in either direction, while USD/JPY’s technical outlook is less enthusiastic.
- Retail trader positioning suggests that the US Dollar may trade higher in the coming days.

Recommended by Christopher Vecchio, CFA
Get Your Free USD Forecast
US Dollar Endures Horrid Economic Data
Another day goes by with more bleak US economic data. After the worst US retail sales report in history yesterday, the latest round of weekly initial jobless claims tallied 5.2 million. While below the consensus forecast of 5.4 million, in sum, nearly 22 million jobs have been lost over the last four weeks due to the coronavirus pandemic shutdown – or what economists are calling The Great Lockdown.
For context, the past four weeks of The Great Lockdown have erased the equivalent of all the jobs created over the past decade since The Great Recession. And so, the struggle will continue, both in mounting economic terms and human capital. Those hoping for a V-shaped recovery may find themselves disappointed over the coming months.
US Treasury Yield Curve Continues to Normalize
While the US Treasury yield curve has normalized at the very front-end – 1-month bills are no longer yielding more than their equivalents out to 2-year notes – by and large much of this normalization has come at the hands of extraordinary policy steps taken by the Federal Reserve.
After all, as we learned from The Great Recession, companies that are facing liquidity issues in the short-term can easily be swept up in the tides of insolvency if aggressive, heavy handed measures are not taken swiftly and upfront; the policy response cannot be a slow drip.
US Treasury Yield Curve: 1-month to 30-years (April 16, 2020) (Chart 1)
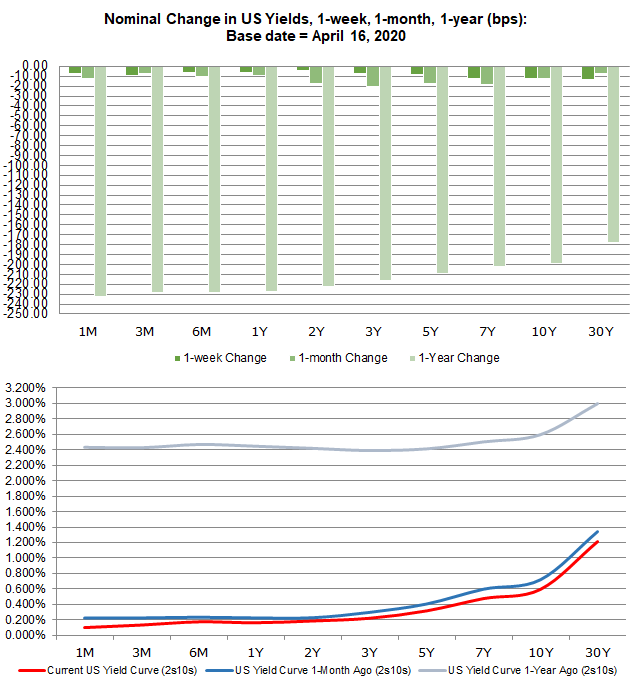
That said, markets still feel there is risk to the US economy over the near-term horizon: the 6-month bill still yields more than the 1-year or 2-year yields. For all the excitement in equity markets over the past month, credit is still suggesting that we’re not out of the woods just yet – which, in context of the lack of nationwide testing across the United States, makes complete sense.
Fed Rate Cuts Done; New Measures More Likely
It still holds that, with the Federal Reserve already having enacted emergency interest rate cut measures, rate markets are more or less stuck in a state of suspended animation. If the Fed is going to do anything from here on out, it’s going to come via more QE, a repo facility, etc. The latest extraordinary effort, the Municipal Liquidity Facility, is an example of this effort (although the initial framework appears extremely limiting, only allowing 10 cities and 15 counties to access the facility at its inception; this is amendable, however).
Federal Reserve Interest Rate Expectations (April 16, 2020) (Table 1)
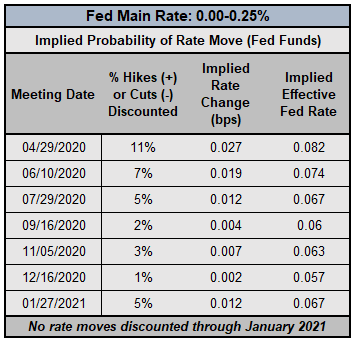
There’s been no indication that the Fed plans on moving rates into negative territory, and as a result, we’ve reached the lower bound for the time being. To this end, any suggestions by rates markets that a rate hike is coming anytime soon is a pricing quirk to be ignored: interest rates are not going anywhere higher, at least through January 2021.
DXY PRICE INDEX TECHNICAL ANALYSIS: DAILY CHART (July 2019 to April 2020) (CHART 2)
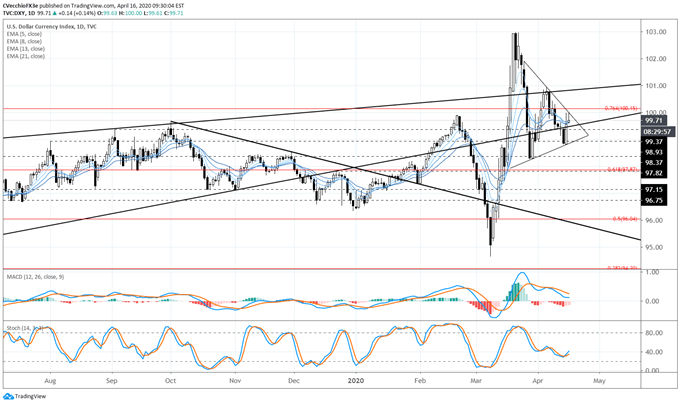
The US Dollar (via the DXY Index) has endured shifts in the US Treasury market in recent weeks without staking out much of a bias with respect to the moves. In part, gains by global equity markets have tempered the demand for the US Dollar as a safe haven, a situation not dissimilar from what the Japanese Yen has experienced since mid-March.
Yet the DXY Index’s lack of direction in recent weeks appears to be yielding a symmetrical triangle on the daily timeframe, typically a pattern that can result in either a bearish or bullish outcome. Through the consolidation, while the DXY Index has moved sideways, bullish momentum has deteriorated without price losing ground. Daily MACD continues to decline while in bullish territory, while Slow Stochastics has recently started to rise back above its median line. There is currently little agreement among the daily 5-, 8-, 13-, and 21-EMA envelope.
While there may be an argument that the symmetrical triangle formed in the context of the rebound from the March lows, thereby giving it a bullish bias, this strategist much prefers a ‘wait-and-see’ approach given the tendency for markets to act atypically during the coronavirus pandemic.
DXY PRICE INDEX TECHNICAL ANALYSIS: WEEKLY CHART (NOVEMBER 2016 to APRIL 2020) (CHART 3)
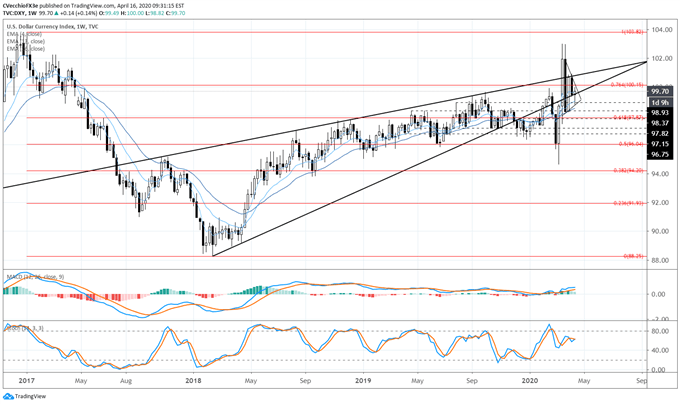
The weekly timeframe is illuminating with respect to the ‘wait-and-see’ approach to the DXY Index. Since the start of March, there have been moves both above resistance and below support in the bearish rising wedge in place since mid-2017, and at present time, the DXY Index is sitting right back within the bearish rising wedge itself.
To this end, a bullish hammer has been forming on the weekly timeframe, suggesting that traders aren’t ready to embrace the downside scenario just yet. The return back into the wedge, coupled with the bullish profile of the weekly MACD and Slow Stochastics, as well as the weekly 4-, 13-, and 26-EMAs moving in bullish sequential order, suggests that more upside may still be had.
USD/JPY RATE TECHNICAL ANALYSIS: DAILY CHART (July 2019 to April 2020) (CHART 4)
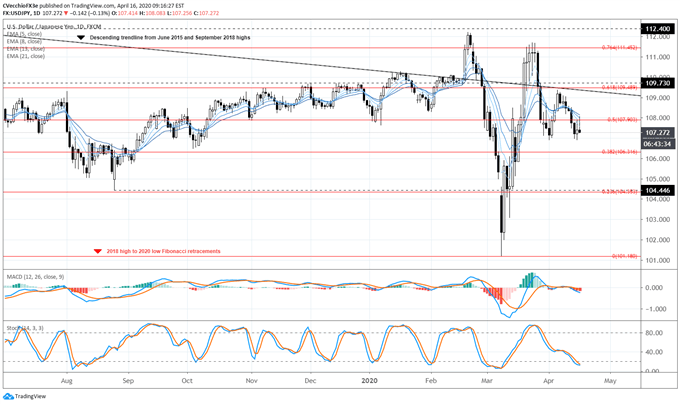
USD/JPY has endured losses in recent days as global equity markets have fizzled out after an outstanding rally from the March lows. Gains by gold prices and weakness in US Treasury yields typically favors the Japanese Yen; and indeed, that relationship has held up over the past two weeks of trading.
To this end, the momentum profile for USD/JPY rates is becoming more bearish. USD/JPY rates are below the daily 5-, 8-, 13-, and 21-EMA envelope, which has aligned in bearish sequential order. Daily MACD continues to glide below its signal line, while Slow Stochastics are digging deeper into oversold territory. A drop below the April low of 106.92 would open up the floor for steeper losses in the coming sessions.
IG Client Sentiment Index: USD/JPY RATE Forecast (April 16, 2020) (Chart 5)
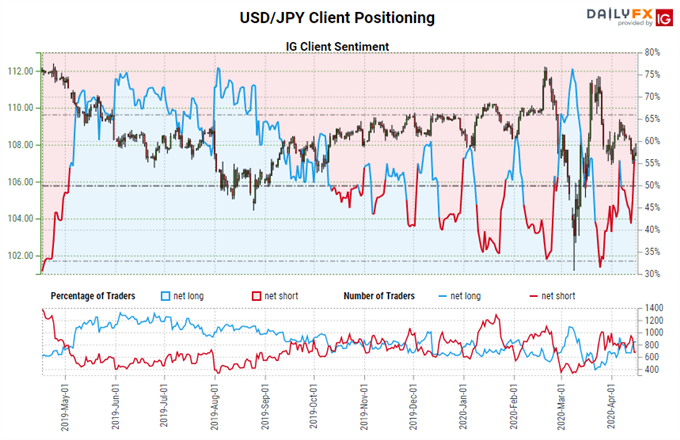
USD/JPY: Retail trader data shows 57.20% of traders are net-long with the ratio of traders long to short at 1.34 to 1. The number of traders net-long is 3.25% higher than yesterday and 12.17% higher from last week, while the number of traders net-short is 9.21% lower than yesterday and 16.46% lower from last week.
We typically take a contrarian view to crowd sentiment, and the fact traders are net-long suggests USD/JPY prices may continue to fall.
Traders are further net-long than yesterday and last week, and the combination of current sentiment and recent changes gives us a stronger USD/JPY-bearish contrarian trading bias.
EUR/USD RATE TECHNICAL ANALYSIS: DAILY CHART (July 2019 to April 2020) (CHART 6)
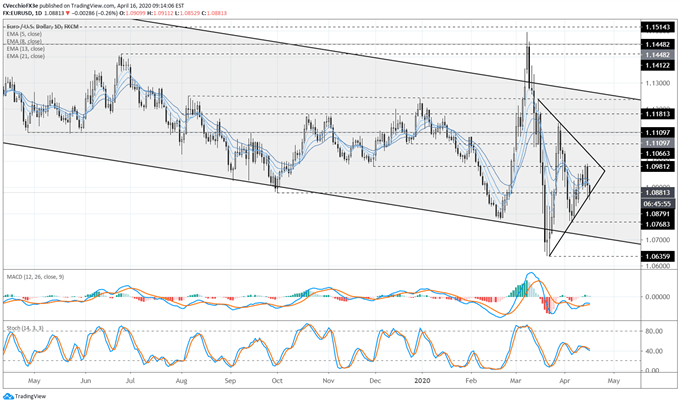
As the largest component of the DXY Index, it’s no surprise that EUR/USD’s price action over recent weeks closely resembles that of the broader dollar gauge. To this end, the symmetrical that has formed may retain a bearish bias, insofar as it was created after a sharp decline from the March highs.
EUR/USD has been a mirror image of the DXY Index through the consolidation into the symmetrical triangle, given that bearish momentum has deteriorated without price gaining ground. Daily MACD continues to rise while in bearish territory, while Slow Stochastics has recently started to fall back above its median line. There is currently little agreement among the daily 5-, 8-, 13-, and 21-EMA envelope.
Yet like for DXY Index, context matters: these are unusual times, so it’s better to wait for direction that to assume that the tendencies of pre-coronavirus trading still hold. Should we be expecting a big move soon? Yes. Which direction will it go? That’s unclear. Which is why it’s best to keep open the possibility of either outcome and not get married to any particular trade idea during this market environment.
IG Client Sentiment Index: EUR/USD RATE Forecast (April 16, 2020) (Chart 7)
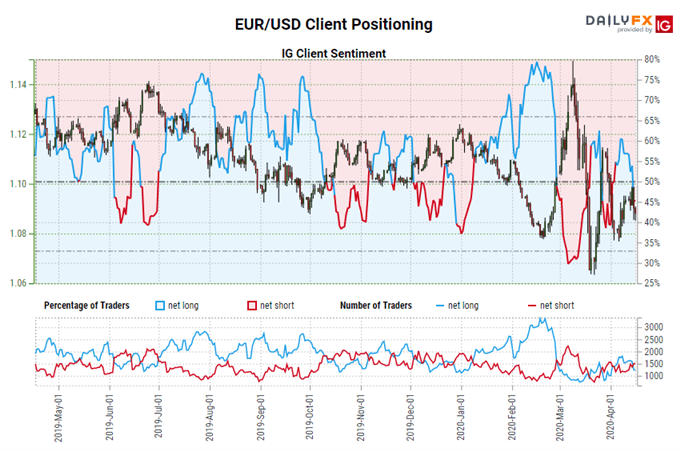
EUR/USD: Retail trader data shows 47.18% of traders are net-long with the ratio of traders short to long at 1.12 to 1. The number of traders net-long is 4.44% lower than yesterday and 22.16% lower from last week, while the number of traders net-short is 16.91% higher than yesterday and 35.39% higher from last week.
We typically take a contrarian view to crowd sentiment, and the fact traders are net-short suggests EUR/USD prices may continue to rise.
Traders are further net-short than yesterday and last week, and the combination of current sentiment and recent changes gives us a stronger EUR/USD-bullish contrarian trading bias.

Recommended by Christopher Vecchio, CFA
Traits of Successful Traders
— Written by Christopher Vecchio, CFA, Senior Currency Strategist
To contact Christopher Vecchio, e-mail at cvecchio@dailyfx.com
Follow him on Twitter at @CVecchioFX
View our long-term forecasts with the DailyFX Trading Guides
Be the first to comment