

US Dollar, S&P 500, Nasdaq 100 Price Analysis
- The world remains in the midst of a global pandemic but, from a markets perspective, US equities just closed the books on a really strong month of April.
- Is this but a bear market rally? Or, will the stimulus that’s already been announced be followed by more and more until, eventually, bears have to throw in the towel against massive stimulus efforts.
- The US Dollar is testing monthly lows, showing right around the 50% marker of the March major move, setting the stage for a relatively full economic calendar next week with NFP on Friday.
Stocks Close Books on a Strong April: But Are Bears Finished?
It was a big week across global markets with both the Fed and the ECB, going along with a slew of corporate earnings reports out of the US; and as we head for the close of this week a bit of fear has re-entered the equation. The ‘sell in May’ phenomenon didn’t have to wait for long as stocks tanked on their first trading day of the month, coming on the heels of a really strong April which saw the S&P 500 put in its strongest month of performance since January of 1987.
Buffering that fact and putting a bit of context behind the run, this came after one of the most aggressive sell-offs ever seen when the S&P 500 gave up more than 35% as coronavirus fears were being priced-in to the equation. The US government hurriedly ushered in more than $6 trillion in stimulus and, to date, that’s helped to hold the March lows while bringing some buyers back into the matter. But – now that May is here, and as shutdown orders are beginning to be lifted or scaled back – the big question is what’s next? What might a new normal look like and, perhaps more to the point from a timing perspective, is a ‘V-shaped recovery’ even possible?
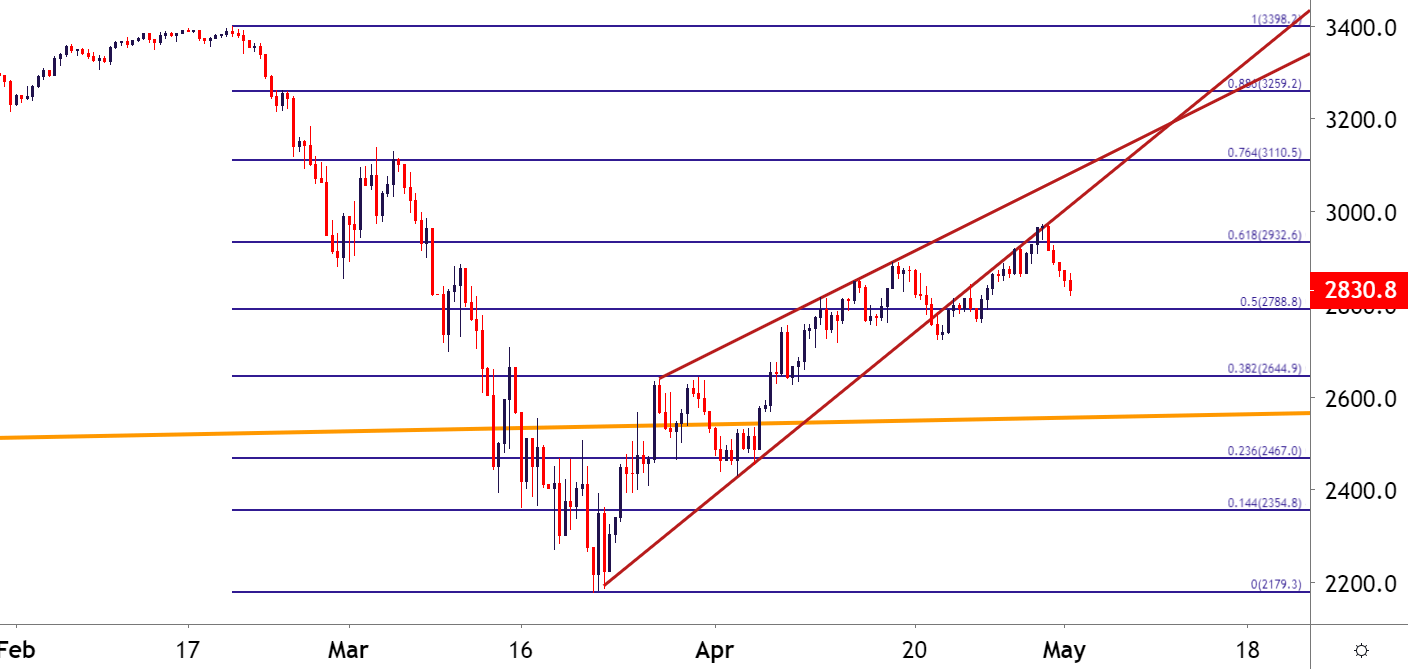
As looked at previously, that recovery in the S&P 500 had taken on a corrective tone; building in the form of a rising wedge pattern playing a similar role as a bear flag. For the past week-and-a-half, the rally in the S&P 500 has been riding on the underside of that pattern; with the May open bringing more bears into the mix to push price action back-below the 2900 level.
Read more about the rising wedge in the recently revamped DailyFX Education portal.
S&P 500 Eight-Hour Price Chart
Chart prepared by James Stanley; SPX500 on Tradingview
For US equity bulls or for those that do want to look at bullish continuation scenarios, the Nasdaq 100 may be attractive. It appeared to get hit less aggressively as fear was getting priced-in to the equation; and the corresponding bounce appeared to have a stronger push on the bid. Today’s sell-off helped to push the index down to a key swing point on the chart around the 8700 level, which is a prior swing-high that’s already functioned as support when tested earlier this week.

Recommended by James Stanley
Building Confidence in Trading
Nasdaq 100 Four-Hour Price Chart
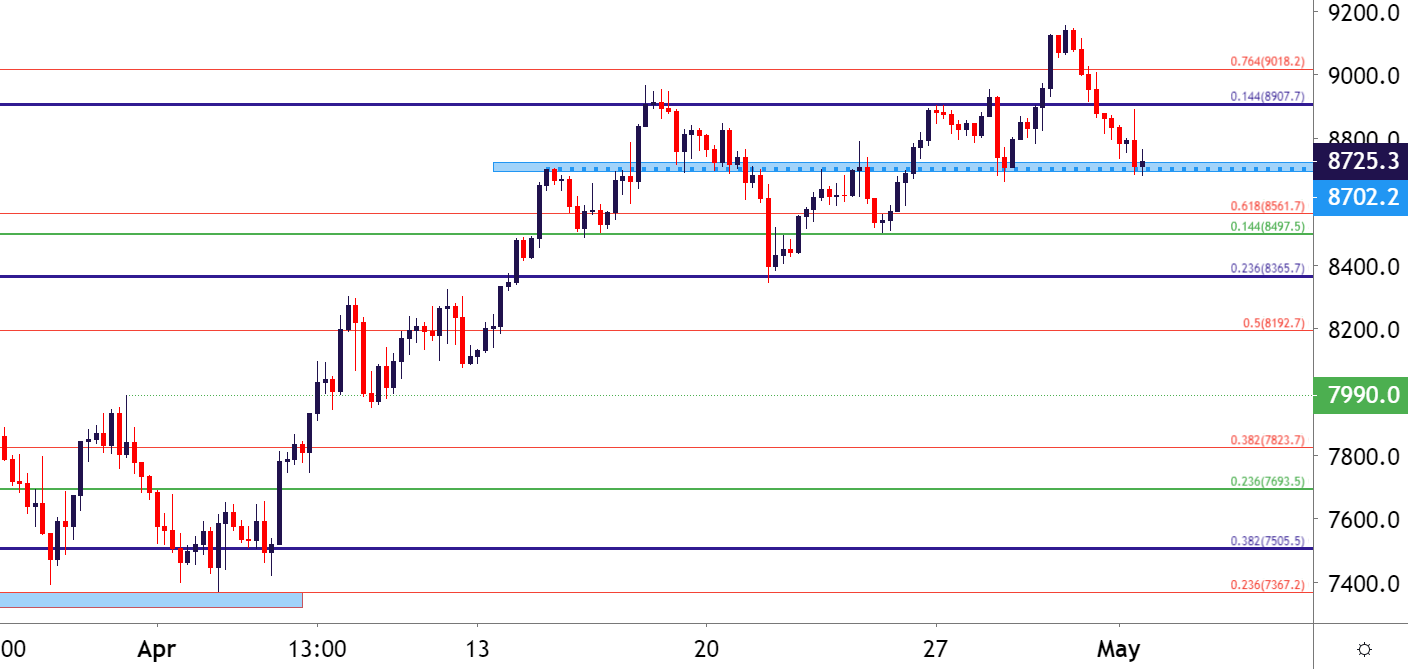
Chart prepared by James Stanley; Nasdaq 100 on Tradingview
US Dollar Tests Support at Monthly Lows
Back in currency land, that Fed stimulus with the hope for more has driven the US Dollar down for a test of the April lows. This takes place around the 50% marker of the March major move and, perhaps surprisingly, the US Dollar has now been range-bound for much of the past month, as that brute-force equity rally was taking the world by storm.
In the US Dollar, it appears as though there is some element of alignment with risk themes; as the risk-on trade continuing as it did in April would likely entail considerable confidence that the Fed and US Treasury departments are going to continue providing stimulus to markets in the effort of offsetting capital destruction. This would run in stark contrast to the major move seen in mid-March when the currency gained as much as 8.8% in a ten-day-period, rallying on the back of a ‘flight to quality’ that saw investors jump out of gold, oil and stocks in favor of cash.

Recommended by James Stanley
Download our fresh US Dollar Forecast
US Dollar Eight-Hour Price Chart
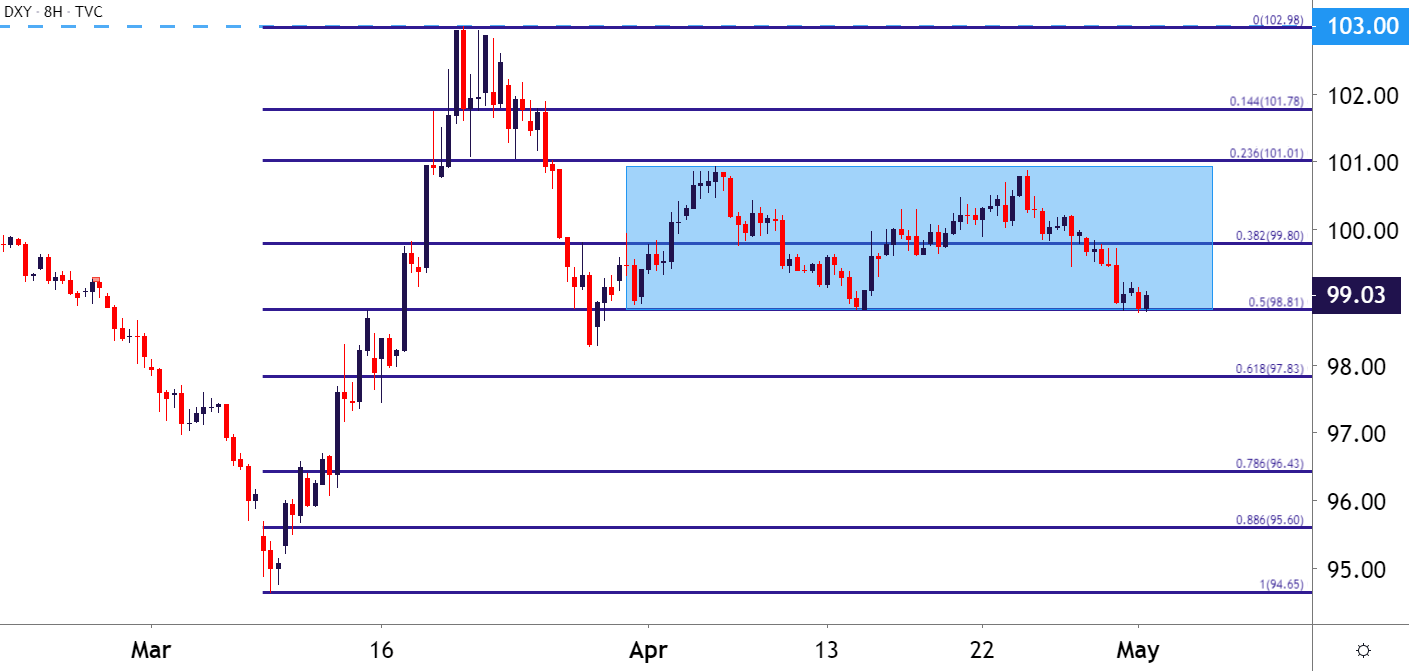
Chart prepared by James Stanley; USD, DXY on Tradingview
— Written by James Stanley, Strategist for DailyFX.com
Contact and follow James on Twitter: @JStanleyFX
Be the first to comment